The Project
  • 首页
  • 关于
  • 快报
  • 通报
  • 方法
  • 出版物
  • 联系我们
  • 中文
    • 中文
    • English
    • Português
  • 登录

Global Crop Production Index Focus and perspectives
作者: 编辑:


5.1 Global Crop Production Index
                                        Global_CPI_Curve.png      

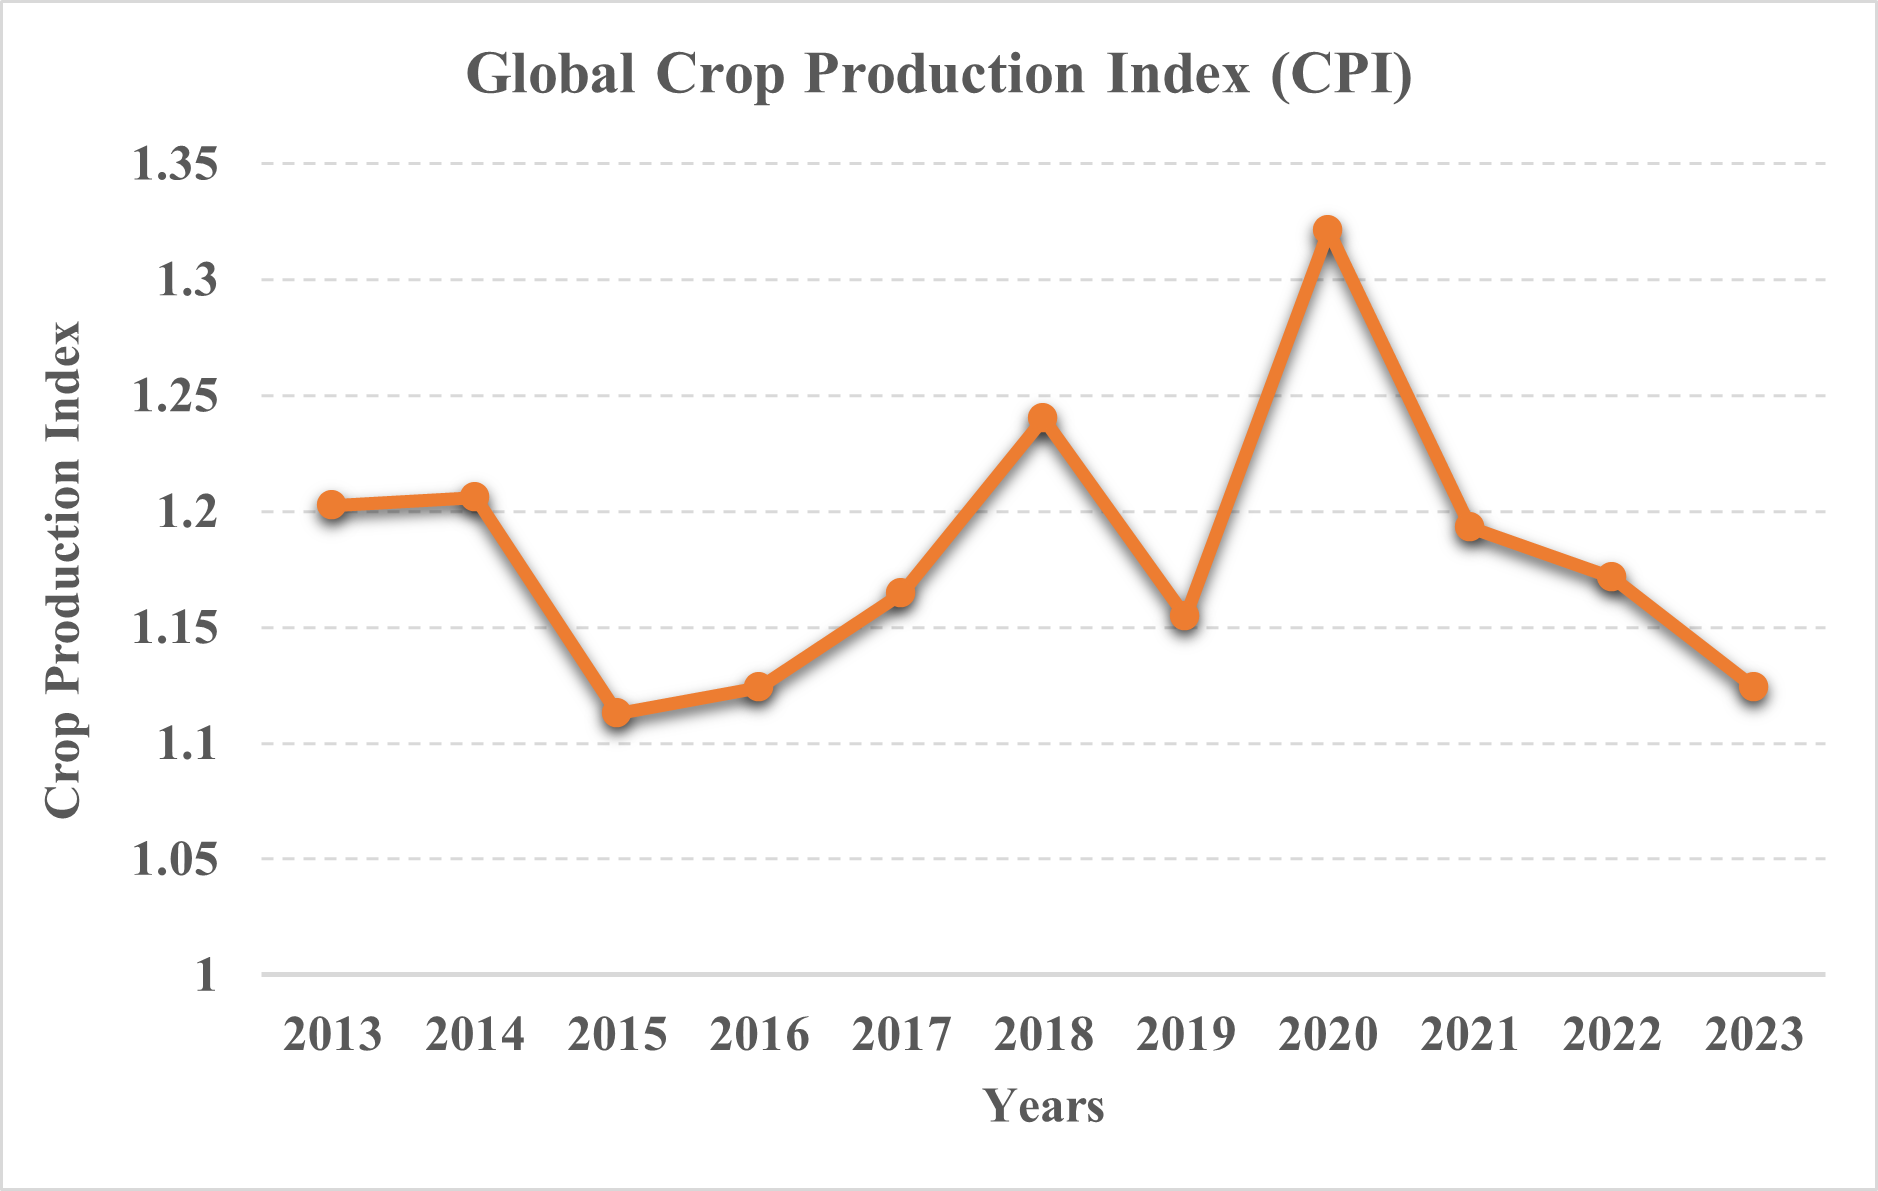
Figure 5.1 Global CPI for the past 11 years during the current monitoring period (from October of the previous year to January of the current year).

For the current monitoring period, the Crop Production Index (CPI) for global crop production reached its highest level in almost 11 years in 2020. However, from 2021 onwards, the global CPI declines for three consecutive years, from 1.19 to 1.12 in 2023, which is close to the lowest level in the past 11 years (i.e. 1.11 in 2015) and the second lowest level in nearly 11 years. The downward trend in the CPI over the past three years indicates that global agricultural production is facing severe challenges, which are expected to continue in 2023. The causes of this trend are complex, but climate change and extreme weather events appear to be key factors. Effective strategies are needed to mitigate the impact of these factors and ensure sustainable agricultural production to meet the growing global demand for food.

The Crop Production Index (CPI) is an indicator proposed by CropWatch to characterize the agricultural production situation in a designated area. The index takes into account the distribution of irrigated and rainfed cropland, VCIx, CALF, land productivity, and crop acreage in a designated area to measure the production situation in a given growing season in a normalized value.


菜单

  • Executive summary
    • Executive summary
  • Global agroclimatic patterns
    • Global agroclimatic patterns
  • Crop and environmental conditions in major production zones
    • Overview
    • West Africa
    • North America
    • South America
    • South and Southeast Asia
    • Western Europe
    • Central Europe to Western Russia
  • Main producing and exporting countries
    • Overview
    • Country analysis
    • Afghanistan
    • Angola
    • Argentina
    • Australia
    • Bangladesh
    • Belarus
    • Brazil
    • Canada
    • Germany
    • Egypt
    • Ethiopia
    • France
    • United Kingdom
    • Hungary
    • Indonesia
    • India
    • Iran
    • Italy
    • Kazakhstan
    • Kenya
    • Cambodia
    • Sri Lanka
    • Morocco
    • Mexico
    • Myanmar
    • Mongolia
    • Mozambique
    • Nigeria
    • Pakistan
    • Philippines
    • Poland
    • Romania
    • Russia
    • Thailand
    • Türkiye
    • Ukraine
    • United States
    • Uzbekistan
    • Viet Nam
    • South Africa
    • Zambia
    • Kyrgyzstan
    • Syria
    • Algeria
  • China
    • Overview
    • Northeast region
    • Inner Mongolia
    • Huanghuaihai
    • Loess region
    • Lower Yangtze region
    • Southwest China
    • Southern China
  • Focus and perspectives
    • Global Crop Production Index
    • 2023 Global production outlook
    • Disaster events
    • Update on El Niño or La Niña
  • Annex
    • Annex A. Agroclimatic indicators and BIOMSS
    • Annex B. Quick reference guide to CropWatch indicators, spatial units, and production estimation methodology

Figures

  • 北京市朝阳区北辰西路奥运科技园区
  • +86 10-64842375/6
  • +8610-64858721(传真)
  • 许可证号:京ICP备05080539号-16
  • cropwatch@radi.ac.cn

中国科学院空天信息创新研究院(AIRCAS)

RADI CAS

Copyright © 2025 中国科学院空天信息创新研究院生态系统遥感研究室