No crops were grown in Mongolia during the monitoring period from October 2022 to January 2023, as the country only grows summer crops from May to September. With only 2.9% of arable land under irrigation, crop growth is highly dependent on rainfall. Therefore, the accumulation of snow and soil moisture during the winter months is important for the successful production of summer crops. Of the CropWatch agroclimatic indicators, precipitation and temperatures were slightly below the 15-year average (RAIN -4%, TEMP -0.5°C), while solar radiation was close to average (RADPAR +0%). The national average VCIx was 0.66, significantly lower than the same period last year (0.93). The Crop Production Index (CPI) was only 0.21, also much lower than last year (0.84). Additionally, the NDVI was significantly below the five-year average during the monitoring period.
The poor vegetation conditions in Mongolia during the monitoring period were largely due to an extreme cold wave, which caused over 70% of the country to be covered in snow and ice (source: https://www.imsilkroad.com/news/p/498360.html). The temperature profile shows that Mongolia was cooler than usual from late November to mid-December, which coincides with the occurrence of the extreme cold wave. The extreme cold wave in Mongolia led to an unusual amount of snow cover, resulting in a decline in NDVI.
However, with wheat planting in Mongolia only starting three months later (in May), the impact of the current extreme weather on future crop production is still uncertain and requires further monitoring.
Regional analysis
Based on cropping systems, climatic zones, and topographic conditions, Mongolia can be divided into five agro-ecological zones (AEZ): Altai (135), Gobi Desert (136), Hangai Khuvsgul Region (137), Selenge-Onon Region (138) and Central and Eastern Steppe (139). Altai and Gobi Desert have no cultivated land, so we are mainly concerned with the three regions of Hangai Khuvsgul Region, Selenge-Onon Region and Central and Eastern Steppe.
The Hangai Khuvsgul region is in the northwest of Mongolia, and the Selenge-Onon region is in the central north of Mongolia. These two regions have been affected by extremely cold weather, so their agroclimatic conditions are similar to the overall situation in the country. Precipitation decreased by 8% and 4% respectively, temperatures decreased by 0.9°C and 0.5°C respectively, while solar radiation was equal to the 15-year average. The VCIx values were 0.60 and 0.68, respectively. The Central and Eastern Steppe region was slightly less affected by the extreme cold compared to the above two regions, with an 11% increase in precipitation, a 0.3°C decrease in temperature and a 1% decrease in solar radiation, while the VCIx was 0.72.
The extreme cold weather and high snowfall may have negatively impacted the production of livestock.
Figure 3.32 Mongolia's crop condition, October 2022 - January 2023
| |
(a) Phenology of major crops | |
|
|
(b) Crop condition development graph based on NDVI | (c) Maximum VCI |
| |
(d) Spatial NDVI patterns compared to 5YA (e) NDVI profiles | |
| |
(f) Rainfall profiles (g) Temperature profiles | |
  | |
(h) Crop condition development graph based on NDVI (Hangai Khuvsgul Region (left) and Selenge-Onon Region (right)) | |
| |
(i) Crop condition development graph based on NDVI (Central and Eastern Steppe) | |
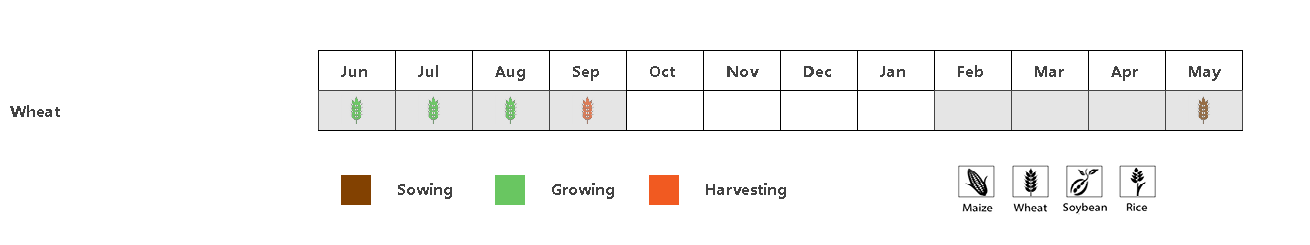
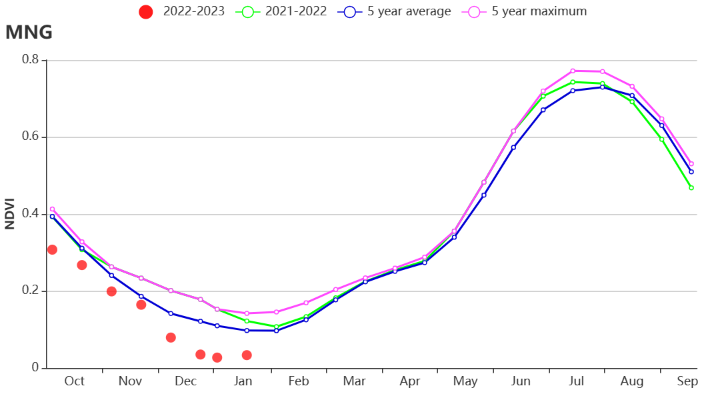
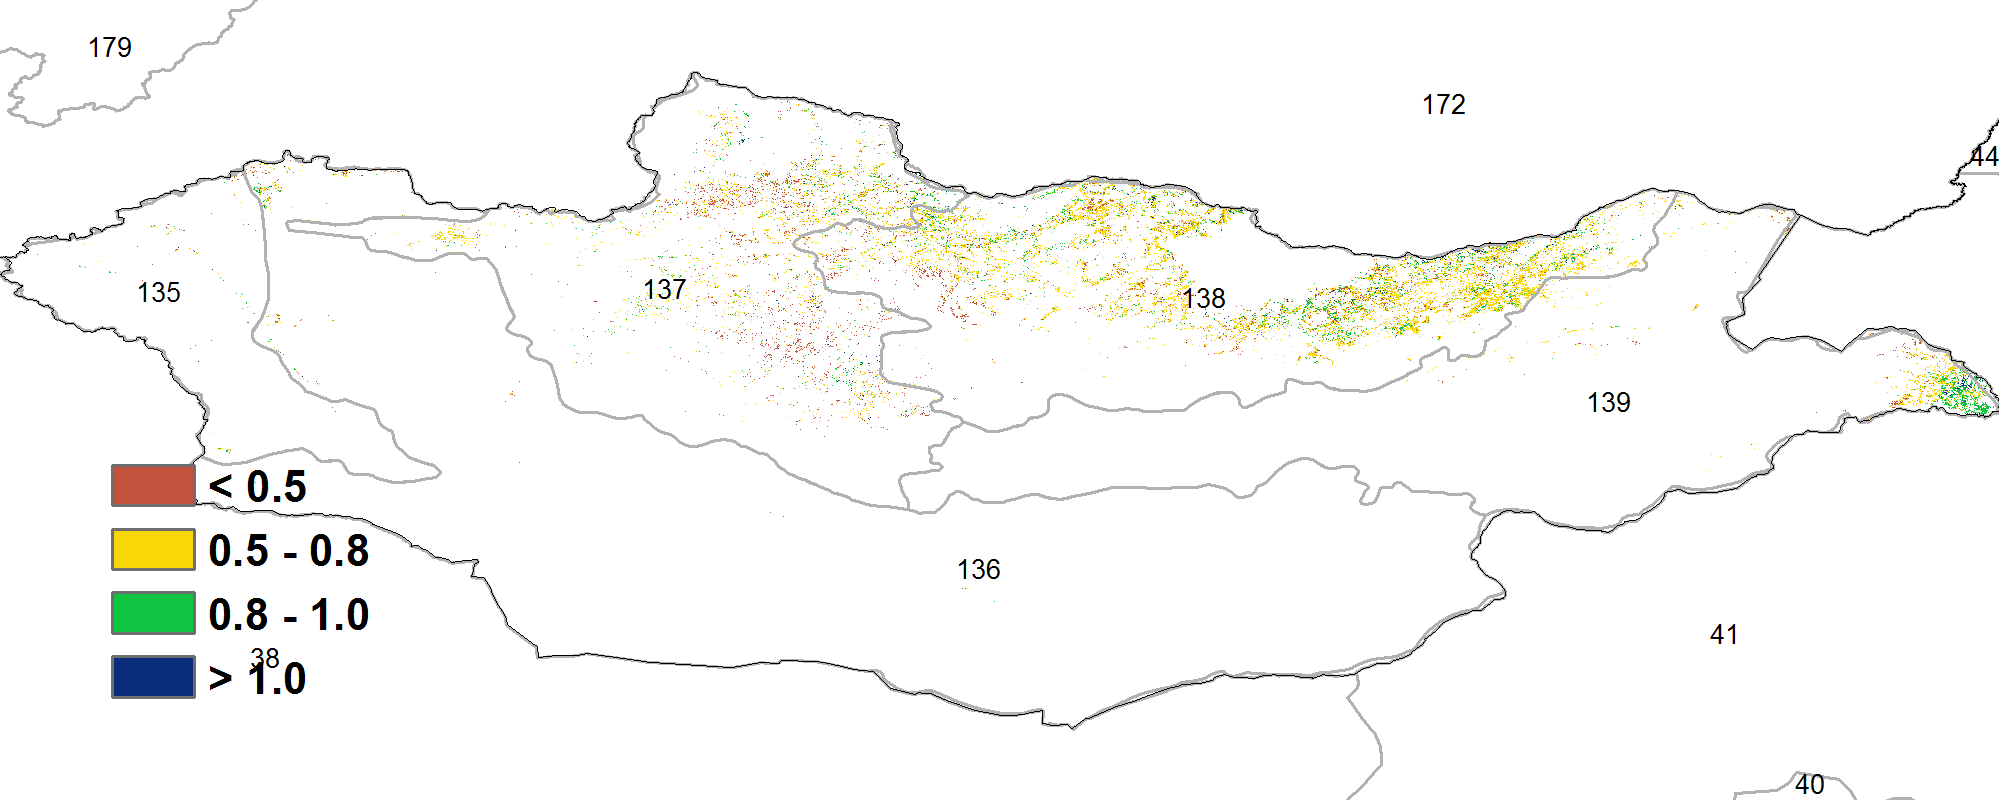

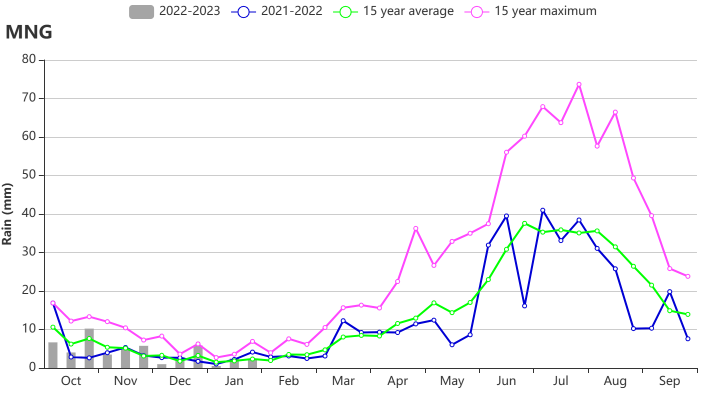
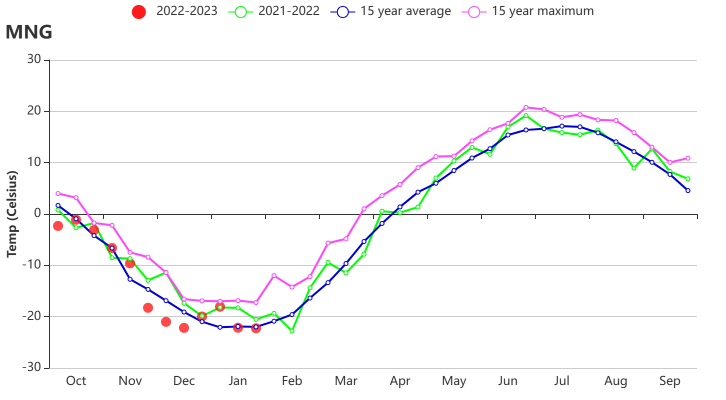

Table 3.56 Mongolia's agroclimatic indicators by sub-national regions, current season's values, and departure from 15YA, October 2022 - January 2023
Region | RAIN | TEMP | RADPAR | BIOMSS | ||||
Current (mm) | Departure (%) | Current (°C) | Departure (°C) | Current (MJ/m2) | Departure (%) | Current (gDM/m2) | Departure (%) | |
Hangai Khuvsgul Region | 42 | -8 | -15.6 | -0.9 | 455 | 0 | 88 | -11 |
Selenge-Onon Region | 49 | -4 | -13.3 | -0.5 | 447 | 0 | 124 | 0 |
Central and Eastern Steppe Region | 70 | 11 | -12.9 | -0.3 | 451 | -1 | 140 | -1 |
Altai Region | 39 | -51 | -14.1 | -0.9 | 435 | 5 | 101 | -9 |
Gobi Desert Region | 27 | -45 | -11.8 | 0.5 | 422 | 4 | 78 | -18 |
Table 3.57 Mongolia's agronomic indicators by sub-national regions, current season's values, and departure from 5YA, October 2022 - January 2023
Region | Cropped arable land fraction | Maximum VCI | |
Current (%) | Departure (%) | Current | |
Hangai Khuvsgul Region | 2 | -76 | 0.60 |
Selenge-Onon Region | 11 | -67 | 0.68 |
Central and Eastern Steppe Region | 0 | -98 | 0.72 |
Altai Region | 0 | -92 | 0.57 |
Gobi Desert Region | 6 | -39 | 0.57 |