This monitoring period covers the completion of the sowing of winter crops in October followed by early vegetative growth and a subsequent dormancy period over the winter.
At the national level, data showed that NDVI before the snow cover establishment was mainly below the 5-year average, which indicates that winter crop status before the winter was slightly subpar.
Precipitation in October was above the level of the previous year. In the middle of November and December, it was above the 15-year maximum. Till the middle of January, the amount of precipitation was close to the 15-year average and then it dropped below the level of the previous year.
Temperature from October till November was at the level of last year and the 15-year average. In November it dropped below the level of the last year. In December and January, temperatures were above the 15YA.
Among the major winter crop production regions, Northern part of South Caucasus, North Caucasus, south-eastern part of Central Black Soil region as well as south of Middle Volga region showed positive NDVI departure through the whole monitoring period with maximum VCI near 0.8. Central region, the rest of South Caucasus and Central Black Soil region showed positive NDVI departure only in November with maximum VCI mainly up to 0.8. Ural and Western Volga region as well as the rest of Middle Volga region showed negative NDVI departure with maximum VCI mainly up to 0.8.
Agroclimatic conditions varied in major regions of winter crop production. In South Caucasus and North Caucasus regions, there was a lack of snow cover which in combination with fluctuating from positive to negative temperatures, poses a risk of winter crop damage. In Central and Central black soils regions the main concern is also temperature fluctuations which can adversely affect the state of winter crops under the snow cover.
Regional analysis
South Caucasus
Rainfall in the South Caucasus was 24% below the 15-year average. Temperature was 0.6°C higher than the 15-year average. RADPAR increased slightly (by 1%) compared to the 15-year average. BIOMSS was down by 13% from the 15-year average. Cropped area increased by 10% compared to the 5-year average. Maximum VCI was 0.79. CPI was 1.09.
NDVI was mainly close to the 5-year average. Only in the middle of December and January it was below the 5-year average.
Due to the lack of snow cover, there is a risk of winter crop damage.
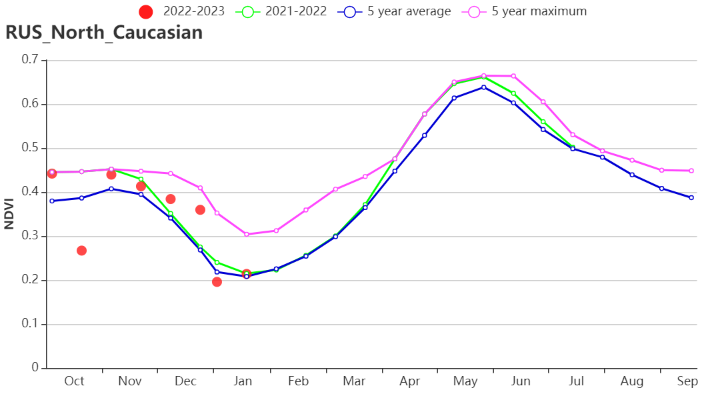
North Caucasus
In the North Caucasus, precipitation was lower by 19% compared to the 15-year average. Temperature was higher by 0.9°C compared to the 15-year average. The RADPAR value was 5% lower than the 15-year average. The BIOMSS value decreased by 6%. Cropped area increased by 35% compared to the 5-year average. Maximum VCI value was 0.86. CPI was 1.21.
NDVI value was mainly above the level of the previous year and the 5-year average except in the middle of October when it was below these two levels and January when it was close to them.
Due to the lack of snow cover, there is a risk of winter crop damage.
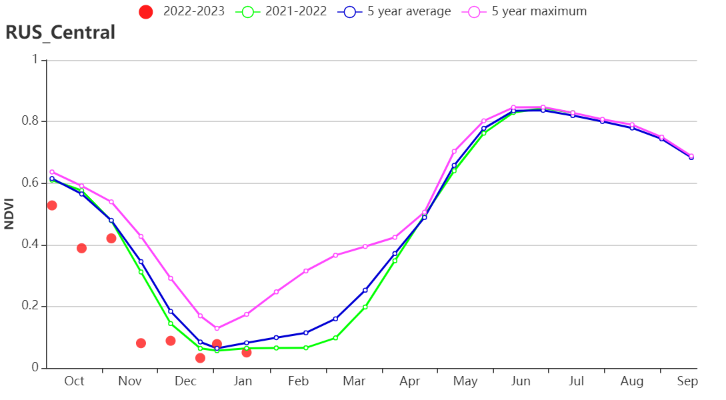
Central Russia
In Central Russia, temperature was higher by 0.6°C compared to the 15-year average, and rainfall was higher by 13% compared to the 15-year average. RADPAR decreased by 16%. BIOMSS decreased by 2% relative to the 15-year average. Cropped area was 2% below the 5-year average. Maximum VCI was 0.79. CPI was 0.99.
NDVI was mainly below 5-year average and the level of the previous year.
Overall, winter crops status was below average in this region before the establishment of snow cover.
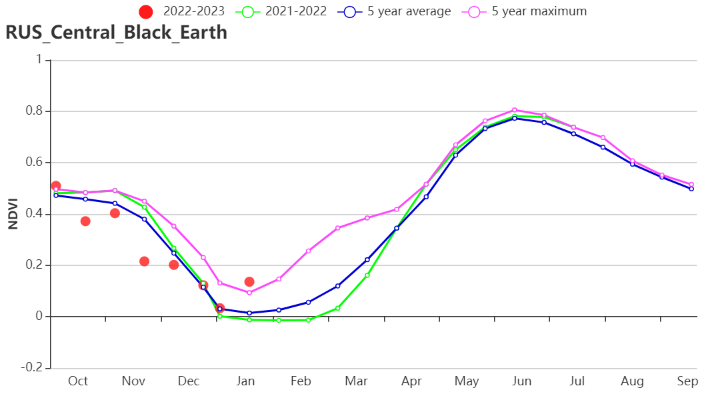
Central Black Soil Area
In Central Black Earth Region, temperature was higher by 0.7°C compared to the 15-year average. The amount of precipitation was 23% above the 15-year average, and RADPAR was lower by 16%. The amount of BIOMSS was 3% above the 15-year average. Cropped area increased by 17% relative to the 5-year average. Maximum VCI was 0.86. CPI was 1.33.
At the beginning of October NDVI was above the 5-year maximum. Then due to the early establishment of snow cover it dropped below the 5-year average and the level of the previous year till the end of December when NDVI reached the 5-year average and in January it exceeded the 5-year maximum.
Overall, the conditions for winter crops were favorable in this region, and its status is likely to be close to normal.
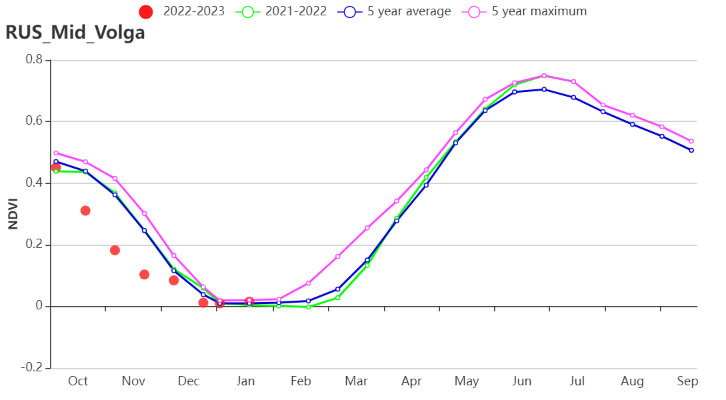
Middle Volga
In Middle Volga region, the amount of precipitation and temperature was higher than the 15-year average by 8%. and by 0.4°C correspondingly. RADPAR decreased by 10% compared to the 15-year average. BIOMSS increased by 3% compared to the 15-year average. The cropped area was 2% lower than the 5-year average. Maximum VCI was 0.83. CPI was 1.09.
NDVI was mainly below the 5-year average and the value of the previous year mainly due to the early snow cover establishment and the decrease in the sowing area.
Overall, the conditions for winter crops were favorable in this region, and its status is likely to be better than normal.
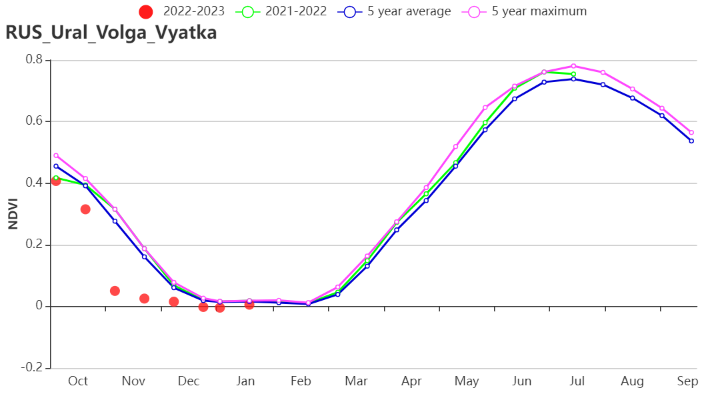
Ural and the Western Volga
In the Ural and the Western Volga region, the amount of precipitation was at the level of the 15-year average. Temperature increased by 0.4°C compared to the 15-year average. RADPAR was 2% below the 15-year average. BIOMSS was 3% higher than the 15-year average. Cropped area was 17% lower than the 5-year average. Maximum VCI was 0.74. CPI was 0.71.
NDVI was mainly below the 5-year average and the level of the previous year
Conditions for winter crops and their status were below average for this region.
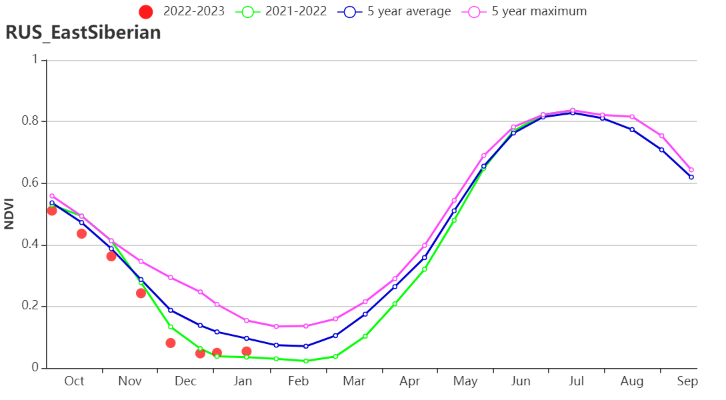
Eastern Siberia
In Eastern Siberia, the amount of precipitation was 12% below the 15-year average. The temperature was higher than the 15-year average by 0.9°C. RADPAR was lower by 3% compared to the 15-year average. BIOMSS was higher by 7% compared to the 15-year average. Cropped area was 2% lower than the 5-year average. Maximum VCI was 0.84. CPI was 0.65.
Till December, NDVI was below the 5-year average, then it reached the level of the previous year.
The area of winter crops is insignificant in this region, therefore its agroclimatic conditions will not affect winter crop production in the Russian Federation.
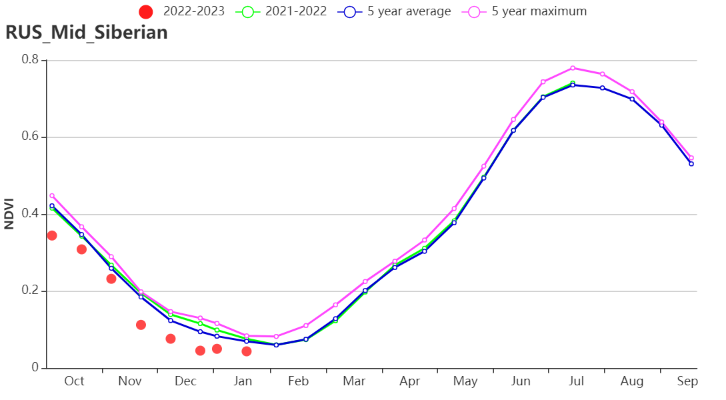
Middle Siberia
In Middle Siberia, rainfall and temperature decreased compared to the 15-year average by 15%, and by 0.1°C correspondingly. RADPAR increased by 2% above the 15-year average. BIOMSS was 2% lower than the 15-year average. Cropped area was 36% lower than the 5-year average. Maximum VCI was 0.67. CPI was 0.75.
NDVI was below the level of the previous year and the 5-year average.
The area of winter crops is insignificant in this region, therefore its agroclimatic conditions will not affect winter crop production in the Russian Federation.
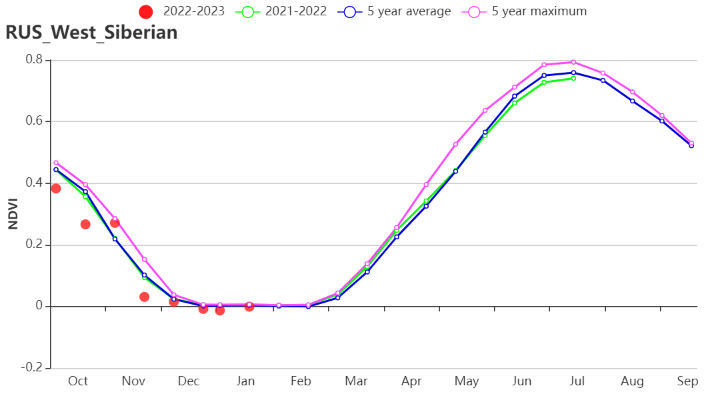
Western Siberia
In Western Siberia, rainfall was at the level of the 15-year average. Air temperature increased by 0.6°C relative to the 15-year average. The RADPAR was 2% lower than the 15-year average. BIOMSS increased by 4% compared to 15-year average. Cropped area decreased by 33% compared to the 5-year average. Maximum VCI was 0.74. CPI was 0.64.
NDVI was mainly below the level of the previous year and below the 5-year average except in the middle of November when it reached the 5-year maximum
The area of winter crops is insignificant in this region, therefore its agroclimatic conditions will not affect winter crop production in the Russian Federation.
Figure 3.39 Russia’s crop condition, October 2022 – January 2023
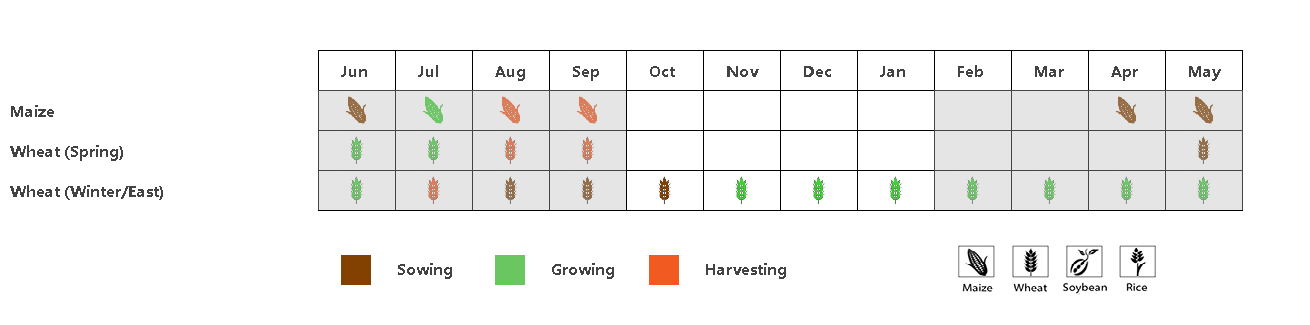
(a). Phenology of major crops
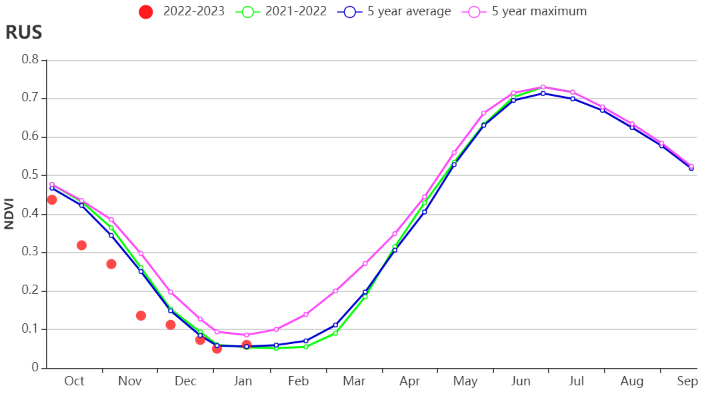
(b) Crop condition development graph based on NDVI

(c) Maximum VCI
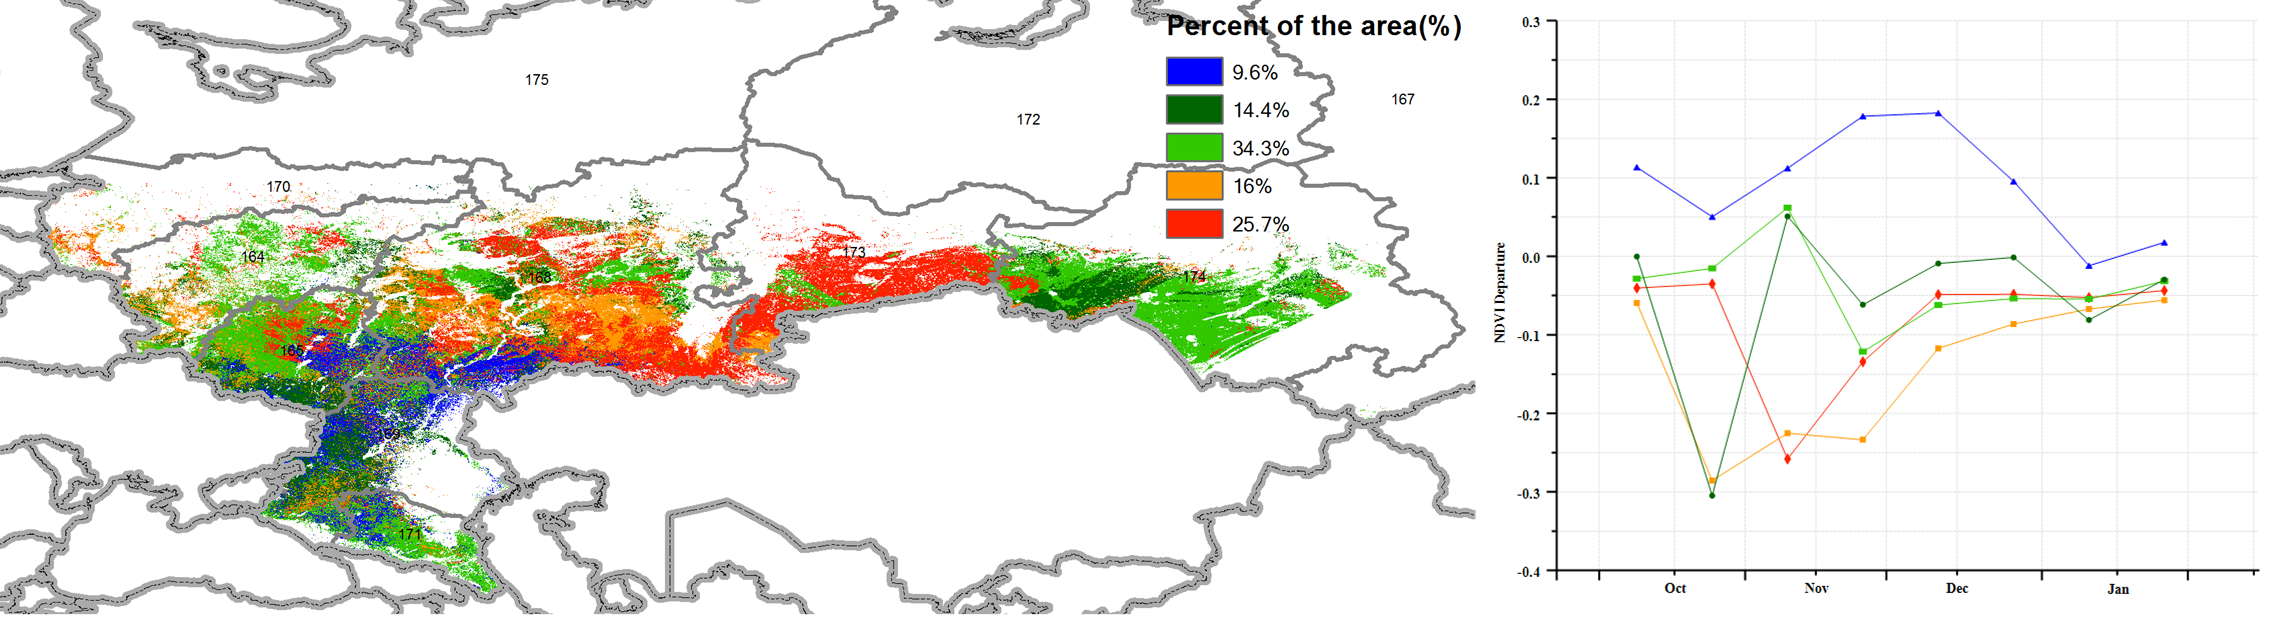
(d) Spatial NDVI patterns compared to 5YA (e) NDVI profiles
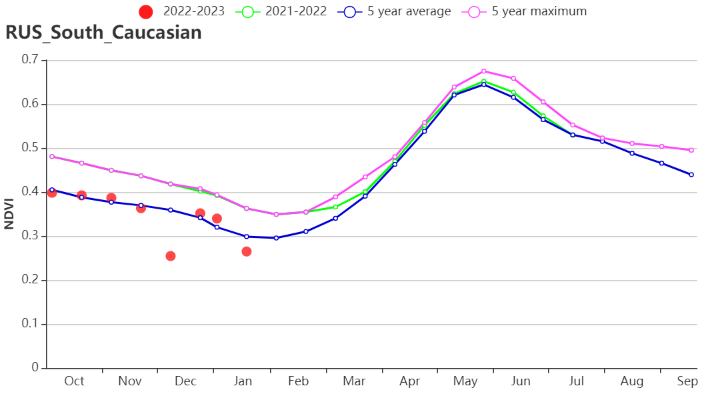
(f) Crop condition development graph based on NDVI (Southern Caucasus and Northern Caucasus)
(g) Crop condition development graph based on NDVI (Central Russia and Central black soils area)
(h) Crop condition development graph based on NDVI (Middle Volga and Ural and western Volga region)
(i) Crop condition development graph based on NDVI in the Eastern Siberia and the Middle Siberia
(j) Crop condition development graph based on NDVI (Western Siberia)

(k) Rainfall index
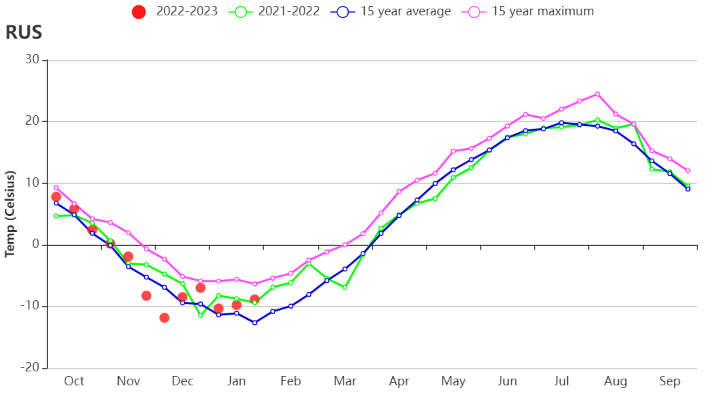
(l) Temperature index
Table 3.70 Russia’s agroclimatic indicators by sub-national regions, current season’s values and departure from 15YA, October 2022 – January 2023
Region | RAIN | TEMP | RADPAR | BIOMSS | ||||
Current (mm) | Departure from 15YA(%) | Current (°C) | Departure from 15YA(%) | Current (MJ/m2) | Departure from 15YA(%) | Current(gDM/m2) | Departure from 15YA(%) | |
Central Russia | 334 | 13 | -1.2 | 0.6 | 111 | -16 | 317 | 2 |
Central black soils area | 319 | 23 | -0.3 | 0.7 | 165 | -16 | 350 | 3 |
Eastern Siberia | 194 | -12 | -8.9 | 0.9 | 341 | -3 | 213 | 7 |
Middle Siberia | 106 | -15 | -12.5 | -0.1 | 322 | 2 | 127 | -2 |
Middle Volga | 277 | 8 | -3.8 | 0.4 | 160 | -10 | 272 | 3 |
Northern Caucasus | 197 | -19 | 3.3 | 0.9 | 314 | -5 | 400 | -6 |
South Caucasus | 179 | -24 | 3.1 | 0.6 | 431 | 1 | 346 | -13 |
Ural and western Volga region | 180 | 0 | -6.7 | 0.4 | 174 | -2 | 220 | 3 |
Western Siberia | 222 | 0 | -7.5 | 0.6 | 203 | -2 | 209 | 4 |
Table 3.71 Russia’s agronomic indicators by sub-national regions, current season’s values and departure from 5YA, October 2022 – January 2023
Region | Cropped area | Maximum VCI | |
Current (%) | Departure from 5YA(%) | Current | |
Central Russia | 97 | -2 | 0.79 |
Central black soils area | 86 | 17 | 0.86 |
Eastern Siberia | 85 | -2 | 0.84 |
Middle Siberia | 27 | -36 | 0.67 |
Middle Volga | 63 | -2 | 0.83 |
Northern Caucasus | 74 | 35 | 0.86 |
South Caucasus | 65 | 10 | 0.79 |
Ural and western Volga region | 52 | -17 | 0.74 |
Western Siberia | 39 | -33 | 0.74 |