During this reporting period, the summer crops such as maize and rice were harvested, followed by the sowing of winter wheat in November. The CropWatch agro-climatic indicators showed that rain was 30% below the 15-year (15YA) average. According to the rainfall profile, high rainfall >10 mm, fell in late December and first January. The temperature was only 0.2°C above the 15YA. The temperature profile fluctuated around 15YA. The RADPAR was 2.9% above the 15YA while the BIOMSS was 13% below the 15YA. The nationwide NDVI profile trended below the 5YA crop conditions. The NDVI spatial pattern shows that only 10.6% of the cultivated area was above the 5YA across the study period, 41.3% fluctuated around 5YA, and 48.2% was below the 5YA. For the whole country, the VCIx value was 0.73, and the CALF was at 5YA, indicating reasonable crop conditions. The nationwide crop production index (CPI) was at 1.01 implying normal crop production situation.
Regional Analysis
Egypt can be subdivided into three agroecological zones (AEZs) based on cropping systems, climatic zones, and topographic conditions. Only two are relevant for crops: 1) the Nile Delta and the Mediterranean coastal strip and 2) the Nile Valley.
All agro-climatic indicators for these two AEZs are consistent with the national trend. Rainfall was 32%, 40% below the 15YA in both zones. The temperature was only 0.1°C above the 15YA in the first zone and at the 15YA in the second zone. The RADPAR was 3.4% and 0.4 above the 15YA in the first and second zones, respectively. The Biomass was 8% and 35% below the 15YA in both zones. The NDVI-based crop condition development graphs in both zones were similar to the nationwide NDVI profile. Since most of the agricultural land in Egypt is irrigated, the rainfall had little impact on the production levels of maize and rice. However, additional water usually has a beneficial effect. The nationwide crop production index (CPI) was at 1.05 and 1.08 for both zones, respectively, implying above normal crop production situation following the nationwide CPI. CALF was at the 5YA, while the VCIx was 0.75 and 0.81 in both zones. The conditions for winter wheat have been favorable.
Figure 3.14 Egypt’s crop condition, October 2022 - January 2023
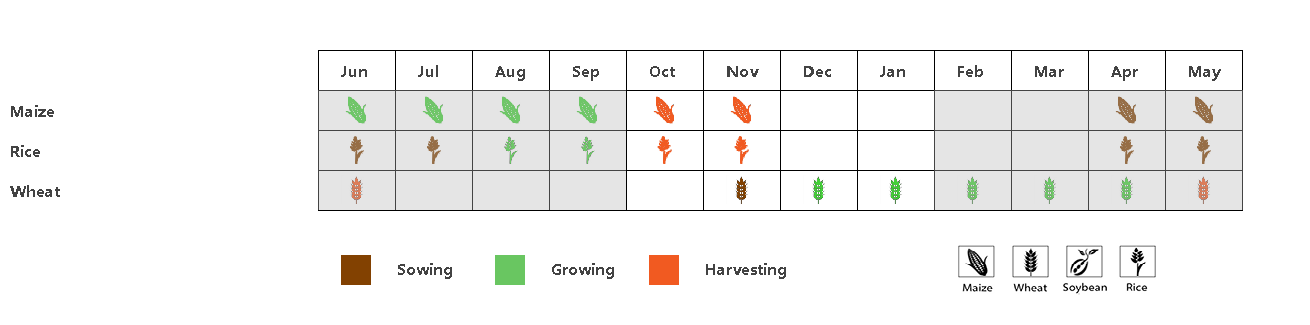
(a). Phenology of major crops
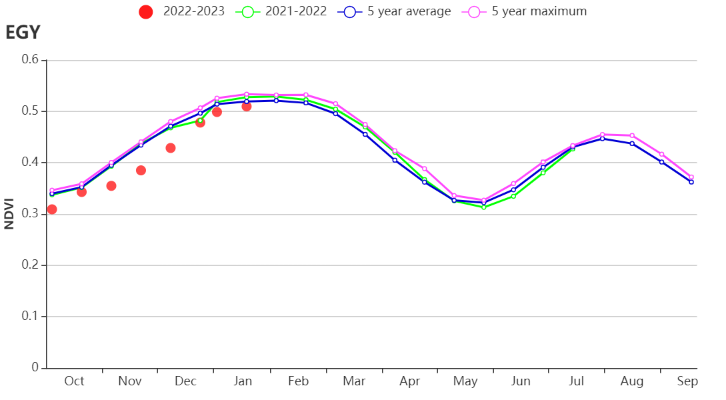
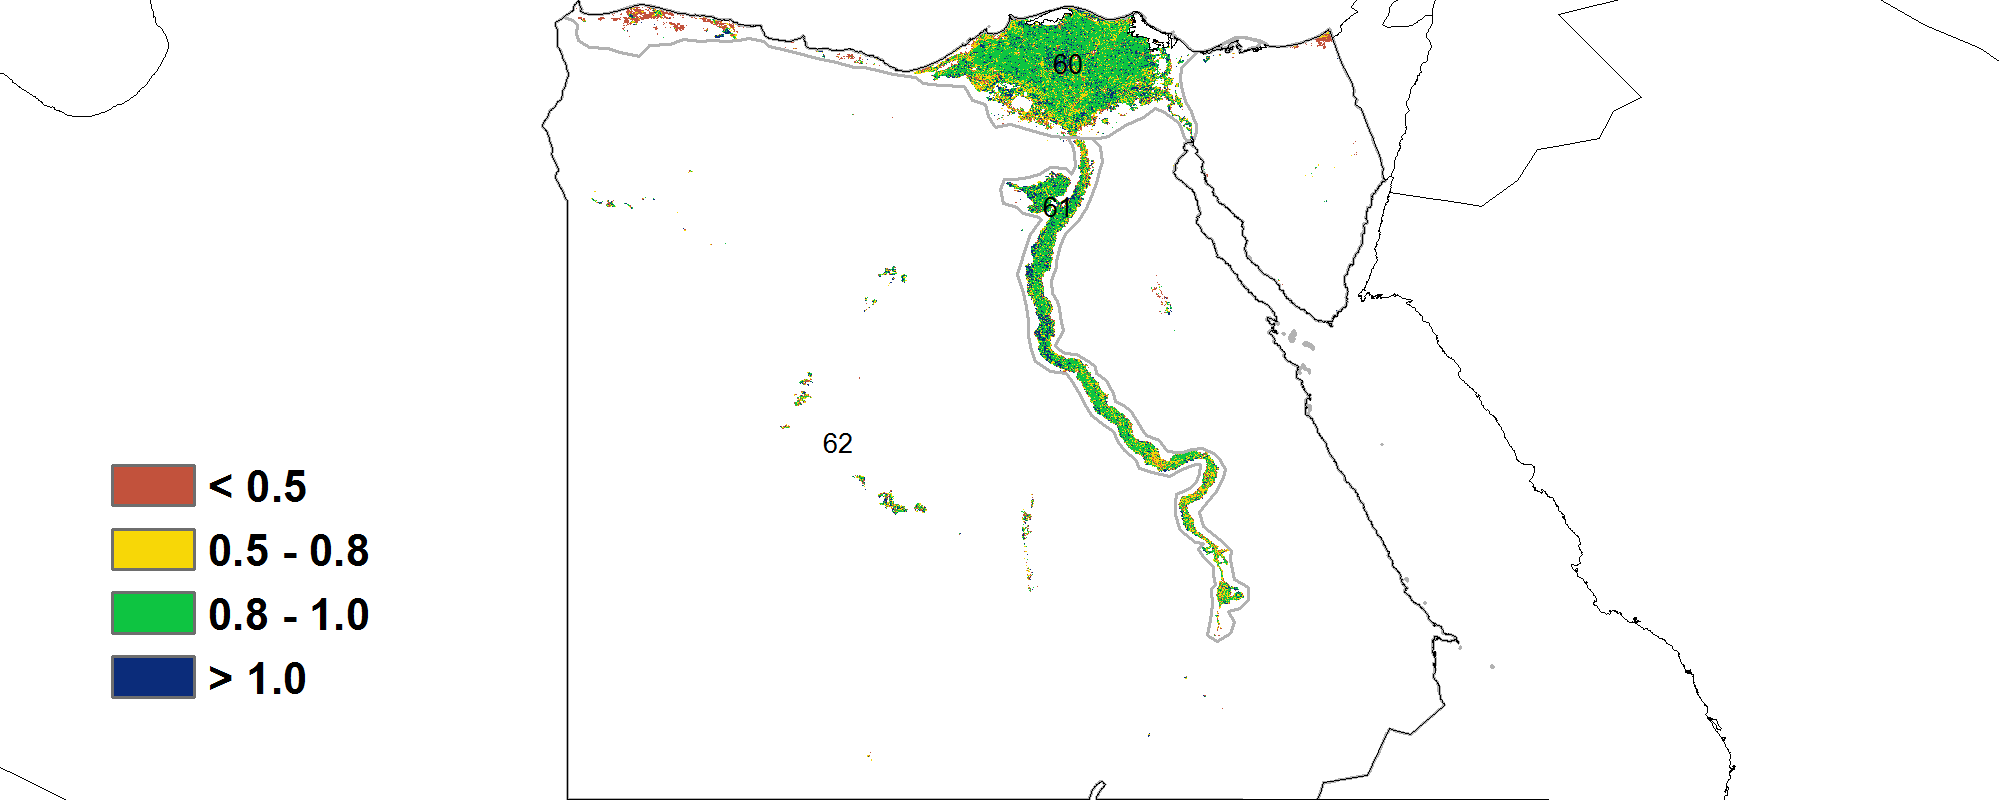
(b) Crop condition development graph based on NDVI(c) Maximum VCI
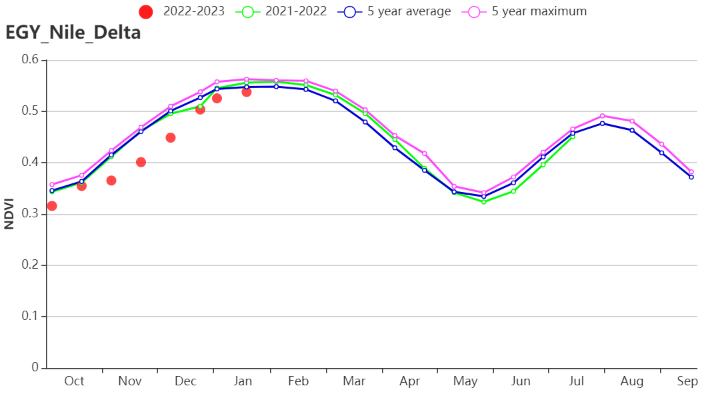
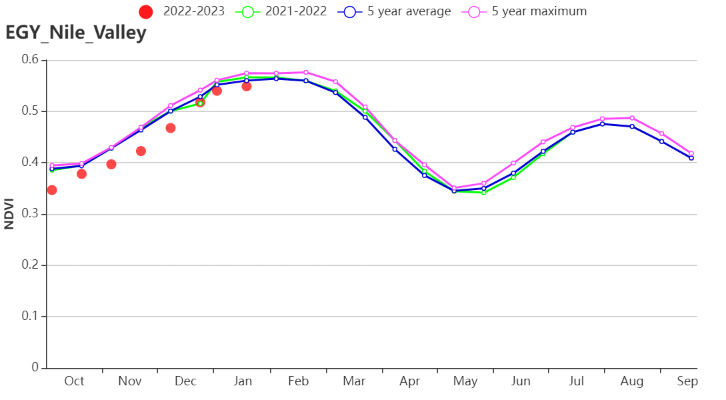
(f). Crop condition development graph based on NDVI (Nile Delta (left) and Nile Valley (right)
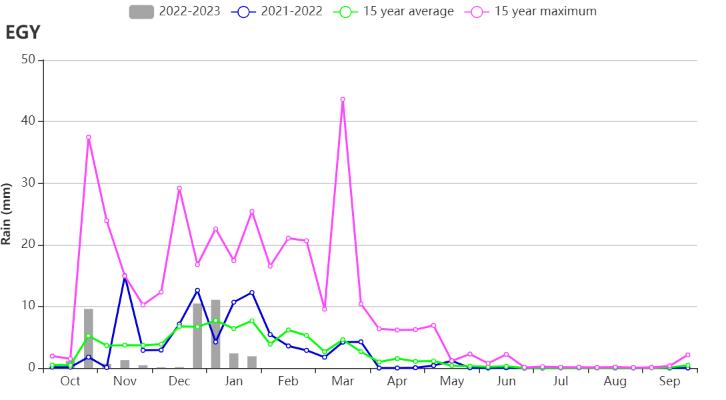
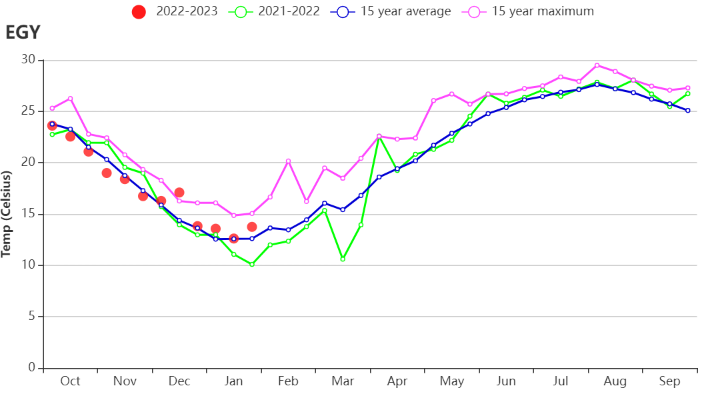
(g). Time series profile of rainfall (h). Time series profile of temperature
Table 3.21 Egypt’s agroclimatic indicators by sub-national regions, current season's values, and departure from 15YA, October 2022 - January 2023
Region | RAIN | TEMP | RADPAR | BIOMSS | ||||
Current (mm) | Departure from 15YA (%) | Current (°C) | Departure from 15YA (°C) | Current (MJ/m2) | Departure from 15YA (%) | Current (gDM/m2) | Departure from 15YA (%) | |
Nile Delta and Mediterranean coastal strip | 42 | -32 | 17.4 | 0.1 | 785 | 3.4 | 282 | -8 |
Nile Valley | 8 | -40 | 17.0 | 0.0 | 870 | 0.4 | 128 | -35 |
Table 3.22 Egypt’s agronomic indicators by sub-national regions, current season’s values, and departure from 5YA, October 2022 - January 2023
Region | CALF | Maximum VCI | |
Current (%) | Departure from 5YA (%) | Current | |
Nile Delta and | 70 | 0 | 0.75 |
Nile Valley | 80 | 0 | 0.81 |