The monitoring period from October 2022 to January 2023 covers the sowing and early growth stages of winter wheat in Uzbekistan. Among the CropWatch agroclimatic indicators, the radiation (RADPAR) was slightly above average (+2%), while temperature (TEMP) and rainfall (RAIN) were below average (-1.1°C and -5%) compared to the 15-year average (15YA). From mid-October to the beginning of November, the precipitation was above average. However, the precipitation was significantly below average afterward, except for the beginning of January. The temperature in October and November was close to the 15YA, but was below the 15YA in December and January. The biomass accumulation (BIOMSS) decreased by 13%, and the NDVI development graph indicates that crop conditions were slightly below the five-year average in October, surpassed the five-year maximum in November, and remained close to the five-year average until the beginning of January.
The maximum Vegetation Condition Index (VCIx) was 0.86. The cropped arable land fraction (CALF, 24%) increased by 29% compared to its five-year average. The NDVI departure cluster profiles indicate that: (1) 41.1% of arable land experienced average crop conditions (light green), mainly in the west and south of the country. (2) 40.1% of arable land (red and dark green), mainly in the central area of the Eastern hilly cereals zone, had average crop conditions in October, and had better crop conditions than average in November and December before a marked drop at the end of January. (3) 11.1% of arable land (orange) showed unfavorable conditions in October, early December and January, mainly in the east of the Eastern hilly cereals zone. Most likely, the large drops of NDVI can be attributed to cloud cover in the satellite images and snow. Overall, conditions for wheat production can be assessed as average.
Regional analysis
Based on cropping systems, climatic zones and topographic conditions, three sub-national agro-ecological regions (AEZ) can be distinguished for Uzbekistan: Central region with sparse crops (210), Eastern hilly cereals zone (211), and Aral Sea cotton zone (212).
In the Central region with sparse crops, the NDVI development graph shows that the crop conditions were generally below average, except for the beginning of October and the beginning of November. RAIN and TEMP were below average (-43% and -0.7°C), while RADPAR was slightly above average (+4%). Consequently, BIOMSS decreased by 36% compared to the 15YA. The agro-climatic conditions of this region were unfavorable.
In the Eastern hilly cereals zone, RAIN and TEMP were slightly below average (-2% and -1.1°C), while RADPAR was slightly above average (+2%). The CALF was 27%. It had increased by 22% compared to the 5YA and the maximum VCI index was 0.87. The NDVI-based crop condition development graph shows a consistent pattern as the national average state, namely slightly below average in October, above five-year maximum in November, and close to average until the beginning of January. The NDVI values were lower than 0.1 at the end of January, probably due to the cloud or snow. The BIOMSS decreased slightly by 9%.
In the Aral Sea cotton zone, RAIN and TEMP were below average (-65% and -0.9°C), while RADPAR was slightly above average (+5%). These factors resulted in a decrease in BIOMSS (-45%). The CALF(17%) and VCIx (0.82) were the lowest among the three sub-national crop regions, although the CALF increased by 152% compared to the 5YA. The agro-climatic conditions of this region were unfavorable.
Figure 3.45 Uzbekistan’s crop condition, October 2022–January 2023 |

(a) Phenology of major crops |


| (b) Crop condition development graph based on NDVI (c) Maximum VCI |

| (d) Spatial NDVI patterns compared to 5YA (e) NDVI profiles |
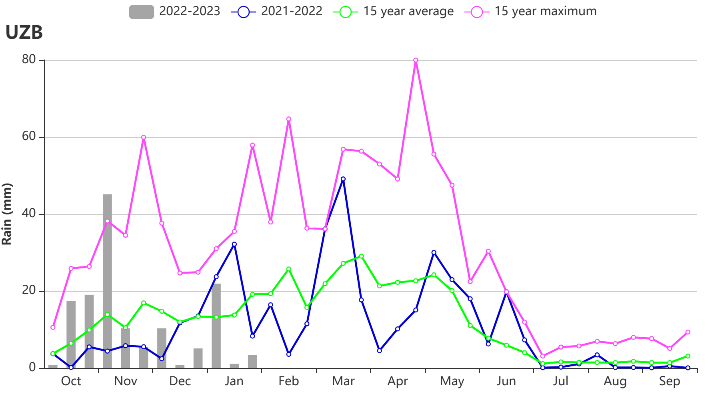
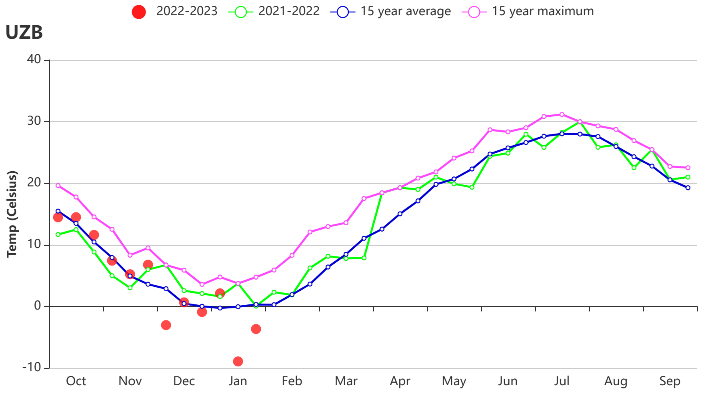
| (f) Rainfall profiles (g) Temperature profiles |

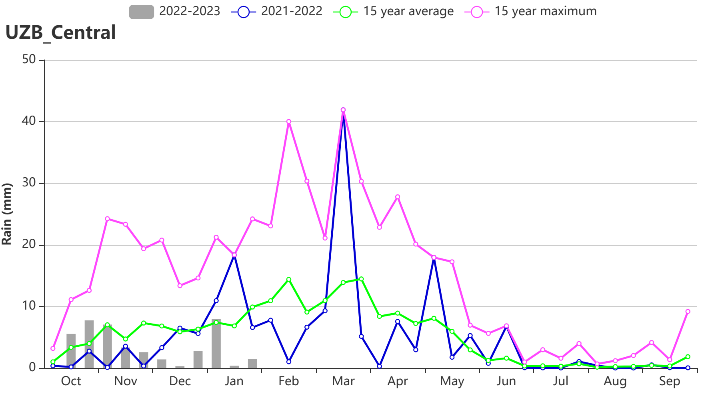
| (h) Crop condition development graph based on NDVI (left) and rainfall profile (right) of Central region with sparse crops |

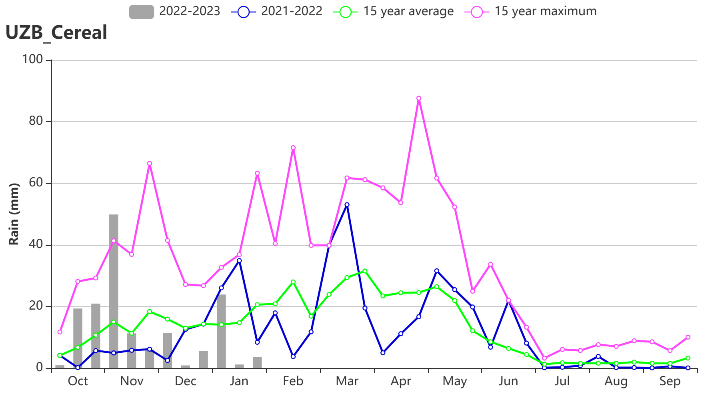
| (i) Crop condition development graph based on NDVI (left) and rainfall profile (right) of Eastern hilly cereals region |


| (j) Crop condition development graph based on NDVI (left) and rainfall profile (right) of Aral Sea cotton region |
Table 3.82 Uzbekistan’s agroclimatic indicators by sub-national regions, current season’s values and departure from 15YA, October 2022- January 2023
Region | RAIN | TEMP | RADPAR | BIOMSS | ||||
Current (mm) | Departure (%) | Current (°C) | Departure (°C) | Current (MJ/m2) | Departure (%) | Current (gDM/m2) | Departure (%) | |
Central region with sparse crops | 40 | -43 | 4.2 | -0.7 | 606 | 4 | 136 | -36 |
Eastern hilly cereals zone | 154 | -2 | 4.0 | -1.1 | 626 | 2 | 298 | -9 |
Aral Sea cotton zone | 18 | -65 | 2.7 | -0.9 | 574 | 5 | 102 | -45 |
Table 3.83 Uzbekistan’s agronomic indicators by sub-national regions, current season’s values and departure from 5YA, October 2022- January 2023
Region | Cropped arable land fraction | Maximum VCI | |
Current (%) | Departure (%) | Current | |
Central region with sparse crops | 55 | 179 | 0.92 |
Eastern hilly cereals zone | 27 | 22 | 0.87 |
Aral Sea cotton zone | 12 | 152 | 0.82 |