During this monitoring period, both second season maize and second season rice were sown in the Philippines starting in October, while the main season rice harvest was completed by the end of December. The weather in the Philippines was more humid than usual. Compared to the same period in the past 15 years, precipitation (RAIN) was significantly higher by about 31%, radiation (RADPAR) was lower by about 4%, and temperature (TEMP) remained near average. The abundant rainfall was generally favourable for crop growth, resulting in a potential biomass (BIOMASS) bias of about 6%. The NDVI development curves showed several sharp drops. The drops presumeably are artifacts, caused by cloud cover in the satellite images. However, flooding can also cause a drop in NDVI. Nevertheless, the persistent high precipitation in January may have affected the second season rice harvest and the growth of secondary maize. The spatial NDVI clustering map shows that about 34% of the cropped area (light green and orange colour) may have been adversely affected by the excessive rainfall in January. Crop NDVI in this area was well below normal in January. The remaining cropland (blue, dark green and orange colour) also have experienced a sudden drop in NDVI, but it quickly returned to normal levels. Overall crop growth in the Philippines was likely to be normal for this period.
Regional analysis
Based on the cropping systems, climatic zones and topographic conditions, three main agro-ecological regions can be distinguished for the Philippines. They are the Lowlands region (northern islands), the Hilly region (Island of Bohol, Sebu and Negros), and the Forest region (mostly southern and western islands).
The Lowland region (agroecological subzone 155) had about 26% (RAIN) higher precipitation, 0.1°C lower temperature(TEMP), 4% lower radiation (RADPAR), and about 5% higher potential biomass (BIOMASS). The proportion of cultivated land was 100%. Despite the high VCIx index of 0.94 and the high CPI index of 1.15. Overall crop growth in this region was close to average.
In Hilly region (agroecological subzone 154), the precipitation was 47% (RAIN) above the average of the last 15 years. The temperature was 0.4°C (TEMP) lower and radiation was lower by 6% (RADPAR). The potential biomass was 9% (BIOMASS) above average and all the cultivated land was planted. The VCIx index was as high as 0.93 and the CPI index was 1.11, indicating average conditions.
The precipitation in the Forest region (agroecological subzone 153) was also more than adequate (1661 mm). Precipitation was 33% (RAIN) higher than the average of the last 15 years, with a higher temperature (TEMP, 0.1°C) and lower radiation (RADPAR, -3%). The potential biomass (BIOMASS) was 5% higher and the arable land was fully utilised. The high VCIx index of 0.95 and high CPI index of 1.15 indiciate normal conditions.
Figure 3.36 Philippines' crop condition, October, 2022 - January, 2023
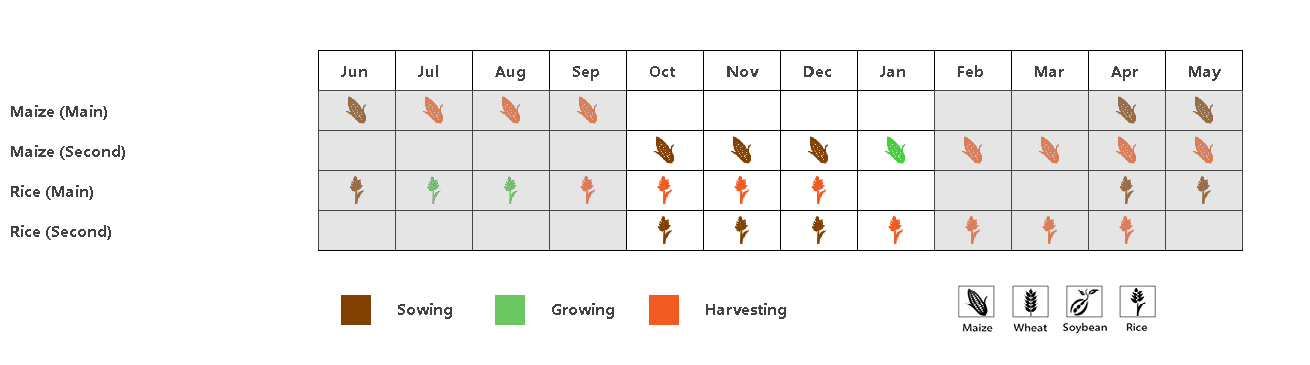
(a) Phenology of major crops
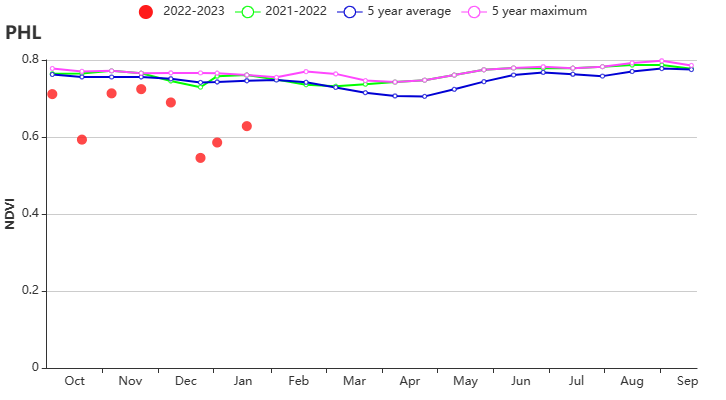
(b) Crop condition development graph based on NDVI (c) Maximum VCI
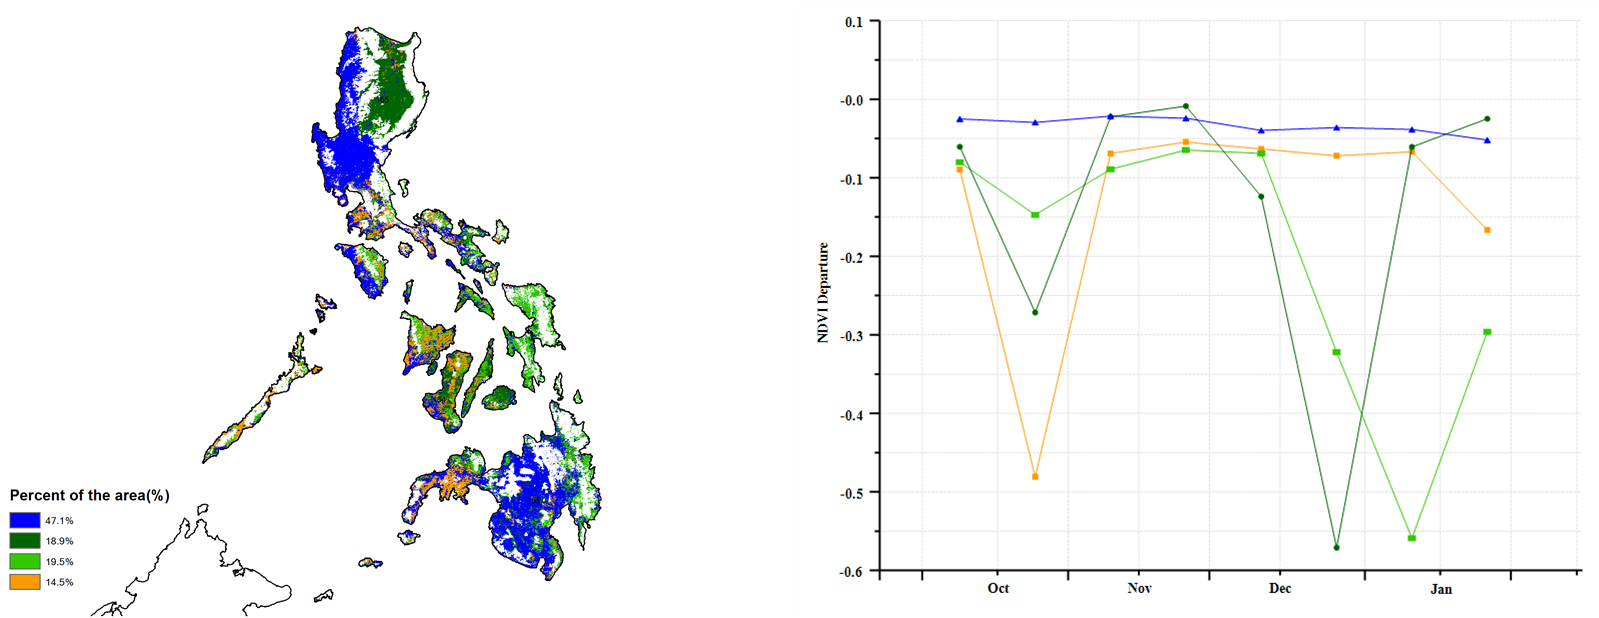
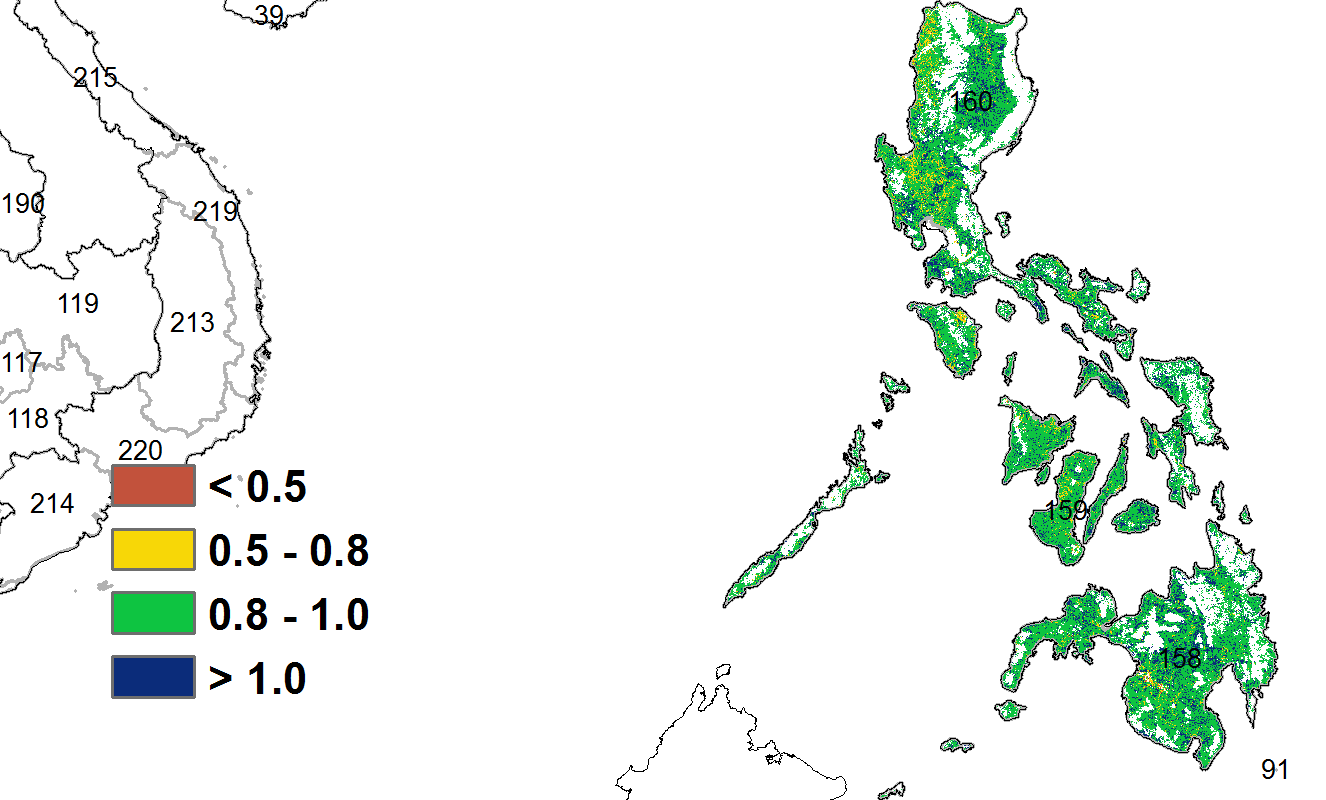
(d) Spatial NDVI patterns compared to 5YA (e) NDVI profiles
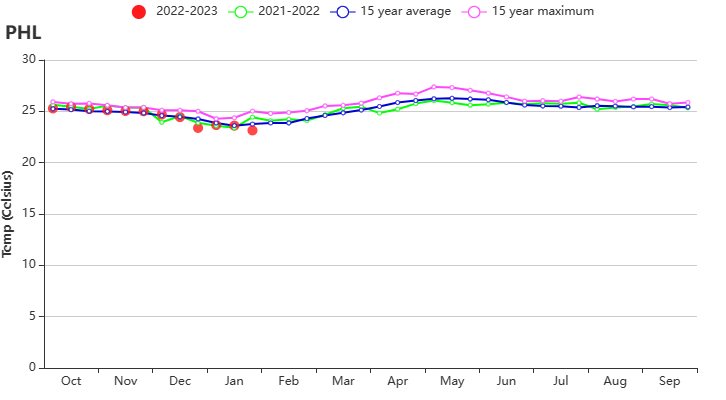
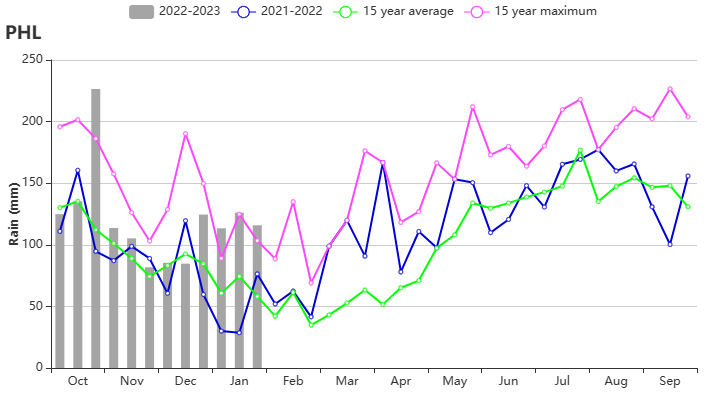
(f) Time series temperature profile (left) and rainfall profile (right)
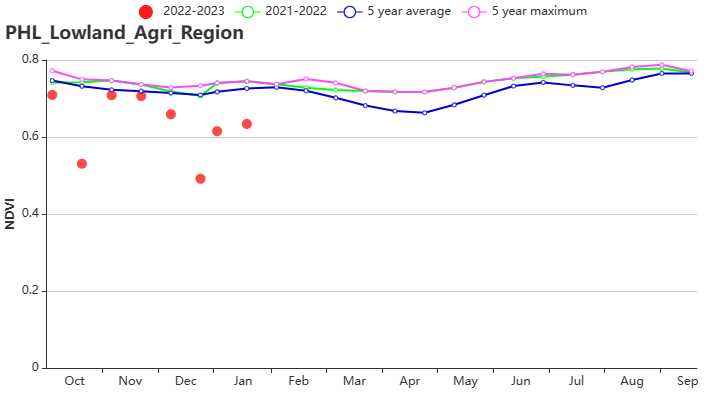
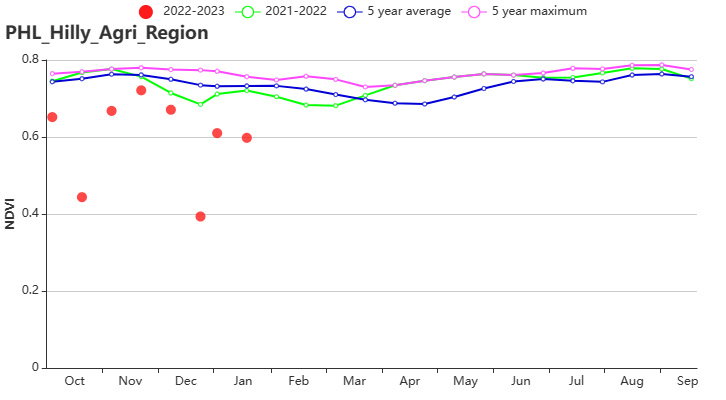
(g) Crop condition development graph based on NDVI in Lowland region (left) and in the Hilly region (right)
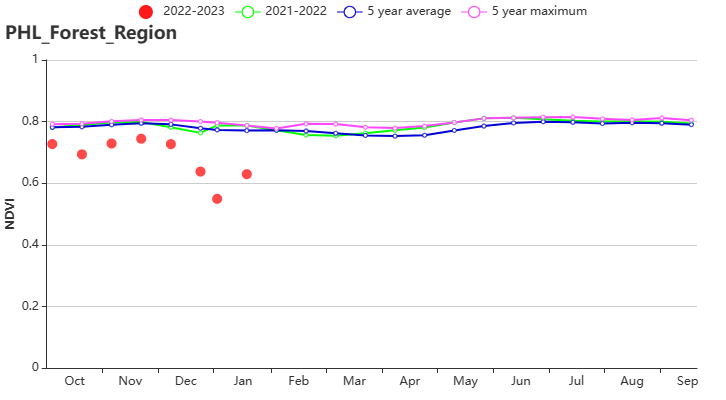
(h) Crop condition development graph based on NDVI in Forest region
Table 3.64 Philippines' agroclimatic indicators by sub-national regions, current season's values, and departure from 15YA, October 2022 - January 2023
| Region | RAIN | TEMP | RADPAR | BIOMSS | ||||
| Current(mm) | Departure from 15YA(%) | Current(°C) | Departure from 15YA(°C) | Current(MJ/m2) | Departure from 15YA(%) | Current(gDM/m2) | Departure from 15YA(%) | |
| Forest region | 1661 | 33 | 24.8 | 0.1 | 1053 | -3 | 1494 | 5 |
| Hilly region | 1748 | 47 | 25.9 | -0.4 | 1063 | -6 | 1595 | 9 |
| Lowland region | 1160 | 26 | 24.0 | -0.1 | 920 | -4 | 1255 | 5 |
Table 3.65 Philippines' agronomic indicators by sub-national regions, current season's values, and departure from 5YA, October 2022 - January 2023
| Region | CALF | Maximum VCI | |
| Current(%) | Departure from 5YA(%) | Current | |
| Forest region | 100 | 0 | 0.95 |
| Hilly region | 100 | 0 | 0.93 |
| Lowland region | 100 | 0 | 0.94 |