This chapter starts with a brief overview of the agro-climatic and agronomic conditions in China over the reporting period (section 4.1). Next it describes the situation by region, focusing on the seven most productive agro-ecological regions of the east and south: Northeast China, Inner Mongolia, Huanghuaihai, Loess region, Lower Yangtze, Southwest China, and Southern China (4.2). Section 4.3 describes trade prospects (import/export) of major crops. Additional information on the agroclimatic indicators for agriculturally important Chinese provinces are listed in table A.11 in Annex A.
4.1 Overview
Agro-climatic conditions were quite fair in China from October 2022 to January 2023. Winter wheat sowing was completed in late October. The crop reached the hibernation stage in December. Spring green-up is starting in February. Radiation and temperature had increased by 5% and 0.6°C over the 15YA, respectively. Rainfall was 14% below the 15YA. The lack of rainfall resulted in the below-average potential biomass (-6%). National average of maximum Vegetation Condition Index (VCIx) and Crop Production Index (CPI) is 0.82 and 0.97.
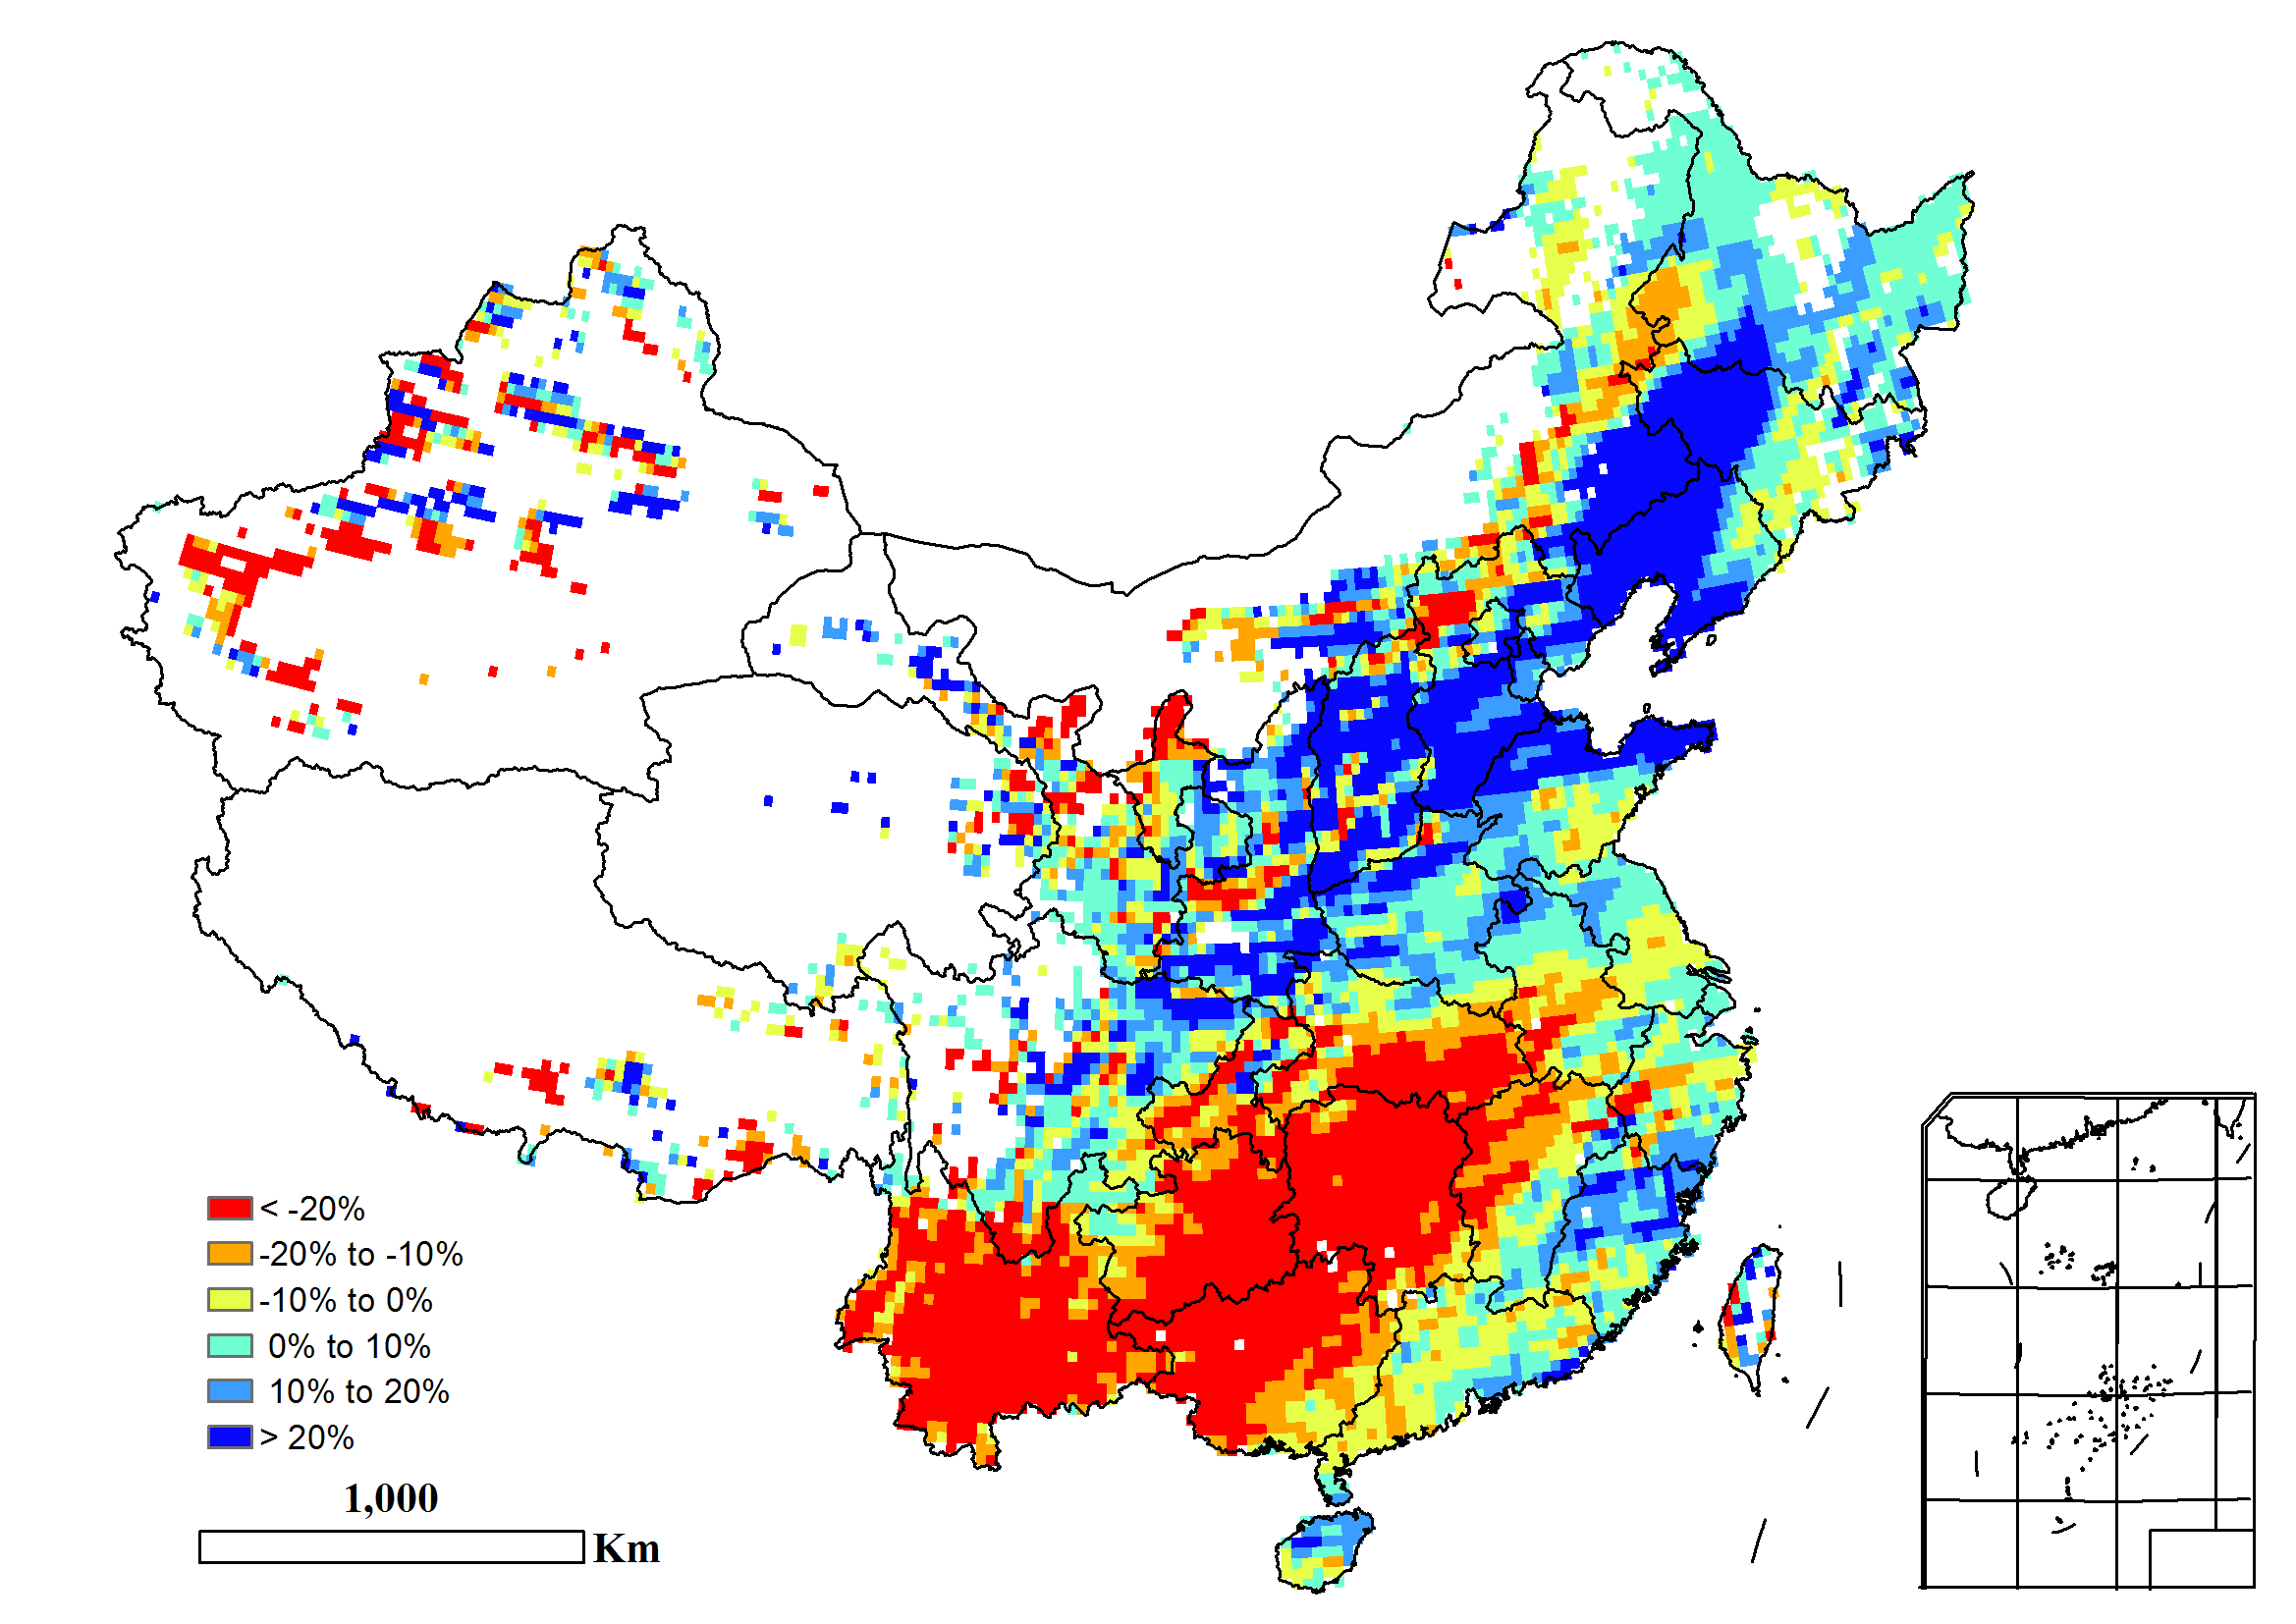
Temperatures in seven of the agroecological zones (AEZs) of China were above average, ranging from 0.1°C (Inner Mongolia) to +1.0°C (Lower Yangtze region). Four of the AEZs received above-average rainfall, the positive rainfall departure ranging from +15% (Inner Mongolia) to +47% (Huang Huaihai), while the remaining three AEZs had below-average precipitation. The potential biomass (BIOMSS) indicator takes rainfall, radiation, and temperature into consideration. In China, rainfall tends to be the most important factor controlling crop growth. Hence, the potential biomass estimates followed the rainfall patterns: Huanghuaihai (+14%), Inner Mongolia (+12%), Loess region (+13%) and Northeast China (+13%) had above-average potential biomass, while the rest of AEZs had below-average potential biomass.
The spatial distribution of the rainfall indicated that 68.3% of the agricultural area (marked in dark green) had near-average rainfall, which was widely distributed across China. Other regions in China went through some fluctuations in rainfall. Excessive rainfall (more than +90 mm/dekad) occurred mainly in early October in southern part of Huang Huaihai and northeastern part of South West China (light green marked regions). Areas marked in blue, located mainly in southeastern part of Lower Yangtze region and eastern part of Southern China, also received largely above-average rainfall (almost +90 mm/dekad) in late November, mainly in some parts of Zhejiang, Fujian, Jiangxi, Hunan, Guangdong, and Guangxi. The temperature profiles indicated that the region marked in dark green, located mainly in the Northeast, had the largest departures from the 15YA, with the biggest positive departure (more than +4.0℃) in middle of November and the biggest negative departure (almost -3.5℃) in early October. However, the summer crops had reached maturity by then and no winter crops are grown in that region.
At the provincial level, only 8 provinces had positive rainfall anomalies, ranging from +10% (Heilongjiang) to +62% (Shaanxi). The negative temperature anomalies were only recorded in Ningxia (-0.1°C). The wet conditions in early October might have caused a delay in winter wheat planting, especially in the Loess and Huang Huaihai regions. Subsequently, conditions were rather favorable and the crops got well established, as can be seen in the above average CALF for Huanghuaihai. Overall, conditions for winter wheat are normal.
Table 4.1. CropWatch agro-climatic and agronomic indicators for China, October 2022 to January 2023, departure from 5YA and 15YA
| Region | RAIN | TEMP | RADPAR | BIOMSS | CALF | Maximum VCI | |||||
| Current(mm) | Departure from 15YA(%) | Current(°C) | Departure from 15YA(°C) | Current(MJ/m2) | Departure from 15YA(%) | Current(gDM/m2) | Departure from 15YA(%) | Current(%) | Departure from 5YA(%) | Current | |
| Huang Huaihai | 127 | 47 | 5.9 | 0.5 | 650 | 0 | 282 | 14 | 81 | 10 | 0.86 |
| Inner Mongolia | 61 | 15 | -6.2 | 0.1 | 578 | -1 | 166 | 12 | 26 | -31 | 0.68 |
| Loess region | 108 | 31 | 1.1 | 0.5 | 678 | -3 | 257 | 13 | 78 | 1 | 0.86 |
| Lower Yangtze rtegion | 243 | -19 | 11.4 | 1.0 | 682 | 7 | 531 | -10 | 89 | -4 | 0.84 |
| North East China | 124 | 28 | -7.3 | 0.3 | 468 | -3 | 216 | 13 | 53 | -11 | 0.73 |
| Southern China | 264 | -24 | 15.1 | 0.6 | 805 | 9 | 561 | -17 | 97 | 0 | 0.91 |
| South-West China | 202 | -26 | 8.4 | 0.7 | 651 | 10 | 451 | -15 | 98 | 0 | 0.89 |
Figure 4.1. China crop calendar
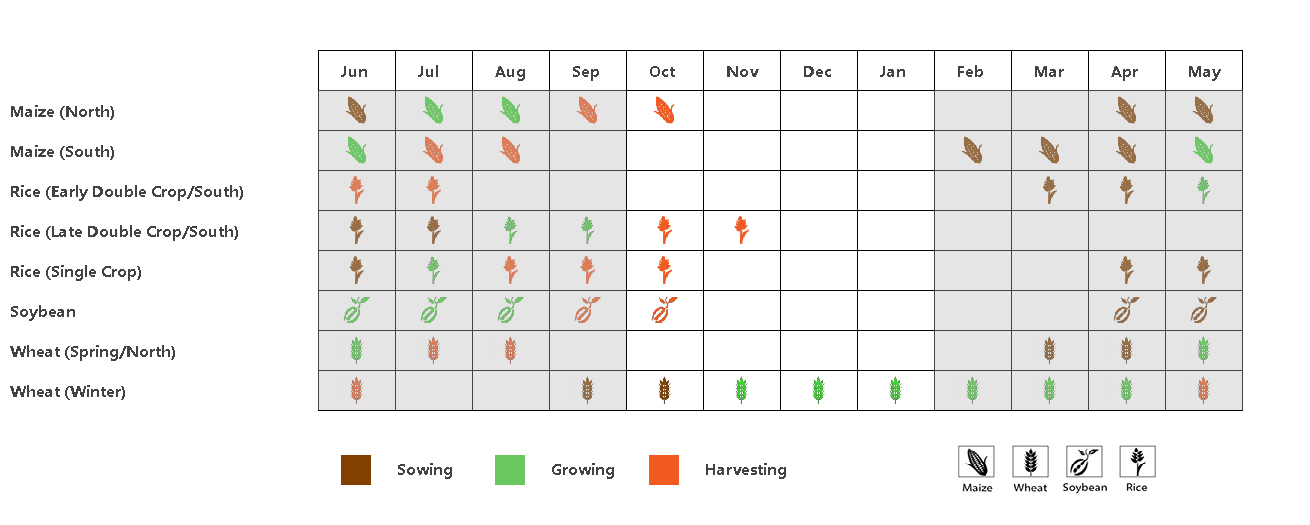
Figure 4.2. China spatial distribution of rainfall profiles, October 2022 to January 2023
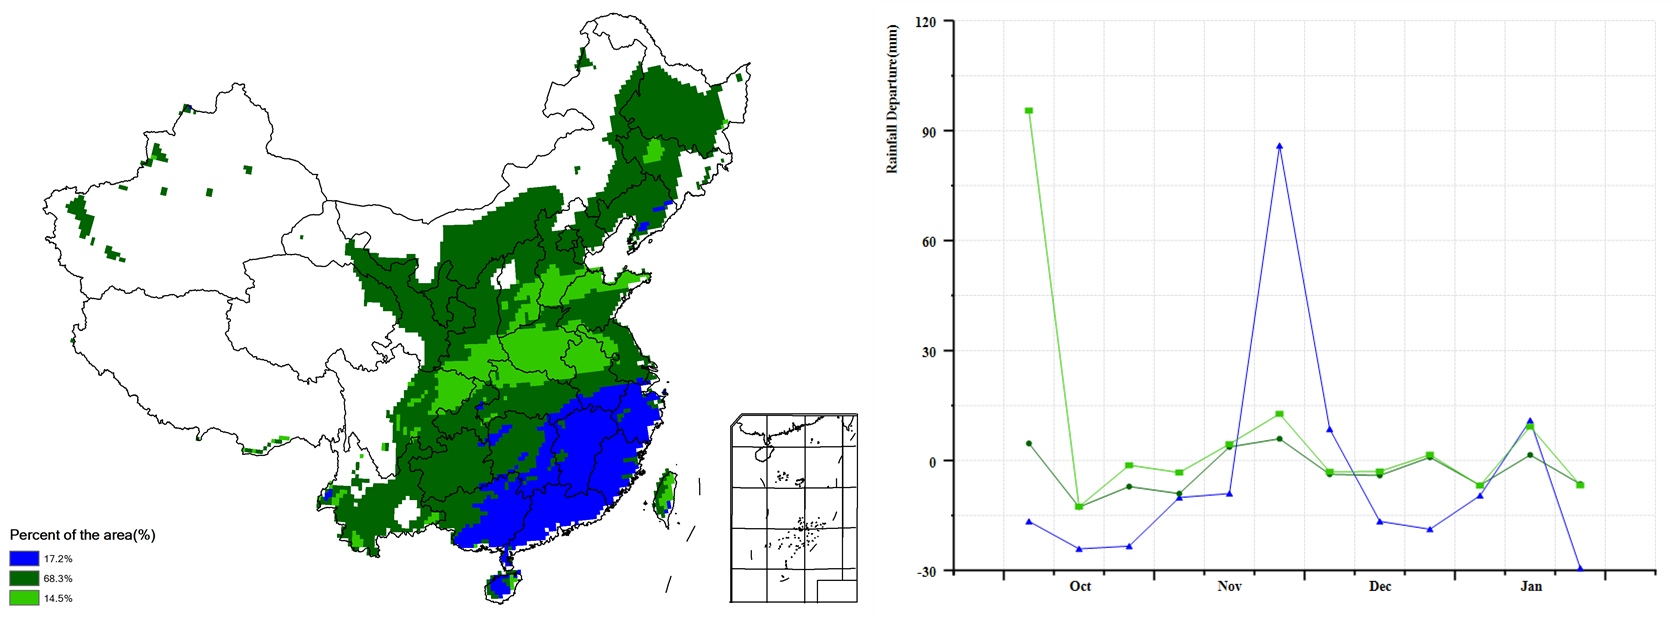
Figure 4.3. China spatial distribution of temperature profiles, October 2022 to January 2023
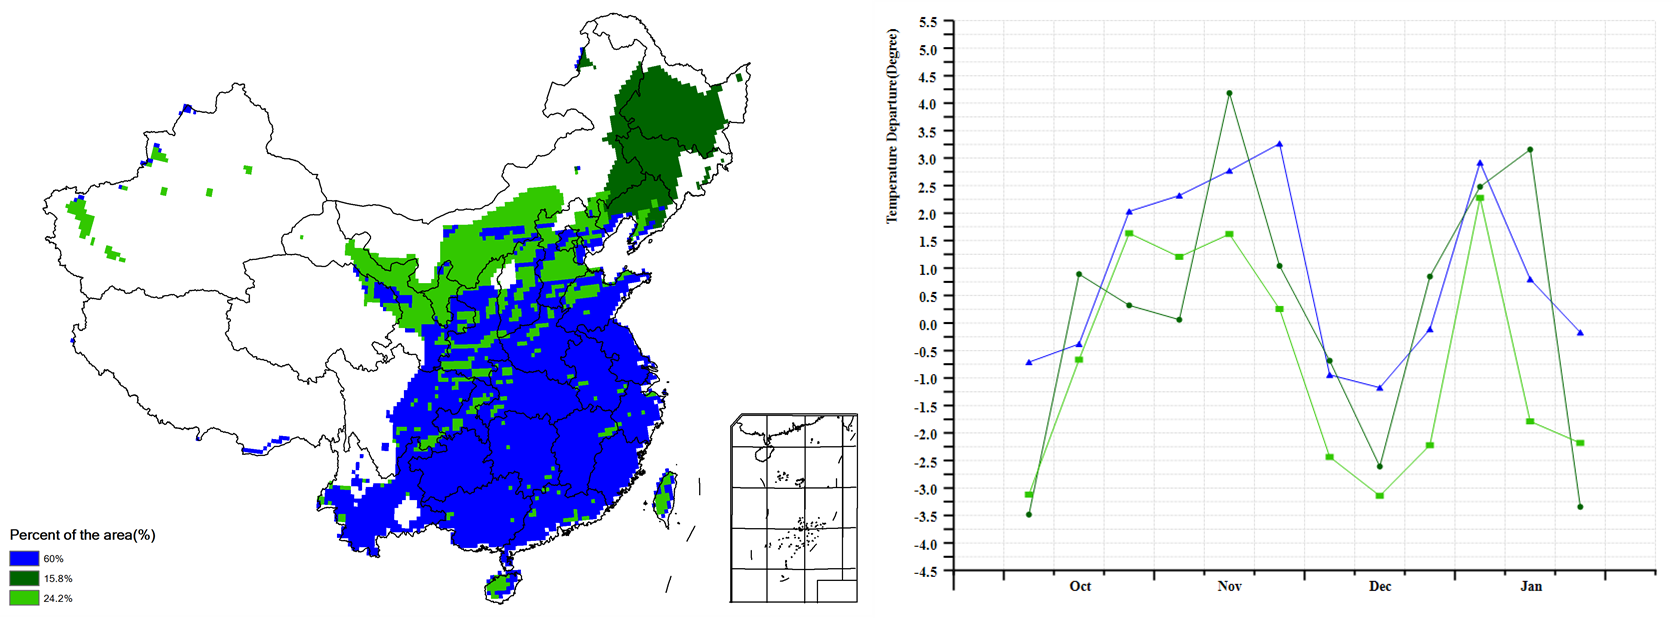
Figure 4.4. Cropped and uncropped arable land over winter crops producing provinces, by pixel, October 2022 to January 2023
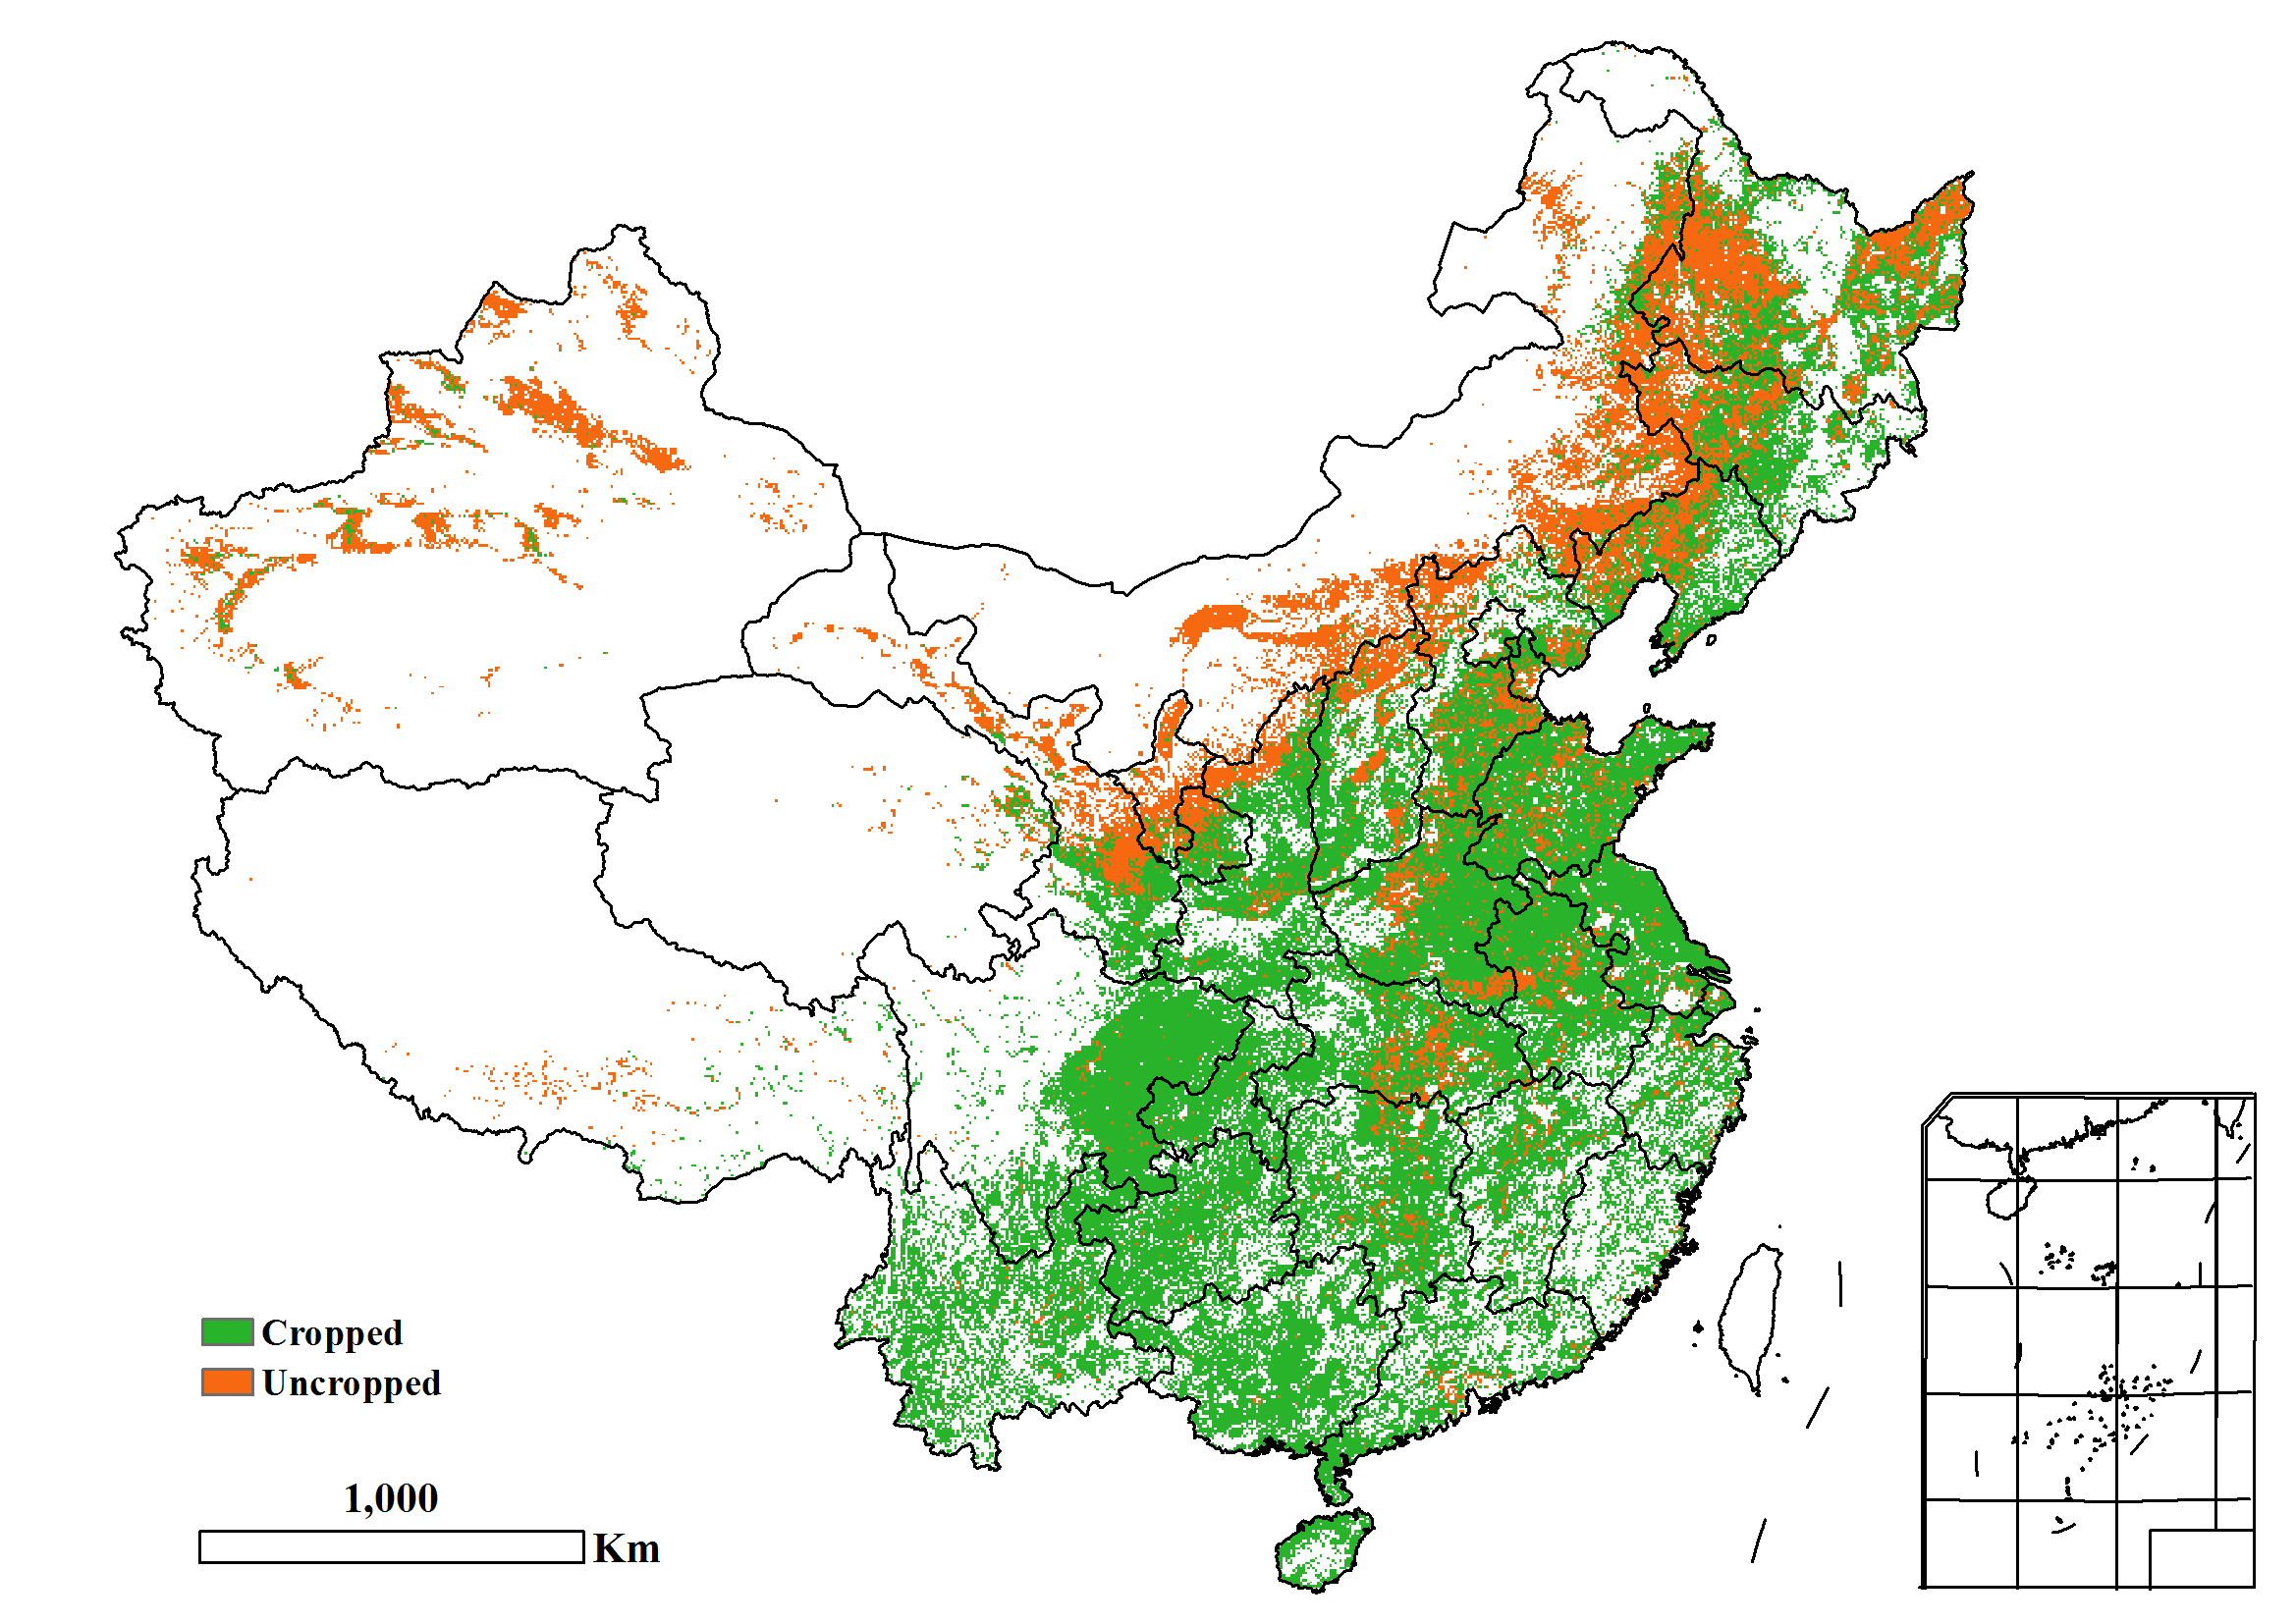
Figure 4.5. China maximum Vegetation Condition Index (VCIx), by pixel, October 2022 to January 2023
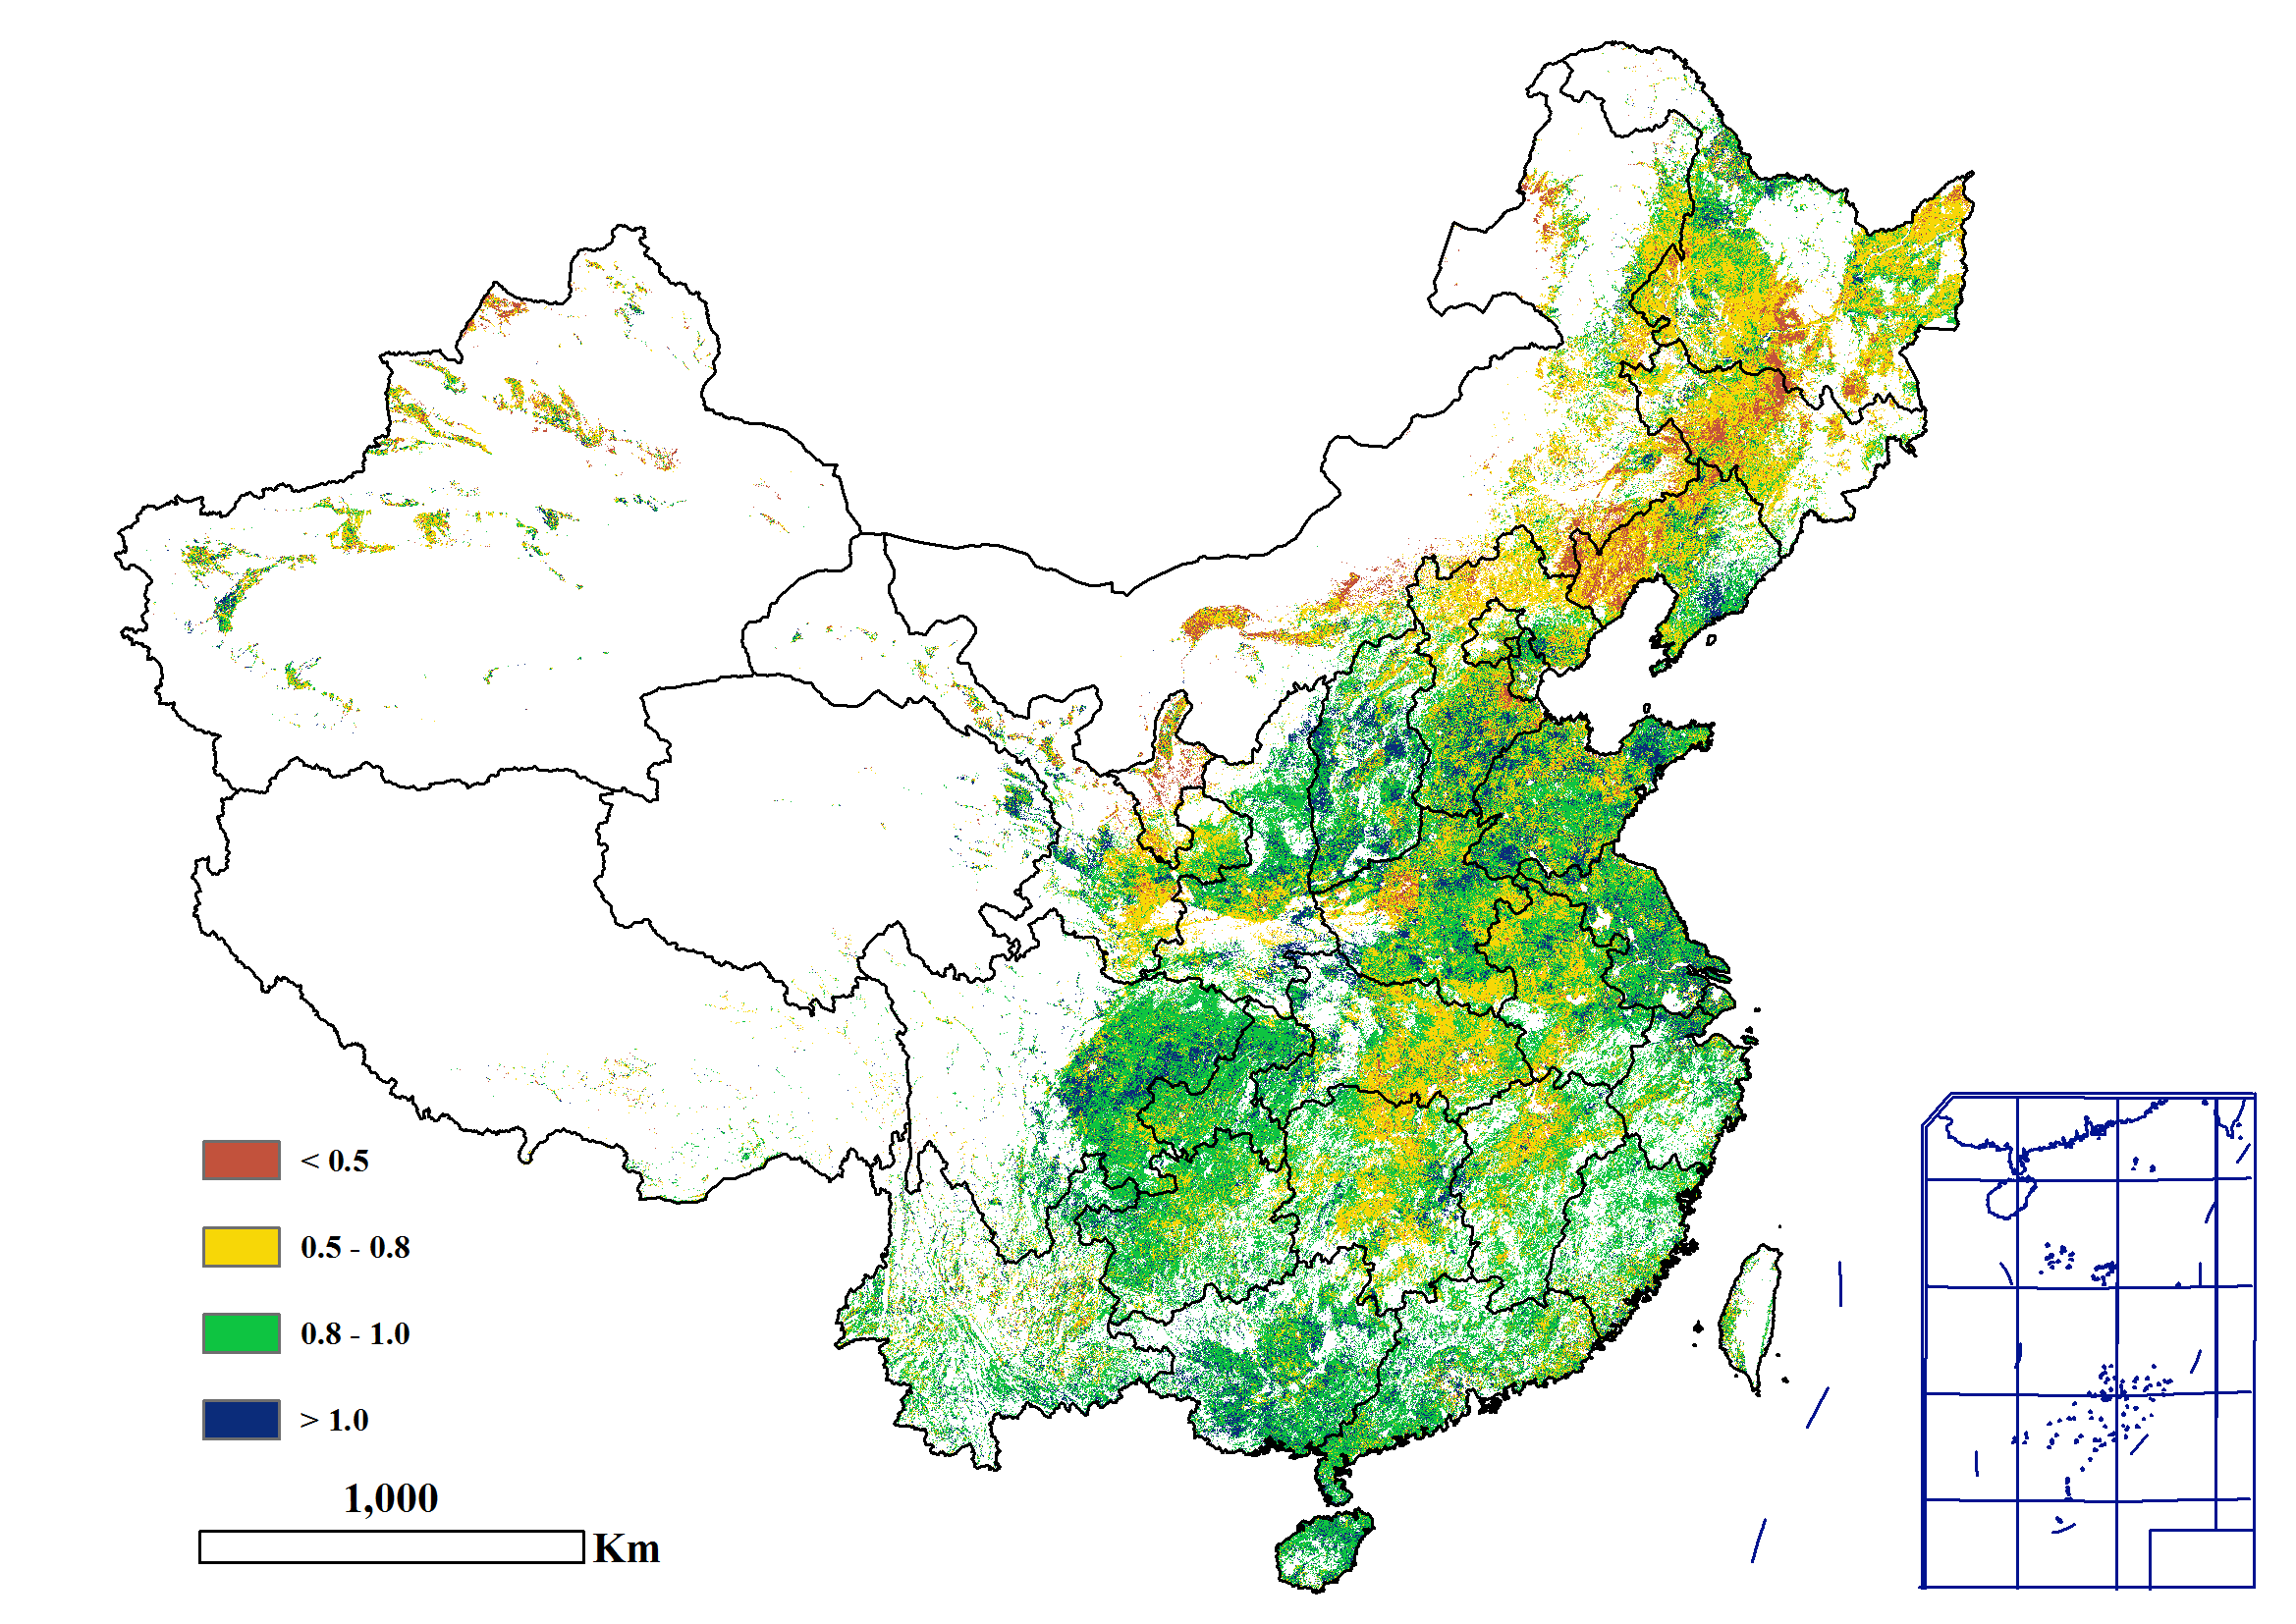
Figure 4.6. China Potential biomass departure from 15YA, by pixel, October 2022 to January 2023