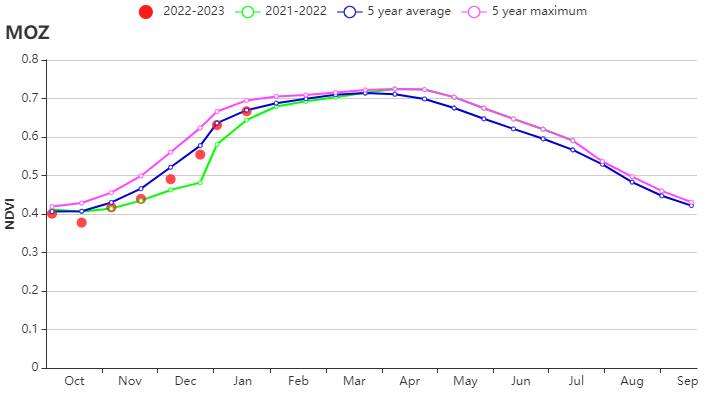
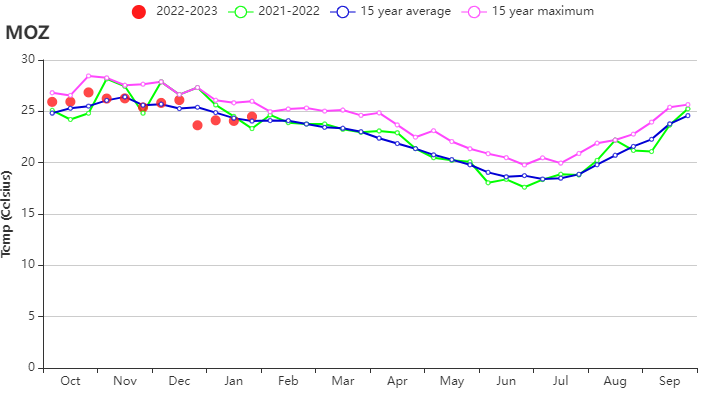
In Mozambique, agriculture is mostly practised under rainfed conditions. Coinciding with the firsth half of the rainy season, this reporting period covers the sowing and vegetative growth stages of maize and rice. The wheat sowing started in January and is expected to last until late February. During this period, agroclimatic indicators reveal a 12% drop in cumulative rainfall compared to the past 15 years average, while both temperature and photosynthetic active radiation were close to average (TEMP 25.4ºC and RADPAR 1123.5 MJ/m2). As a result of the decrease in rainfall, the total biomass production nationwide decreased by 3%. The slight drop in total biomass production is confirmed by crop conditions development based on NDVI, which indicates close to average crop conditions during almost the entire monitoring period. However, they reached average levels at the end of this monitoring period.
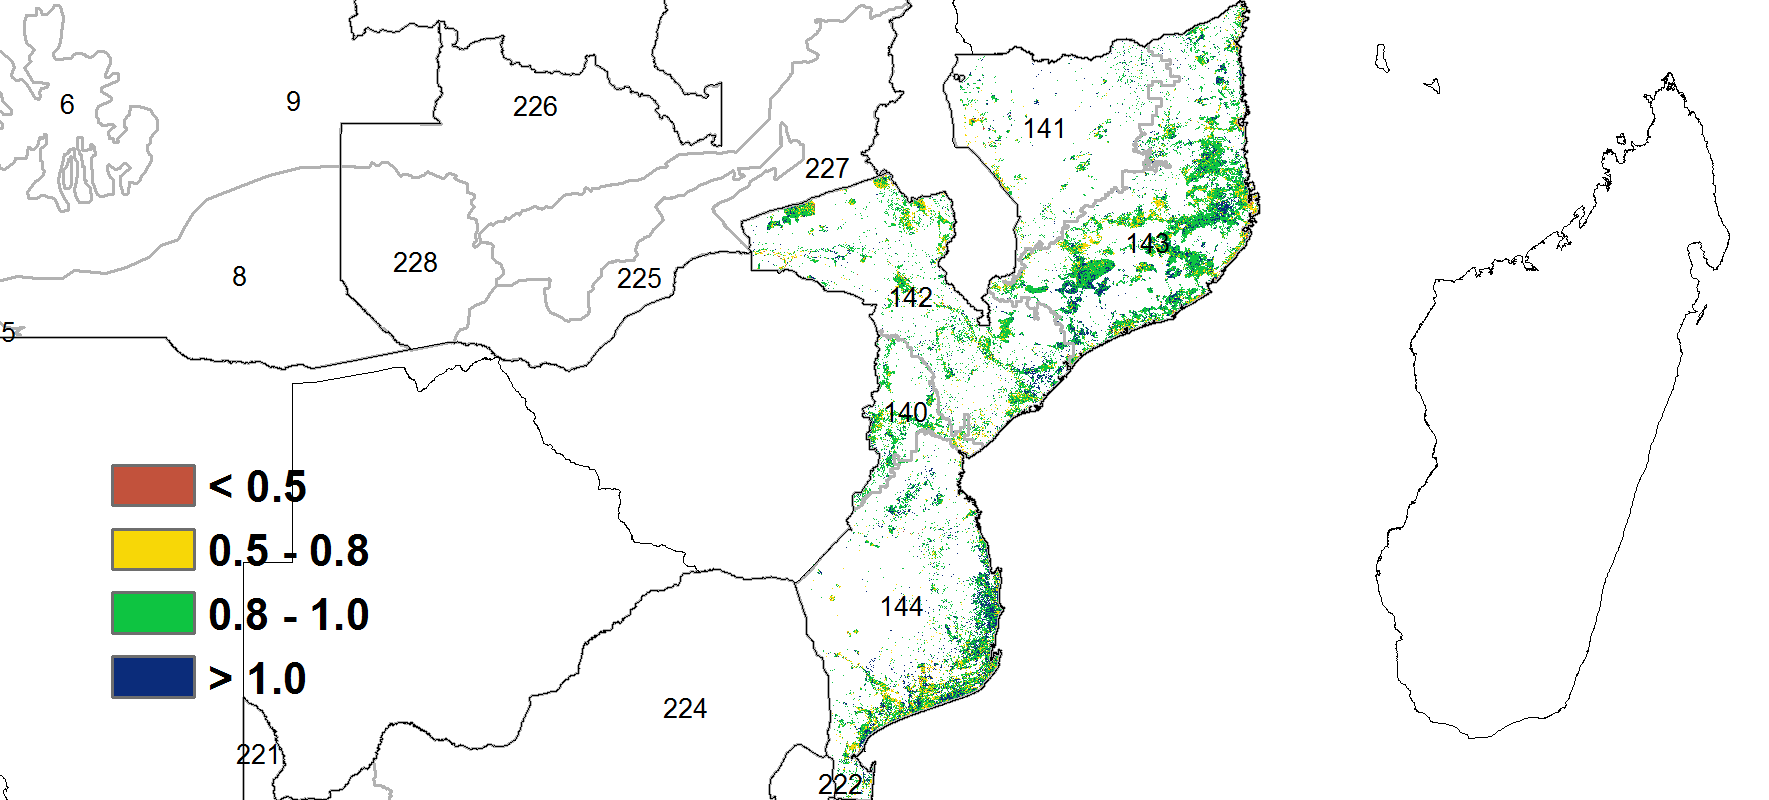
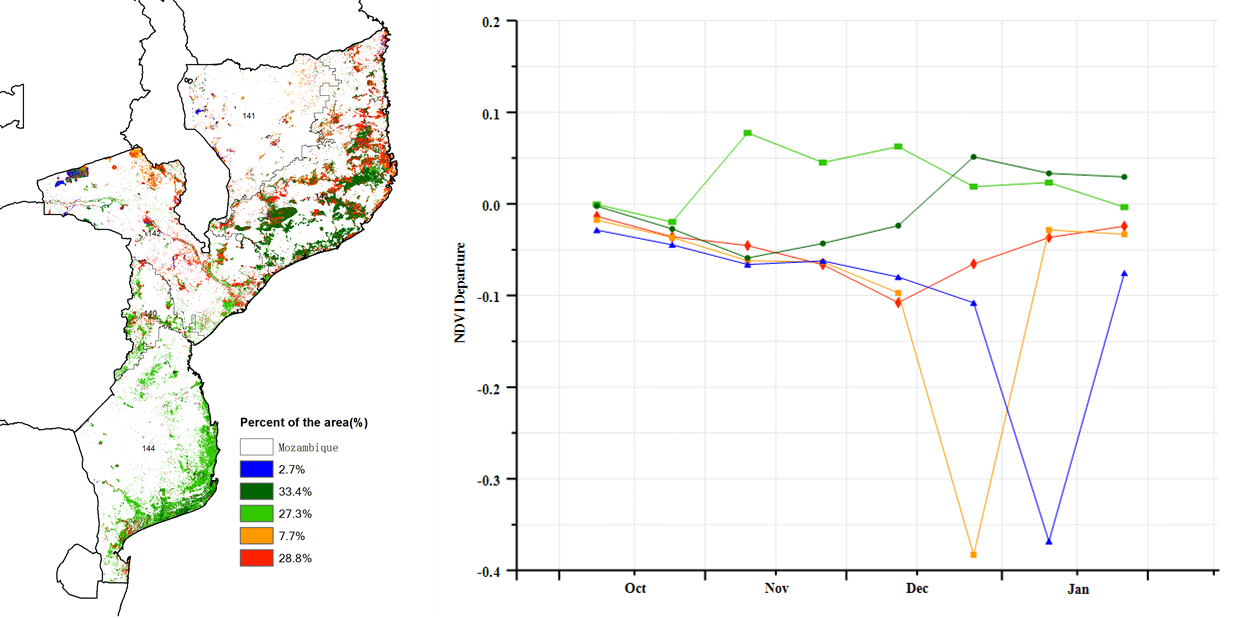
The NDVI spatial patterns show that 39.2% of the total arable land had crop conditions below the average of the past 5 years, with most of these regions located in the provinces of Tete, Nampula, Niassa, and Cabo Delgado. Above-average crop conditions were observed in the central and southern areas of the country (i.e., in the provinces of Gaza, Inhambane, Manica, Sola, and Maputo), representing 27% of the total cropped arable land. Some regions in the provinces of Nampula and Zambezia recorded below-average crop conditions starting from early October until November. They recovered in December, remaining above average during the remaining period. The reported below-average conditions, especially in the northern regions, can be attributed to the delays in rainfall and the low amount of rain recorded in these regions, which led farmers to delay sowing activity until early December and, in some cases, until late December.
Nationwide, the cropped arable land fraction increased by 2%, while the maximum vegetation condition index (VCIx) was 0.90. The crop production index (CPI) was 1.1. The conditions for crop production can be assessed as normal.
Regional analysis
Based on the national cropping system, topography and climate, CropWatch has subdivided Mozambique into five agroecological zones (AEZs) including the Buzi basin (140), Northern High-altitude areas (141), Low Zambezi River basin (142), Northern coast (143), and the Southern region (144).
At the regional level, agroclimatic indicators revealed drops in rainfall in the Buzi basin (26%), Southern region (20%), Low Zambezia river basin (15%), Northern high-altitude area (11%), and Northern coast (1%). The temperature decreased in the Northern high-altitude areas (-1ºC) and Northern coast (-0.3ºC) and increased in the Southern region (+0.7ºC), Buzi basin (+0.6ºC), and Low Zambezia river basin (+0.1ºC). With the RADPAR increasing in all the agroecological regions, the total biomass production at the regional level recorded variations, with increases verified in the Buzi basin (+1%) and decreases recorded in the Northern high-altitude area (-8%), Northern coast, and Low Zambezia river basin (-3%). BIOMSS in the southern region was about average.
The regional crop development graphs based on NDVI indicated favourable crop conditions during the entire monitoring period in the Buzi basin and southern regions. In the Northern high-altitude areas and Low Zambezia river basin, crop conditions were below the past 5-year average. On the Northern coast, the crop conditions recovered from late December until the end of the monitoring period. Except for the Buzi basin and the Low Zambezia river basin, the CALF increased in the remaining agroecological zones, by 3% on the Northern coast, 2% in the southern region, and 1% in the Northern high-altitude areas. The maximum VCIx varied from 0.89 to 0.92, and the CPI was between 1.02 and 1.13.
Figure 3.32. Mozambique's crop condition, July-October 2022

(a) Phenology of major crops


(b) Crop condition development graph based on NDVI (c) Maximum VCI

(d) Spatial NDVI patterns compared to 5YA (e) NDVI profiles


(f) National time-series rainfall profiles (g) National time-series temperature profiles


(h) Crop condition development graph based on NDVI-Buzi basin (left), and Northern high-altitude areas (right)


(i) Crop condition development graph based on NDVI-Lower Zambezi River basin (left), and Northern coast region (right)

(j) Crop condition development graph based on NDVI-Southern region
Table 3.55. Mozambique’s agroclimatic indicators by sub-national regions, current season's values and departure from 15YA, October 2022 - January 2023
Region | RAIN | TEMP | RADPAR | BIOMSS | ||||
Current (mm) | Departure from 15YA (%) | Current (°C) | Departure from 15YA (°C) | Current (MJ/m2) | Departure from 15YA (%) | Current (gDM/m2) | Departure from 15YA (%) | |
Buzi basin | 560 | -26 | 23.9 | 0.6 | 1436 | 4 | 1206 | 1 |
Northern high-altitude areas | 691 | -11 | 24.1 | -0.1 | 1345 | 4 | 1101 | -8 |
Low Zambezia River basin | 605 | -15 | 25.8 | 0.1 | 1362 | 1 | 1146 | -3 |
Northern coast | 618 | -1 | 25.6 | -0.3 | 1361 | 3 | 1129 | -4 |
Southern region | 389 | -20 | 26.1 | 0.7 | 1390 | 5 | 1098 | 0 |
Table 3.56. Mozambique's agronomic indicators by sub-national regions, current season’s values and departure from 5YA, October 2022 - January 2023
Region | CALF | Maximum VCI | |
Current (%) | Departure from 5YA (%) | Current | |
Buzi basin | 100 | 0 | 0.90 |
Northern high-altitude areas | 99 | 1 | 0.89 |
Low Zambezia River basin | 99 | 0 | 0.89 |
Northern coast | 99 | 3 | 0.91 |
Southern region | 98 | 2 | 0.92 |
Table 3.56. Mozambique's crop production index, October 2022 - January 2023
Region | CPI |
Buzi basin | 1.02 |
Northern high-altitude areas | 1.13 |
Low Zambezia River basin | 1.02 |
Northern coast | 1.12 |
Southern region | 1.13 |
