Spring barley, winter wheat and maize are major grain crops in Ukraine. During this monitoring period, maize was harvested in October and November. Winter wheat sowing was completed in October.
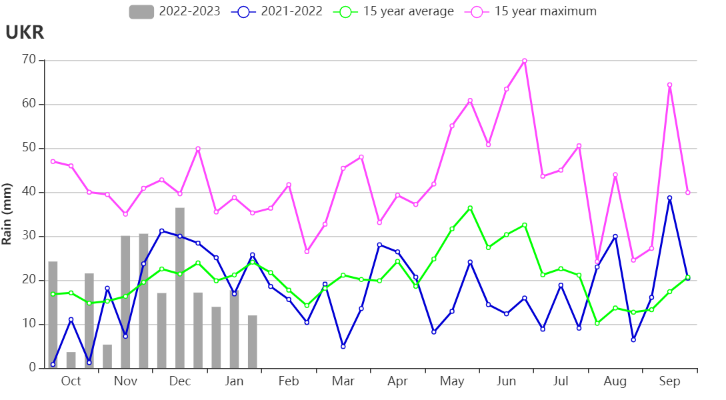
Ukraine experienced slightly milder temperatures than usual. The average temperature reached 3.6°C, which was 1.4°C above 15 YA. The rainfall was average (RAIN 229 mm, -1%) while the solar radiation (RADPAR, 252 MJ/m2) decreased by 7%. As a result of these favorable conditions, the potential biomass was estimated to increase by 7% above the 15YA (BIOMSS, 444 gDM/m2).
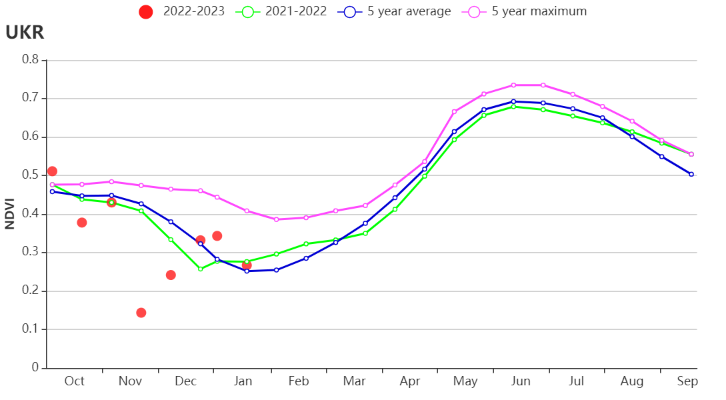
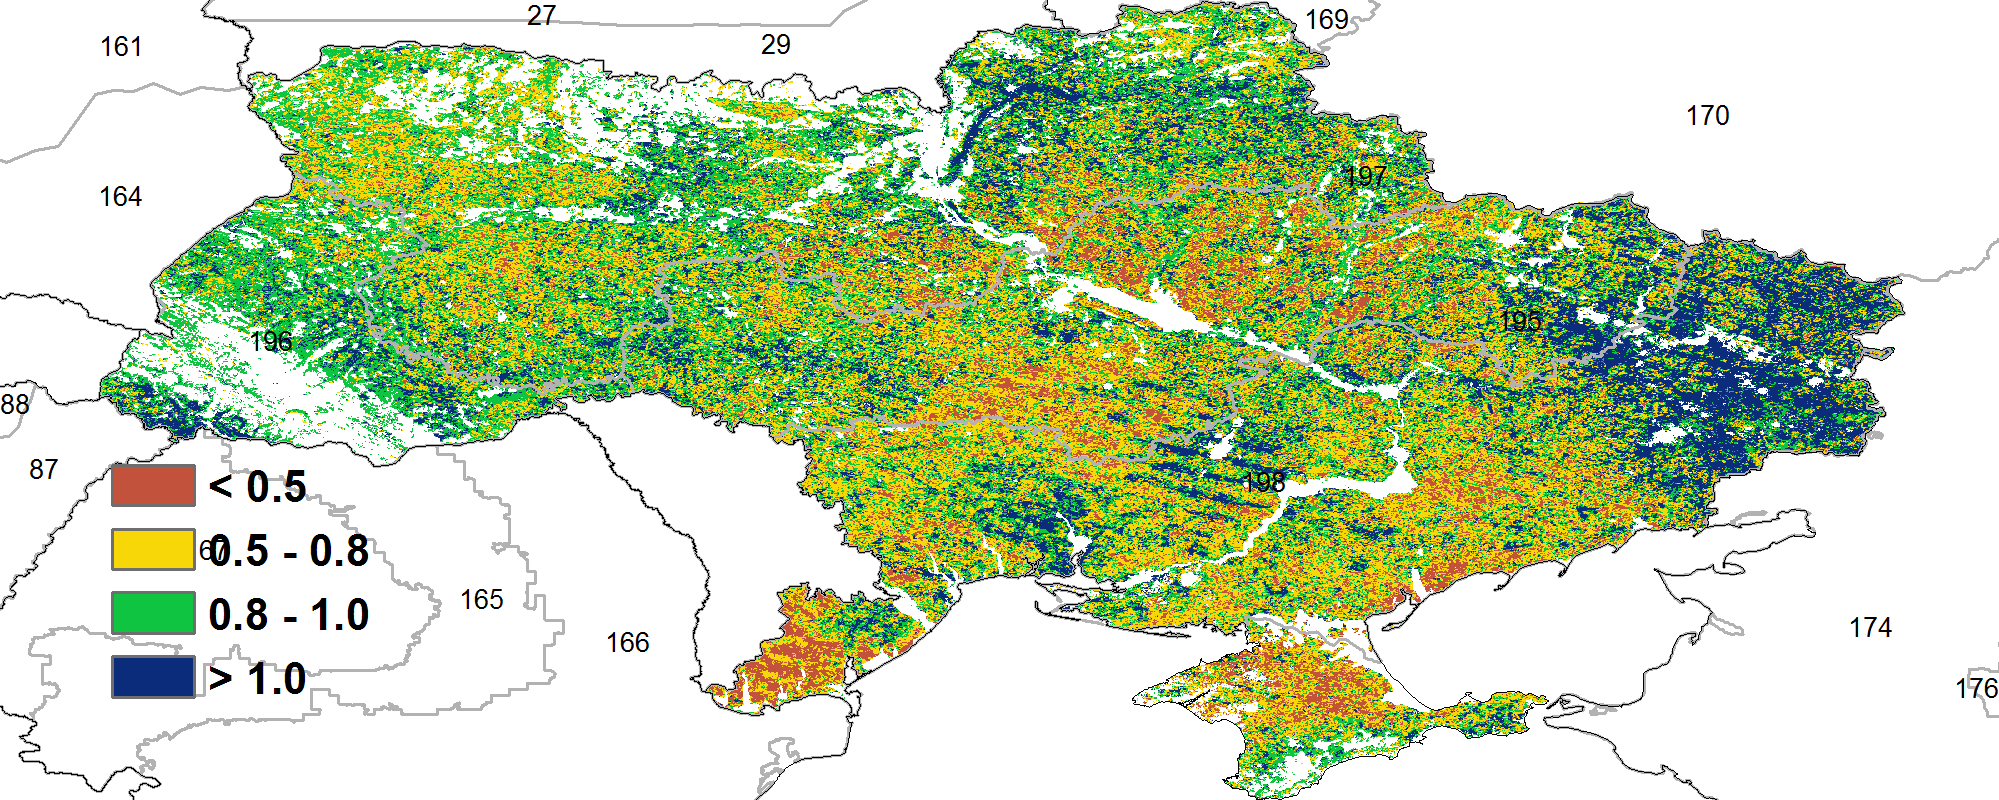
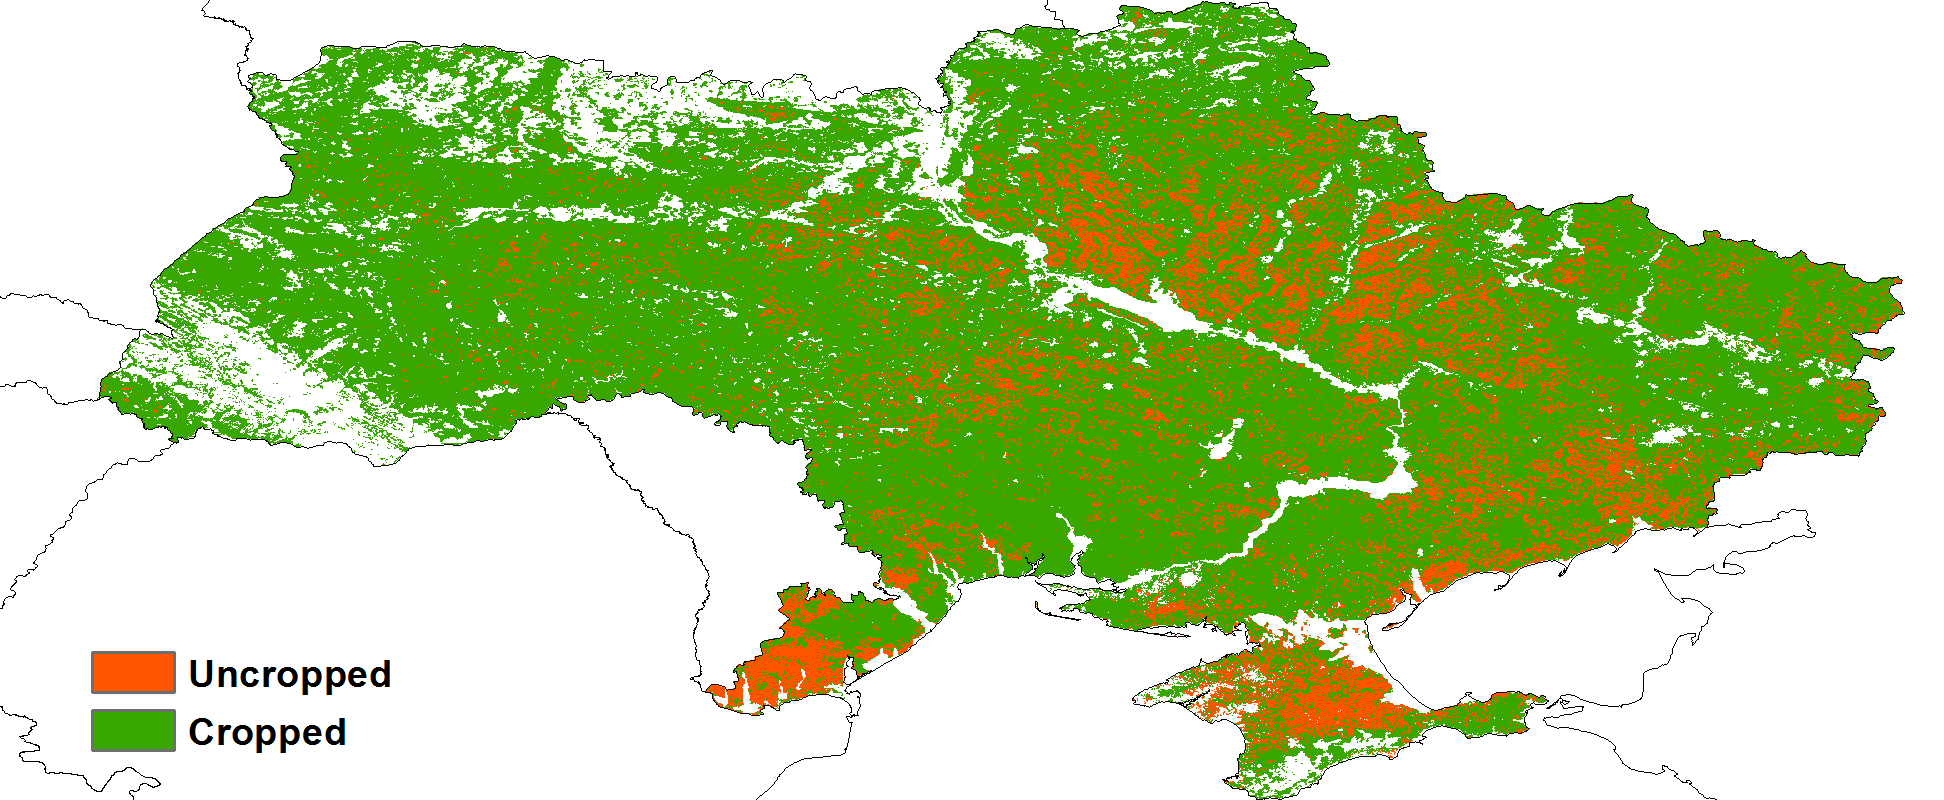
Despite of the ongoing war, the agronomic indicators suggested that crop growth was generally favorable during this monitoring period. 84% of the arable land (CALF) is cropped, which is 13% higher than the 5 YA. The maximum vegetation condition index (VCIx) also reached a fair value of 0.83. The remote sensing-based crop development graph showed average crop conditions throughout this period except for sudden drops in November, which may be attributed to snow or cloud cover in the satellite images. The NDVI spatial distribution map showed that, although there were some fluctuations in November, NDVI of about 78% of the cropped area reached the 5YA level by the end of this monitoring period. The remaining 22% are concentrated in the northwest, where snow on the ground may have caused low NDVI readings. As shown by the VCIx map, crop conditions were poorer in the southern Ukraine. VCIx was below 0.5 in the war-torn Kherson, Odessa and Zaporizhia oblasts. VCIx was poor in Crimea as well. The best crop condition area was the Russian-occupied area in eastern Ukraine, such as Dunbas. In general, the conditions for winter wheat have been favorable so far. Crop production index (CPI) at both national and agro-ecological zones attained the value above 1, which confirmed the favorable conditions.
Regional analysis
Regional analyses are provided for four agro-ecological zones (AEZ) defined by their cropping systems, climatic zones and topographic conditions. They are referred to as Central wheat area (195) with the Poltava, Cherkasy, Dnipropetrovsk and Kirovohrad Oblasts; Eastern Carpathian hills (196) with Lviv, Zakarpattia and Ivano-Frankivsk Oblasts; Northern wheat area (197) with Rivne and Southern wheat and maize area (198) with Mykolaiv, Kherson and Zaporizhia Oblasts.
The AEZs of central wheat area, northern wheat area and southern wheat and maize area shared similar patterns of agroclimatic and agronomic indicators. All these AEZs experienced a warmer winter, with positive temperature departures ranging from +1.2 to +1.9°C, with normal rainfall (rainfall departures ranging from -1 to 2%) and less sunshine (radiation departures ranging from -7 to -11%), resulting in a 6 to 9% higher biomass production potential. These areas also attained a relatively high CALF (0.79 to 0.91) and VCIx (0.79 to 0.85), NDVI based development curves recovered to close to or above average levels by the end of January. All in all, crop prospects are favorable.
Eastern Carpathian hills received 11% less rainfall. But temperatures were higher and radiation was normal. Weather based projected biomass was 8% higher than the 15YA. Agronomic indicators showed very good CALF(0.99) and VCIx(0.9). The NDVI curve also reached above average levels. All in all, conditions are favorable in this region.
Figure 3.43 Ukraine's crop condition, October 2022 – January 2023

(a) Phenology of major crops
(b) Crop condition development graph based on NDVI
(c) Maximum VCI

(d) Spatial NDVI patterns compared to 5YA (e) NDVI profiles
(f) Cropped and uncropped arable land
(g) Time series rainfall profile
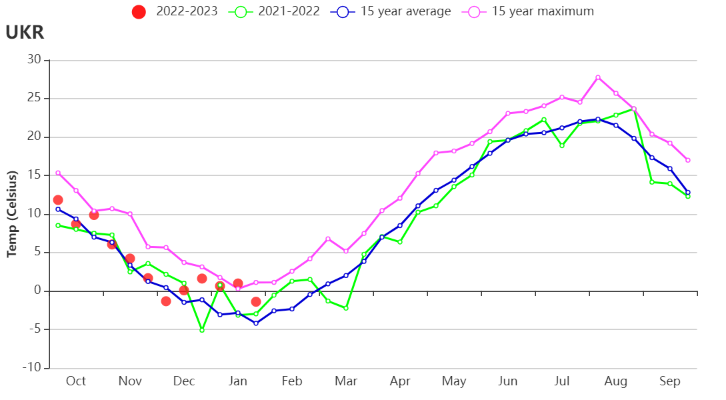
(h) Time series temperature profile
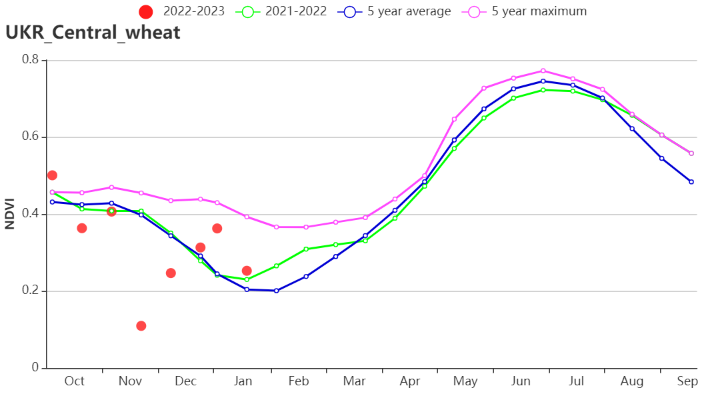
(i) Crop condition development graph based on NDVI (Central wheat area)
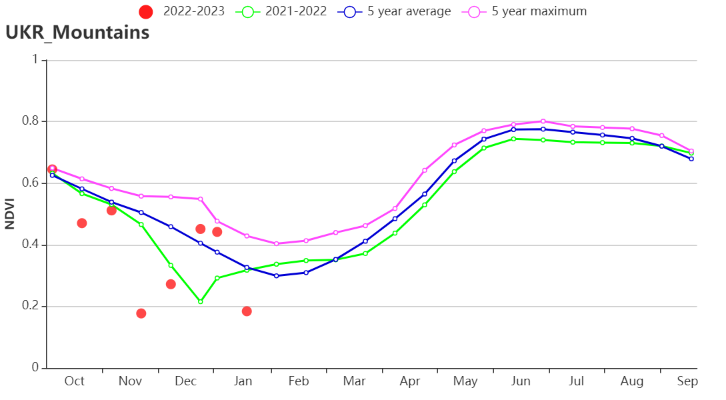
(j) Crop condition development graph based on NDVI (Eastern Carpathian hills)
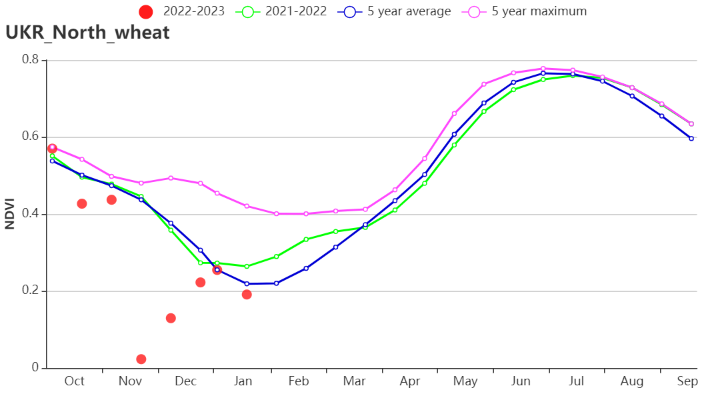
(k) Crop condition development graph based on NDVI (Northern wheat area)
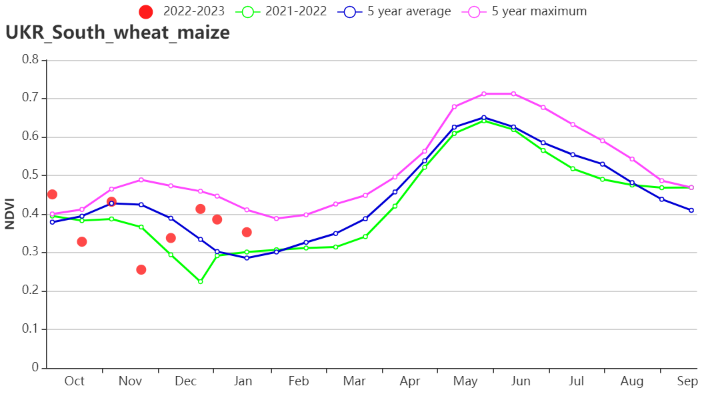
(l) Crop condition development graph based on NDVI (Southern wheat and maize area)
Table 3.78 Ukraine agro-climatic indicators by sub‐national regions, current season's values and departure from 15YA, October 2022 – January 2023
| RAIN | TEMP | RADPAR | BIOMSS | |||||
| Region | Current (mm) | Departure from 15YA (%) | Current (°C) | Departure from 15YA (°C) | Current (MJ/m2) | Departure from 15YA (%) | Current (gDM/m2) | Departure from 15YA (%) |
| Central wheat area | 229 | 2 | 2.8 | 1.2 | 236 | -11 | 437 | 8 |
| Eastern Carpathian hills | 226 | -11 | 3.7 | 1.9 | 288 | -1 | 443 | 8 |
| Northern wheat area | 242 | -1 | 2.7 | 1.2 | 204 | -10 | 436 | 9 |
| Southern wheat and maize area | 217 | 1 | 4.6 | 1.7 | 288 | -7 | 457 | 6 |
Table 3.79 Ukraine agronomic indicators by sub‐national regions, current season's values and departure from 5YA, October 2022 – January 2023
| CALF | Maximum VCI | ||
| Region | Current | Departure from 5YA (%) | Current |
| Central wheat area | 79 | 14 | 0.79 |
| Eastern Carpathian hills | 99 | 1 | 0.90 |
| Northern wheat area | 91 | 3 | 0.84 |
| Southern wheat and maize area | 81 | 29 | 0.85 |
