The sowing of winter wheat in Kyrgyzstan was completed in October. During the months of October to January, the CropWatch agro-climatic indicator RAIN (+12%) was slightly above average, RADPAR was average, and TEMP was below average (-1.5℃). The combination of these factors resulted in a decreased estimate for BIOMSS (-2%) compared to the fifteen-year average. As shown by the NDVI development graph, the vegetation conditions were below average throughout the whole monitoring period, which might have been due to the freezing temperatures and snow cover, which started in November. In terms of the spatial NDVI clustering profile, 26.2% of the cultivated area (marked in orange) had near-average crop conditions. Other clustered regions experienced some fluctuations in crop conditions. 25.3% of the cultivated area (marked in dark green), mainly dispersedly distributed in Naryn, Jalal-Abad and Osh, showed great negative NDVI departures, presumably due to cloud cover and snow on the ground. The same conditions prevailed in the light green, blue and red marked regions in late November and early December, causing a negative NDVI departure by 0.2 units. The spatial pattern of maximum Vegetation Condition Index (VCIx) was in accord with the spatial distribution of the NDVI profiles. The national average VCIx was 0.71. Agro-climatic and agronomic conditions were mixed with CALF at 9%, 38% below average, indicating less land was cultivated. The national Crop Production Index was 0.68, indicating an unpromising crop production outlook. The great negative temperature in early January might have caused damage to winter wheat in some areas. Overall, the crop conditions in Kyrgyzstan can be assessed as close-to-average thanks to above-average precipitation.
Figure 3.25 Kyrgyzstan's crop condition, October 2022 to January 2023
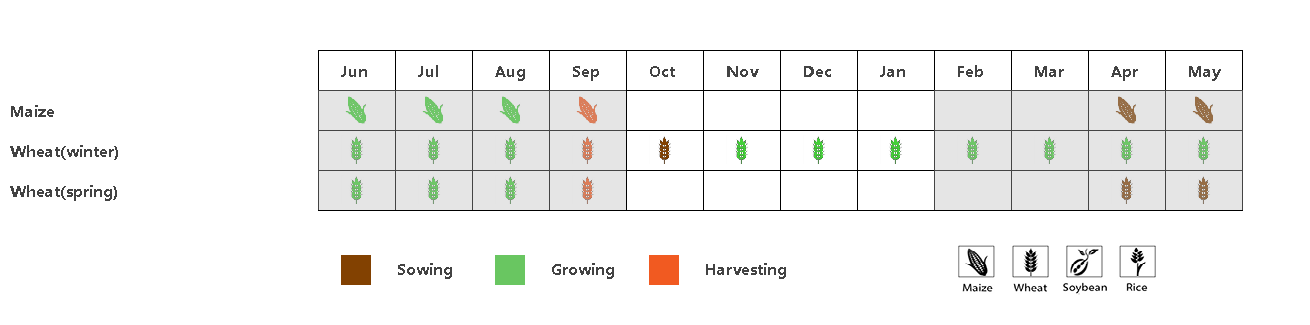
(a) Crop phenology
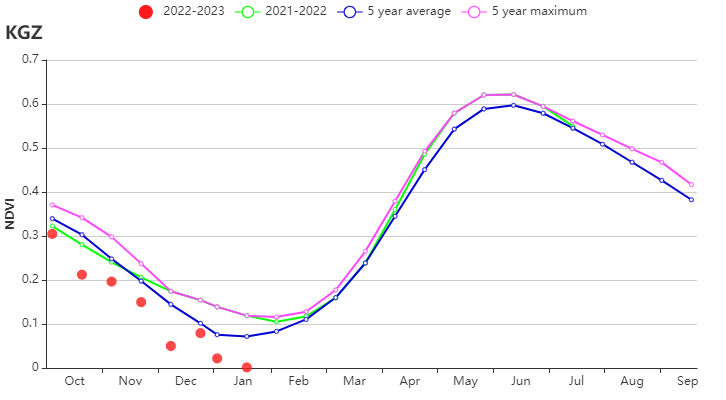
(b) Crop condition development graph based on NDVI
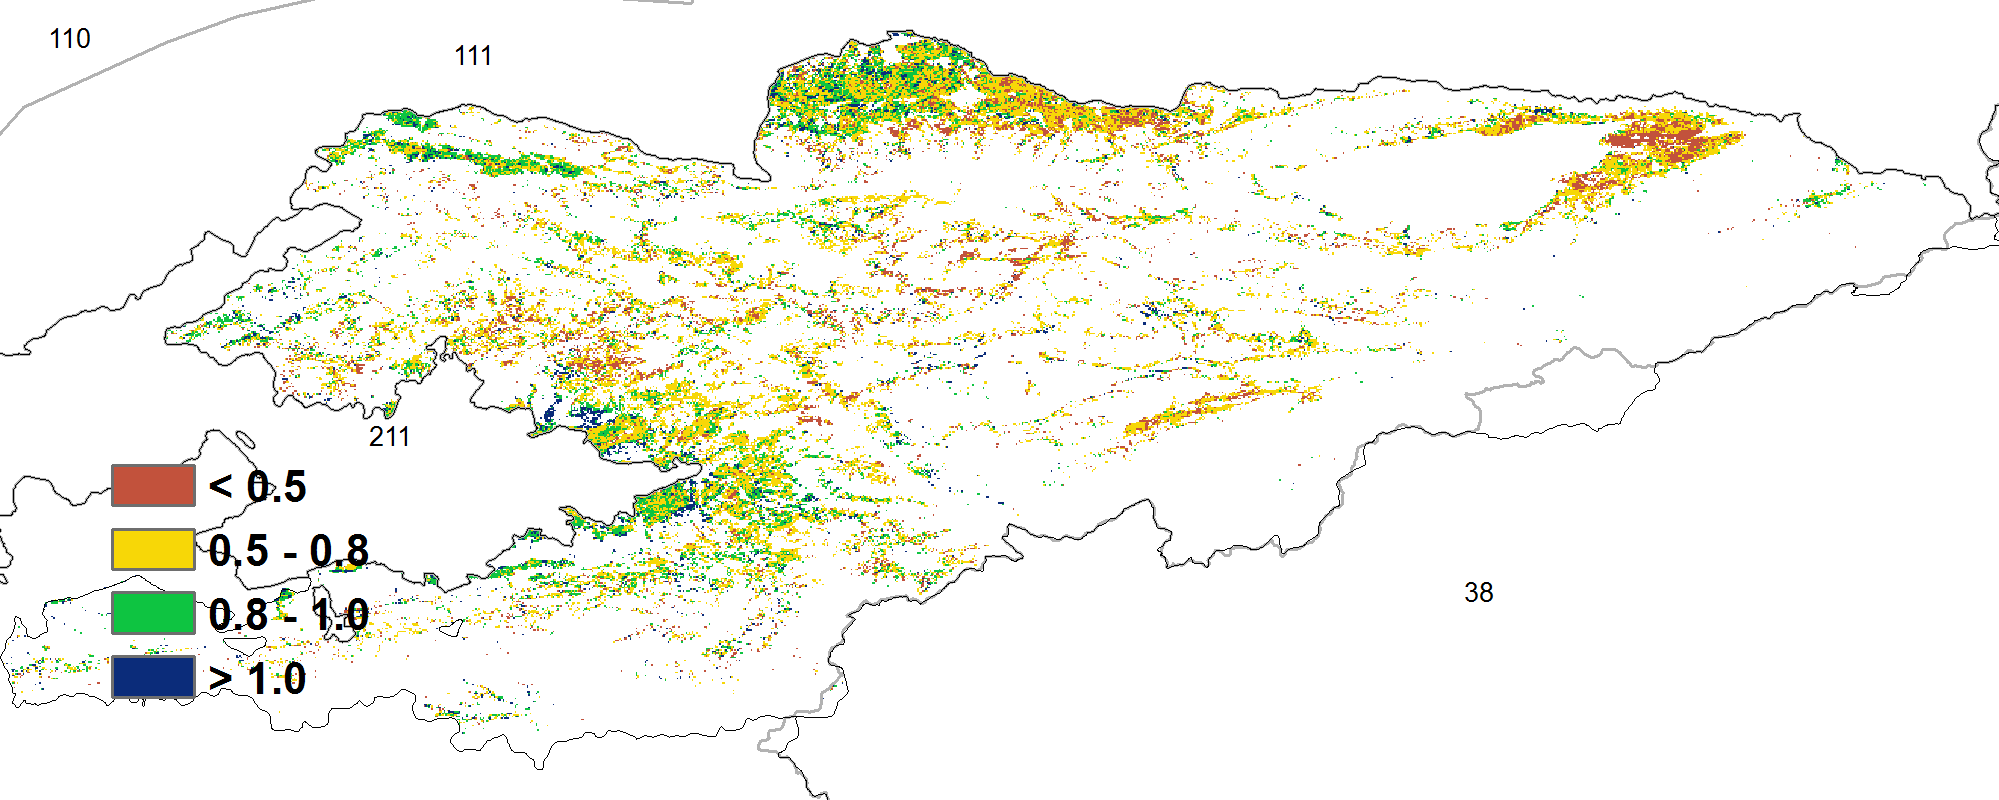
(c) Maximum VCI
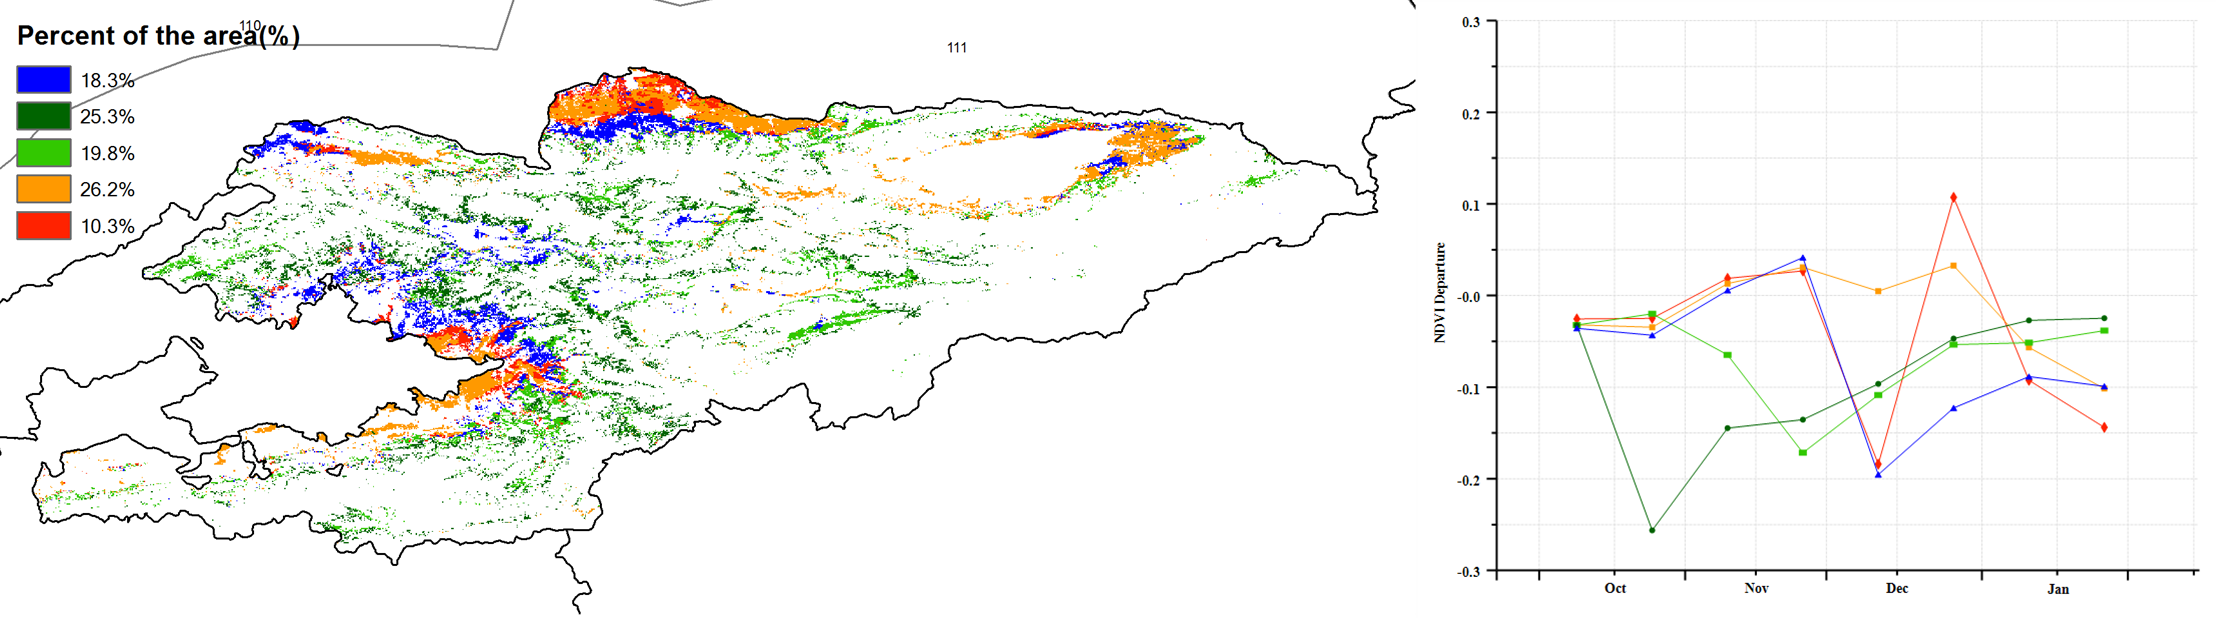
(d) Spatial NDVI patterns compared to 5YA (e) NDVI profiles
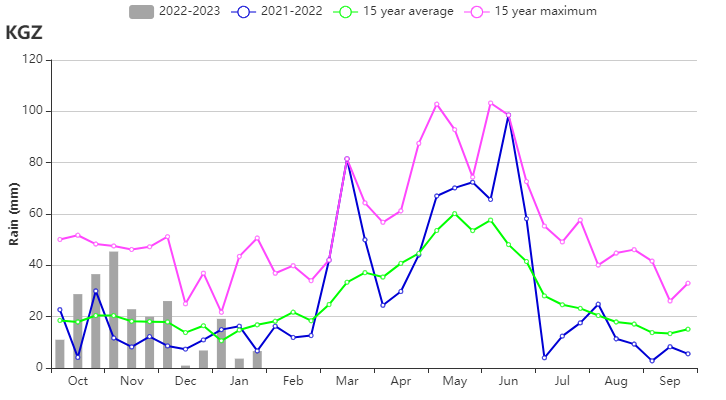
(f) Time series rainfall profile
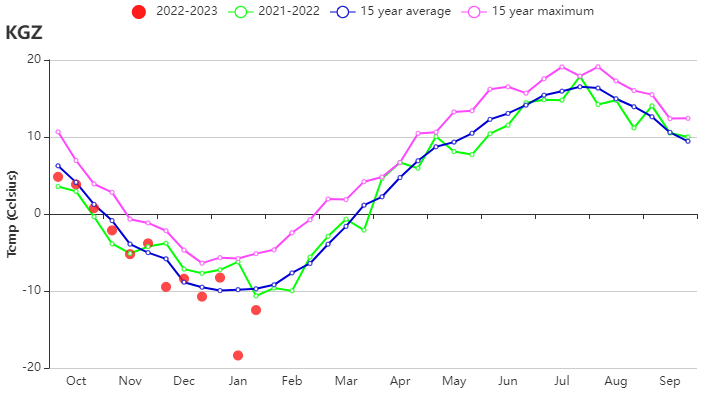
(g) Time series temperature profile
Table x. Kyrgyzstan agro-climatic indicators, current season's values and departure from 15YA, October 2022 to January 2023
| Region | RAIN | TEMP | RADPAR | BIOMSS | ||||
| Current(mm) | Departure from 15YA(%) | Current(°C) | Departure from 15YA(°C) | Current(MJ/m2) | Departure from 15YA(%) | Current(gDM/m2) | Departure from 15YA(%) | |
| Kyrgyzstan | 228 | 12 | -5.8 | -1.5 | 596 | 0 | 227 | -2 |
Table x. Kyrgyzstan agronomic indicators, current season's values and departure from 5YA, October 2022 to January 2023
| Region | CALF | Maximum VCI | |
| Current(%) | Departure from 5YA(%) | Current | |
| Kyrgyzstan | 9 | -38 | 0.71 |