During this monitoring period, the harvest of summer crops was completed in Canada. Sowing of winter wheat was completed in October. It reached the hibernation stage in December.
There were few crops in the field except for some winter crops, such as winter wheat and canola. Compared to the 15-year average, below average rainfall (RAIN: -6%), above average radiation (RADPAR +2%) and temperature (TEMP +1.2°C) were captured by CropWatch agroclimatic indicators, which resulted in an increase in potential biomass (BIOMSS +11%). Winter wheat is mainly grown in Ontario and Quebec. Some winter wheat is grown in the Saskatchewan, Alberta, and Manitoba provinces as well. According to the rainfall profile, rainfall was near average most of the time. The crop production index (CPI) was 0.92. Conditions for winter wheat were average according to the NDVI development graph, but winter crop yields will depend largely on agroclimatic conditions in the next monitoring period.
Regional analysis
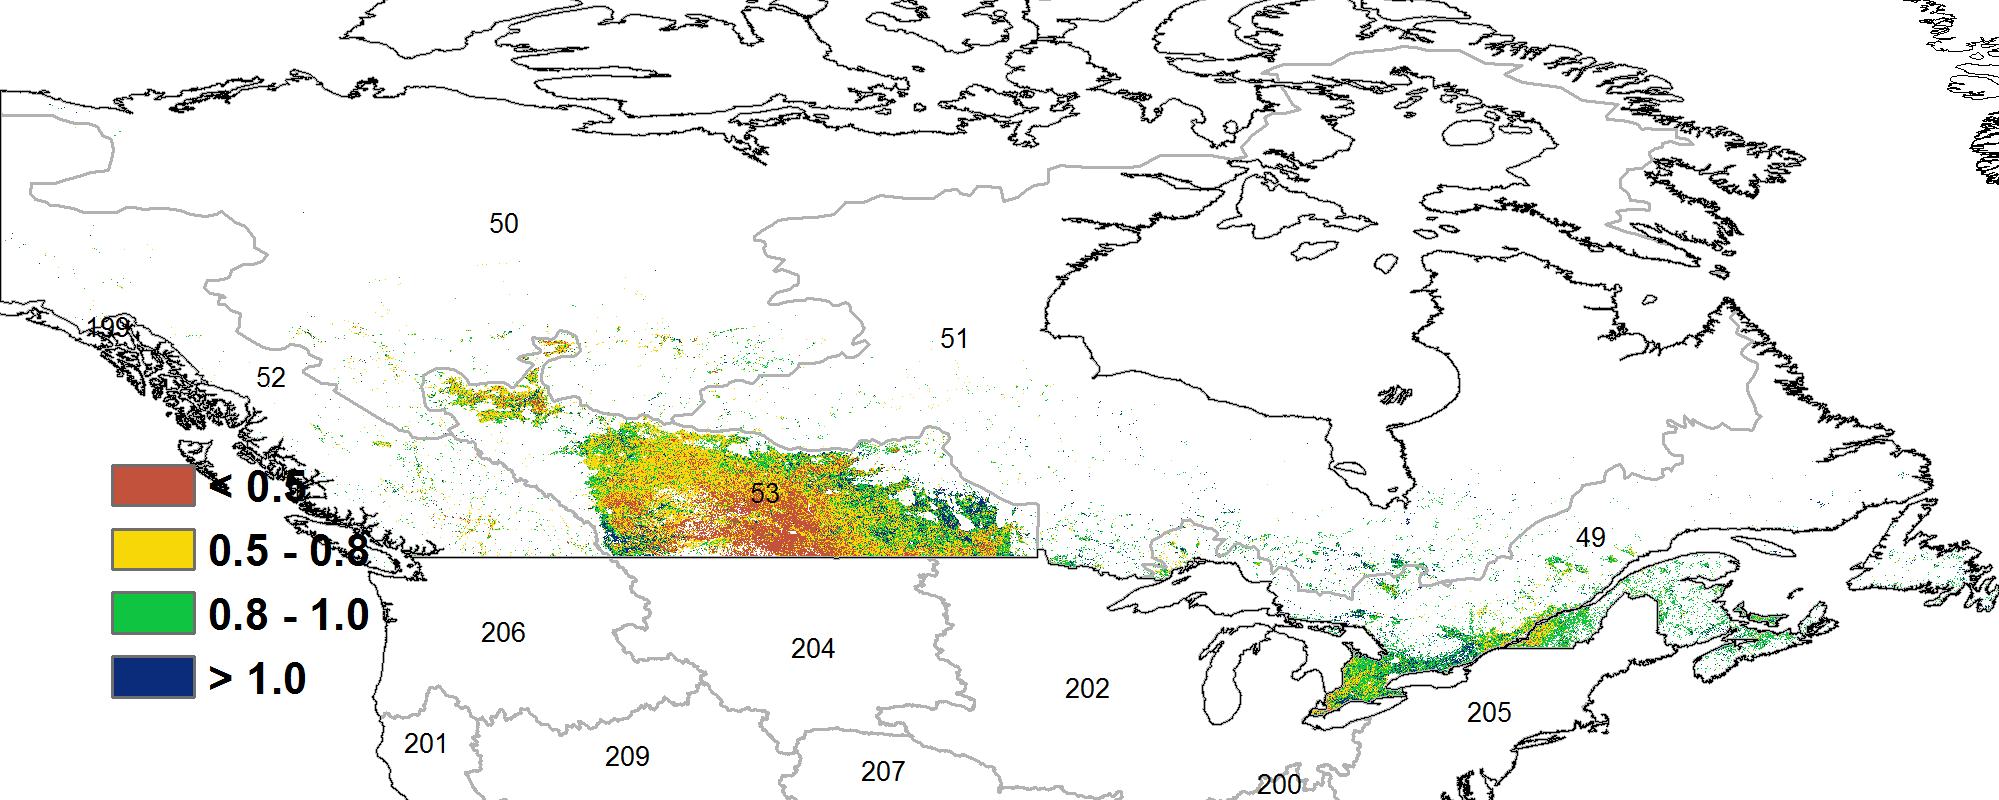
The Prairies (the area identified as 53 in the NDVI clustering map) and the St. Lawrence Basin (49, covering Ontario and Quebec) are the main agricultural areas.
The Prairies is the main crop production area in Canada. It grows mainly summer crops. In this reporting period, the rainfall was close to average while radiation (RADPAR +1%) and temperature (TEMP +0.2°C) were slightly above average, leading to a slightly increased potential biomass production (BIOMSS +5%).
The Saint Lawrence basin is the main winter wheat production region. The temperature (TEMP +2.3°C) was significantly above average while radiation (RADPAR +2%) and rainfall (RAIN -2%) were near average, leading to a slightly increased potential production (BIOMSS +16%). According to the NDVI development graph, the crop conditions trended around the average. The negative departures can be attributed to cloud cover in the satellite images or snow on the ground. Considering that cropped arable land fraction was close to average (CALF 0%), the situation of crops was assessed as normal.
Figure 3.12 Canada's crop condition October 2022 - January 2023

(a) Phenology of major crops
![]()
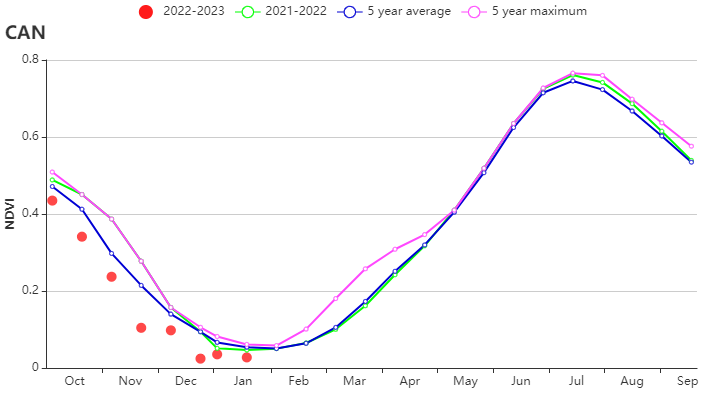
(b) Crop condition development graph based on NDVI (c) Maximum VCI

(d) Spatial NDVI patterns compared to 5YA (e) NDVI profiles
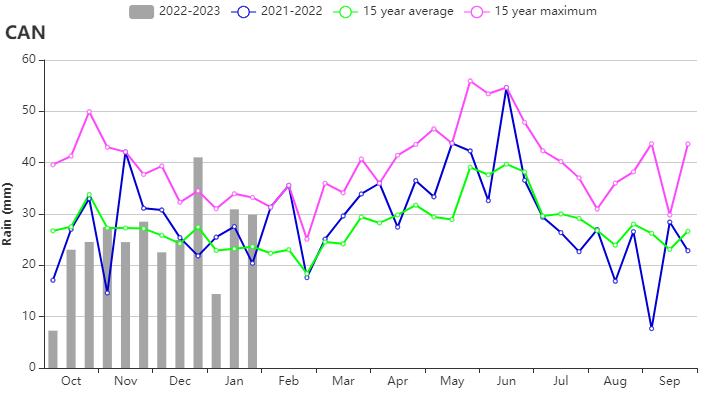
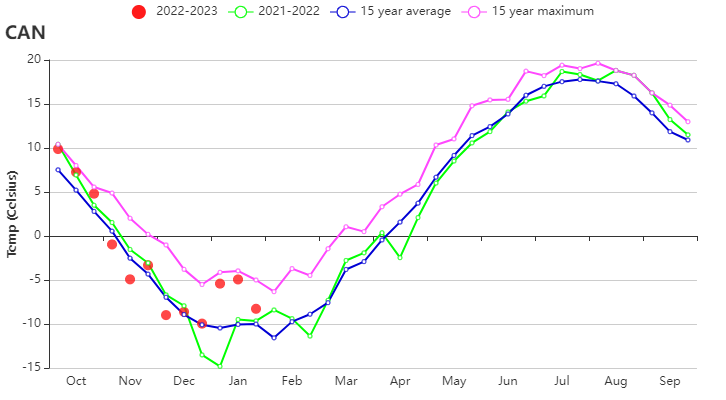
(f) Rainfall time series (g) Temperature time series
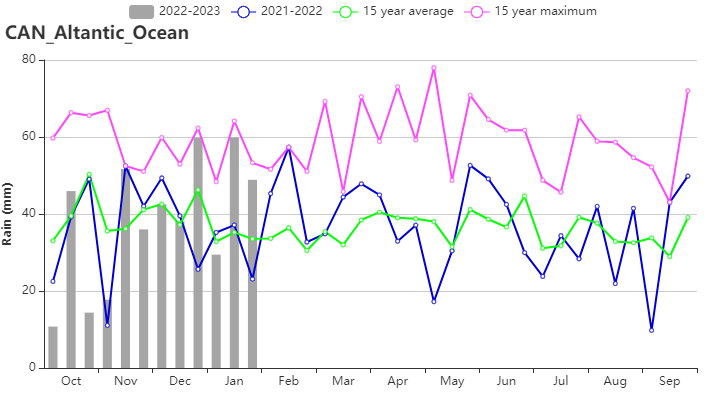
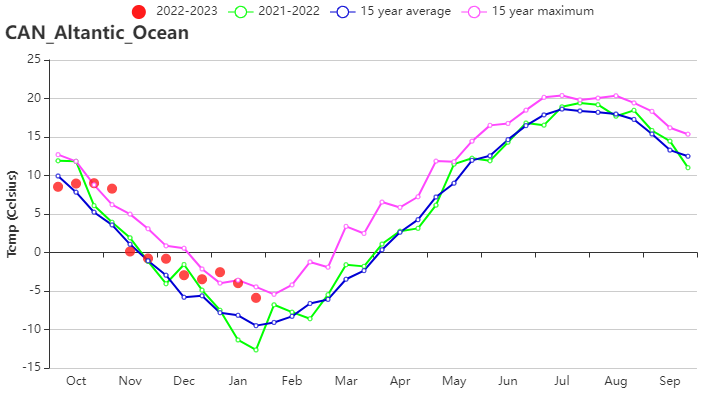
(h) Rainfall time series(left) and temperature time series(right) for Saint Lawrence basin
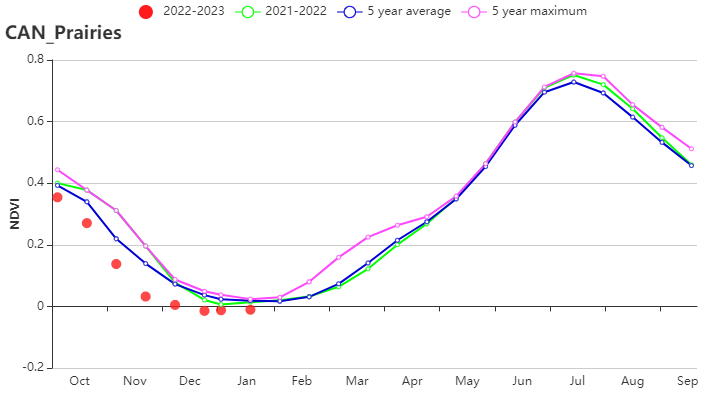
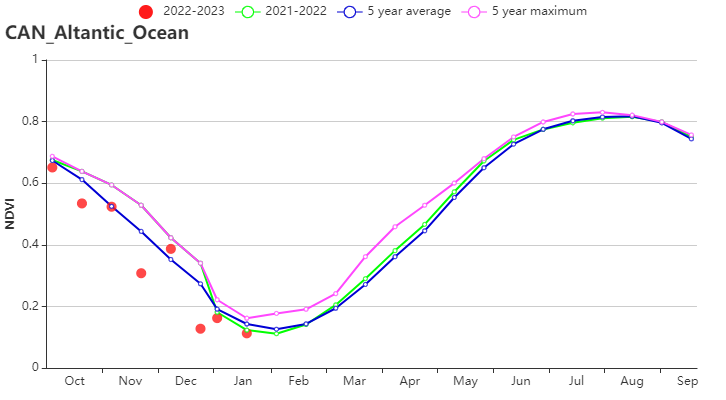
(i) Crop condition development graph based on NDVI (Canadian Prairies region (left) and Saint Lawrence basin region (right))
Table 3.15. Canada's agroclimatic indicators by sub-national regions, current season's values and departure from 15YA, October 2022-January 2023
| Region | RAIN | TEMP | RADPAR | BIOMSS | ||||
| Current(mm) | Departure from 15YA(%) | Current(°C) | Departure from 15YA(°C) | Current(MJ/m2) | Departure from 15YA(%) | Current(gDM/m2) | Departure from 15YA(%) | |
| Saint Lawrence basin | 455 | -2 | 1.2 | 2.3 | 324 | 2 | 407 | 16 |
| Prairies | 161 | 0 | -4.7 | 0.2 | 293 | 1 | 272 | 5 |
Table 3.16. Canada agronomic indicators by sub-national regions, current season's values and departure, October 2022-January 2023
| Region | CALF | Maximum VCI | |
| Current(%) | Departure from 5YA(%) | Current | |
| Saint Lawrence basin | 98 | 0 | 0.89 |
| Prairies | 33 | -9 | 0.69 |
