Winter wheat and rice are the main cereals that are grown in Afghanistan. Winter wheat was sown in October and November. Rice was harvested in October and November.
The agro-climatic conditions showed that RAIN decreased by 28%. TEMP and RADPAR were at the average level. BIOMSS decreased by 16%. The CALF was only 3%, increased by 3%, and the VCIx was only 0.25.
According to the last CropWatch bulletin, it was found that heavy rains and floods occurred in Parwan and Nangarhar provinces in August. After August, there was a drought. The drought situation was particularly severe in northern Afghanistan. According to the crop condition development graph based on NDVI, the NDVI was close to the average level between October and December and was lower than that of last year and the 5-year average in January.
The spatial distribution of the NDVI profiles shows that 39.9% of the total cropped areas were close to the average level during the whole monitoring period. These areas are mainly distributed in the south and southeast of Afghanistan. The NDVI departure in 44% of the total cropped areas was negative in January, mainly in the north of Afghanistan. This may be caused by extremely cold weather and snow. These areas are experiencing the coldest winter in the past 15 years, with the lowest temperature reaching minus 34º C. Many parts of Afghanistan were completely covered by snow. About 16.2% of total cropped areas were below average levels, mainly distributed in northern Afghanistan. Maximum VCI shows similar results. In addition, the CPI of Afghanistan was 0.98, which indicates a poor overall agricultural production situation.
Overall, the multi-year drought and cold winter cause challenges for the country's food security.
Regional analysis
CropWatch subdivides Afghanistan into four zones based on cropping systems, climatic zones, and topography. They are described below as Central region with sparse vegetation (1), Dry region (2), Mixed dry farming and irrigated cultivation region (3), and Mixed dry farming and grazing region (4).
The RAIN in the Central region with sparse vegetation was 79 mm (-29%). The TEMP was 1.5°C (+1.4°C). The RADPAR was 808 MJ/m2, at an average level. According to the NDVI-based crop condition development graph, the NDVI was at the average level between October and January. BIOMSS decreased by 5%, CALF had decreased by 44% and VCIx was 0.44. Except for January, crop conditions in this region were near average.
The Dry region recorded 68 mm of rainfall (RAIN -24%), TEMP was higher than average at 7.9°C, and RADPAR was 854 MJ/m2. According to the NDVI-based development graph, crop conditions were close to the five-year average from October to December and were below the average level in January. CALF in this region was only 2% and VCIx was 0.28.
In the Mixed dry farming and irrigated cultivation region, the following indicator values were observed: RAIN 139 mm (-26%); TEMP 2.5°C (-0.5°C); RADPAR 723 MJ/m2 (+1%). BIOMSS decreased by 16% and CALF was 4% above average. According to the NDVI-based crop condition development graph, NDVI was close to the average level and VCIx was 0.65. The crop condition is at the average level.
The Mixed dry farming and grazing region recorded 54 mm of rainfall (RAIN -47%). TEMP was 5.4°C (-0.2°C) and RADPAR was 783 MJ/m2, near average levels. CALF was 0%. VCIx was 0.41 and BIOMSS decreased by 28%. According to the crop condition development graph, the NDVI was much lower than the 5YA since December, indicating poor conditions.
Figure 3.5 Afghanistan’s crop condition, October 2022 - January 2023

(a) Phenology of major crops

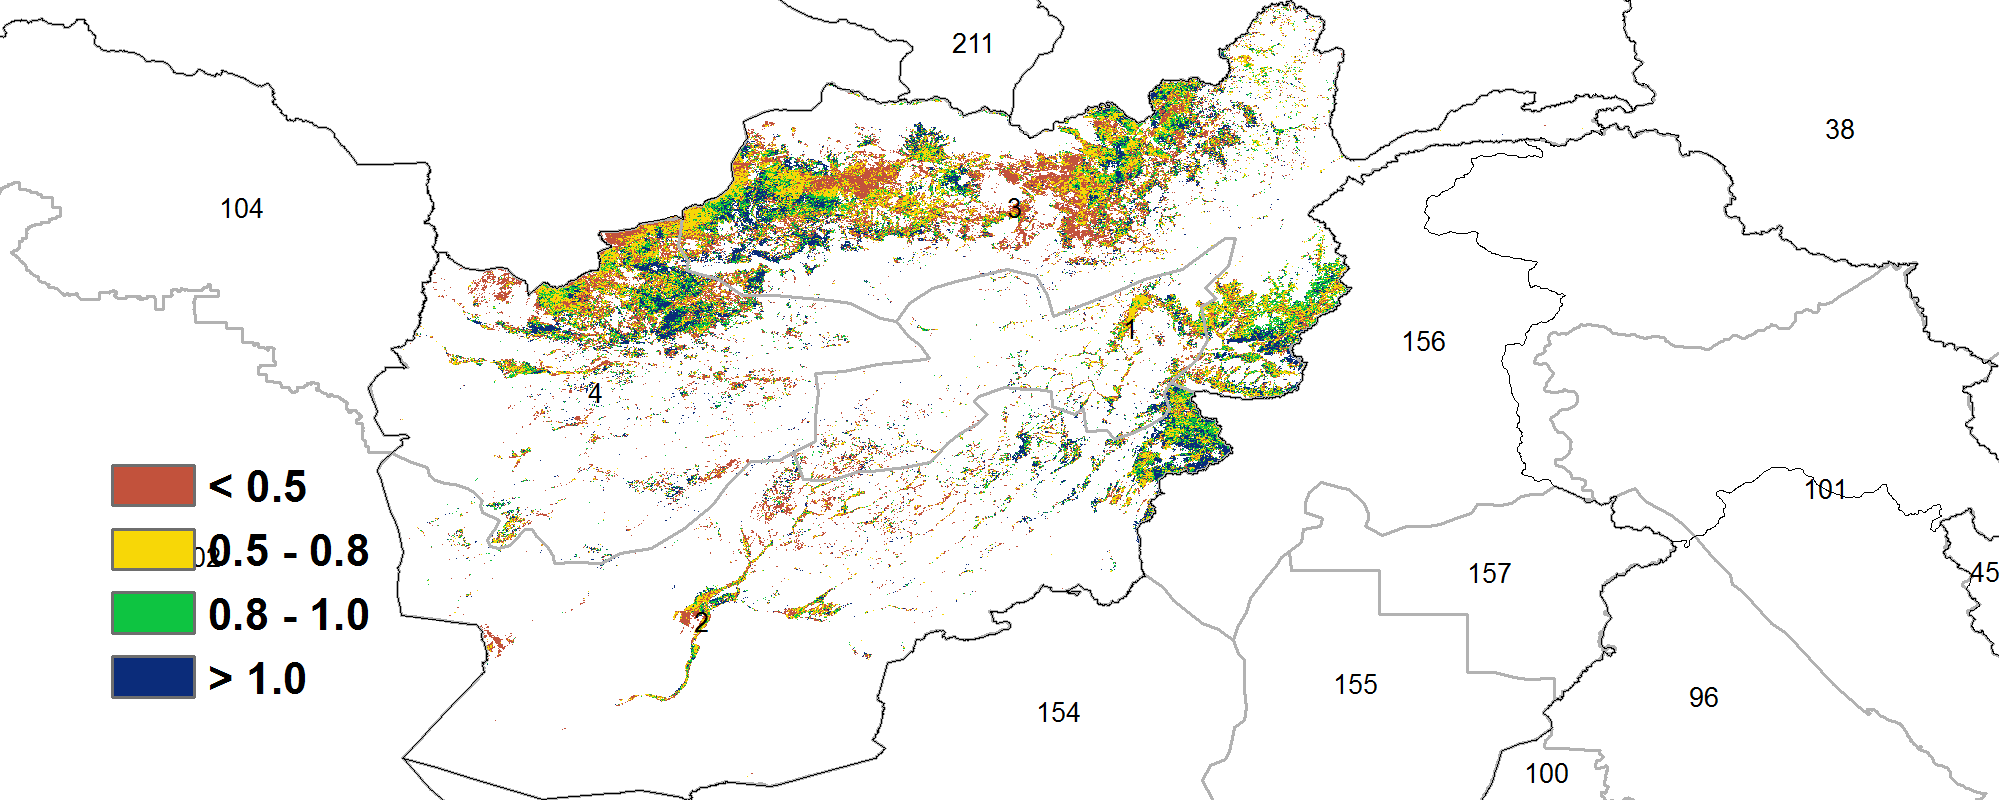
(b) Crop condition development graph based on NDVI (c) Maximum VCI
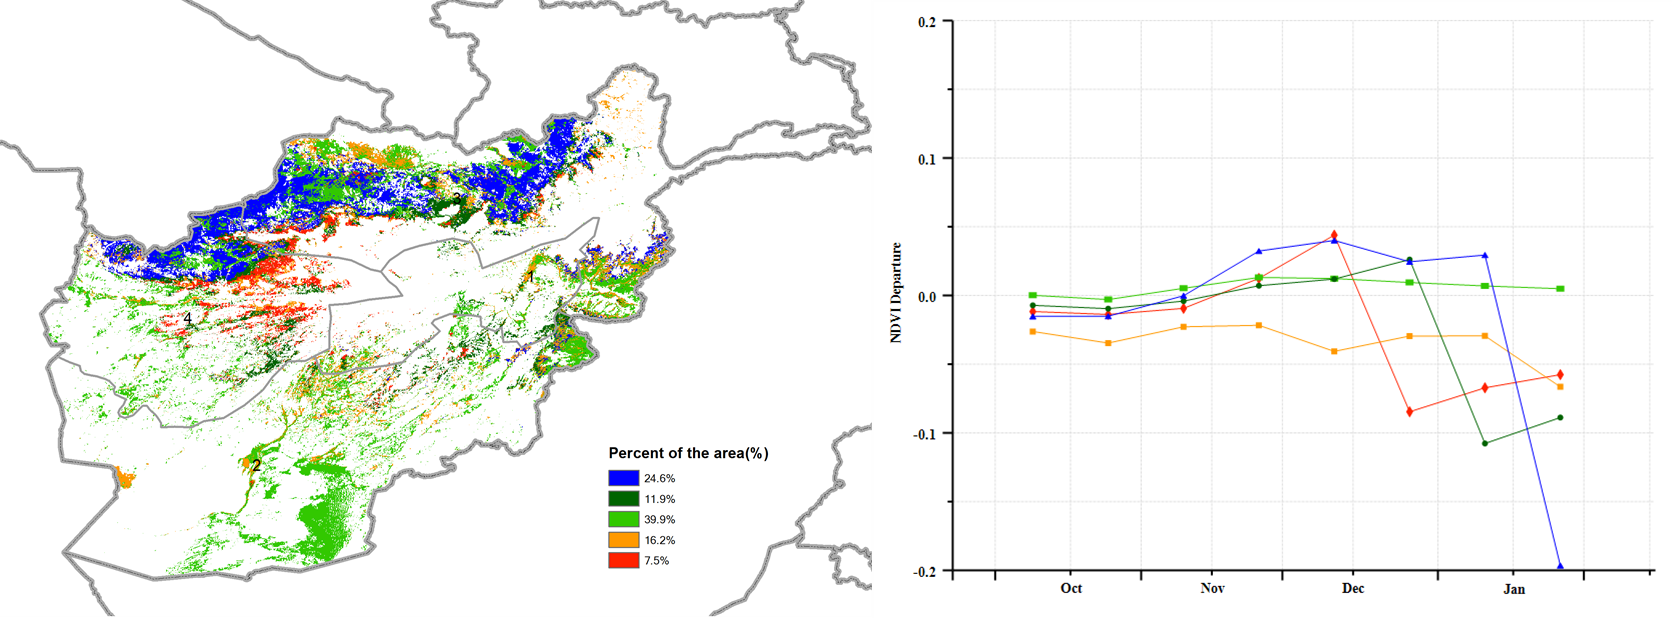
(d) Spatial NDVI patterns compared to 5YA (e) NDVI profiles
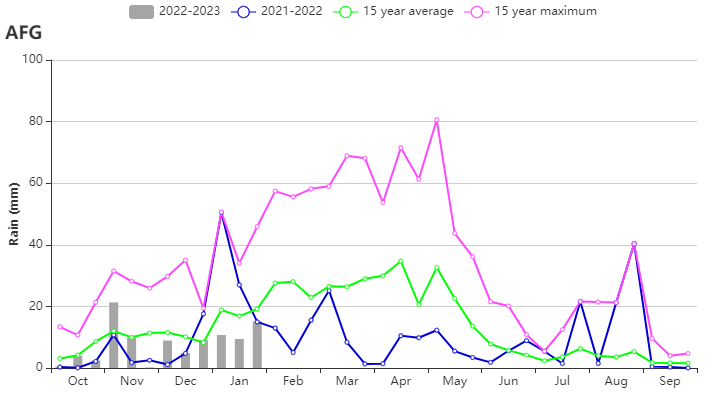
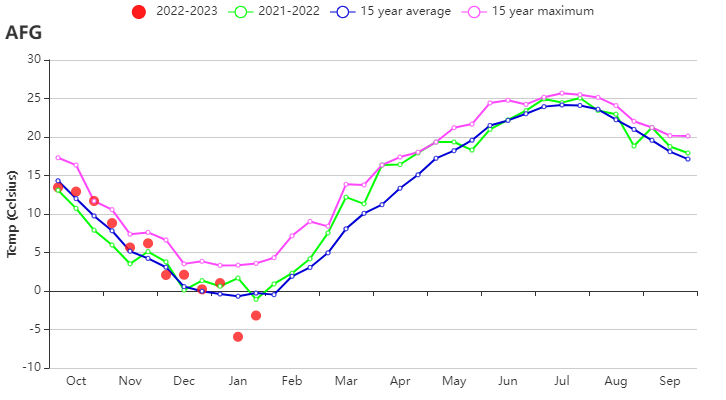
(f) Rainfall profiles (g) Temperature profiles
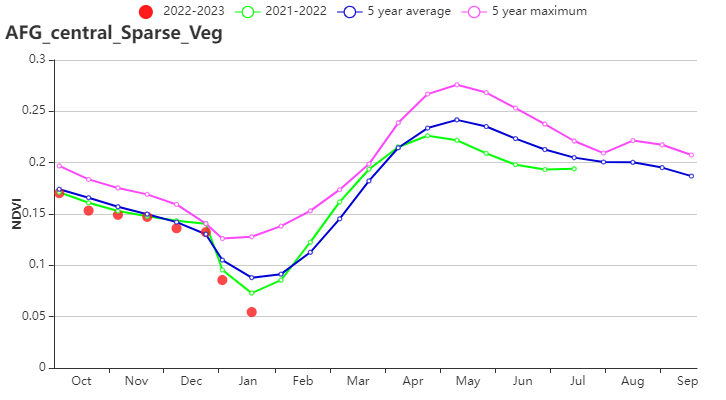
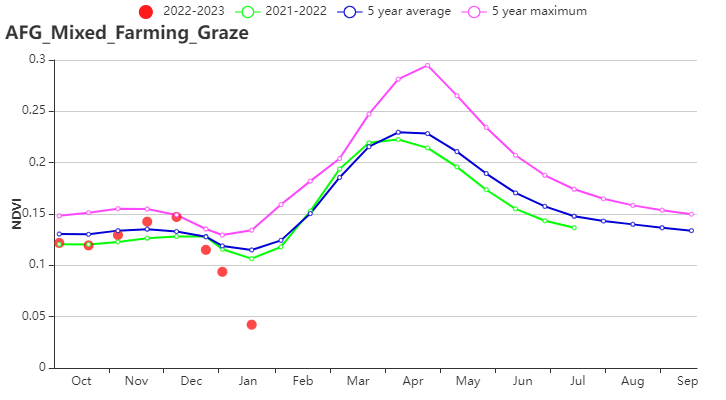
(h) Crop condition development graph based on NDVI (central_Sparse_Veg Region (left) and Mixed_Farming_Graze Region (right))
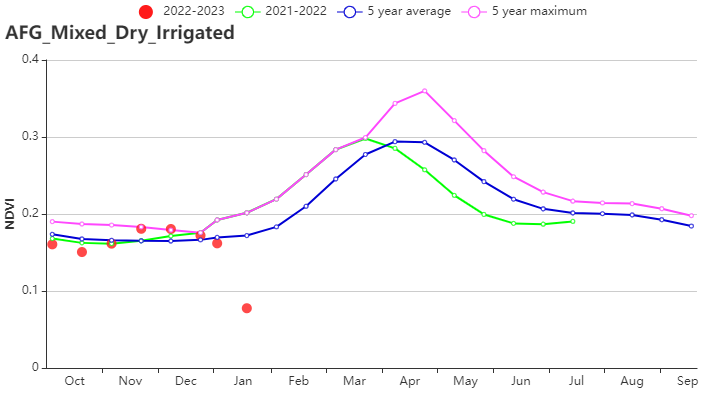
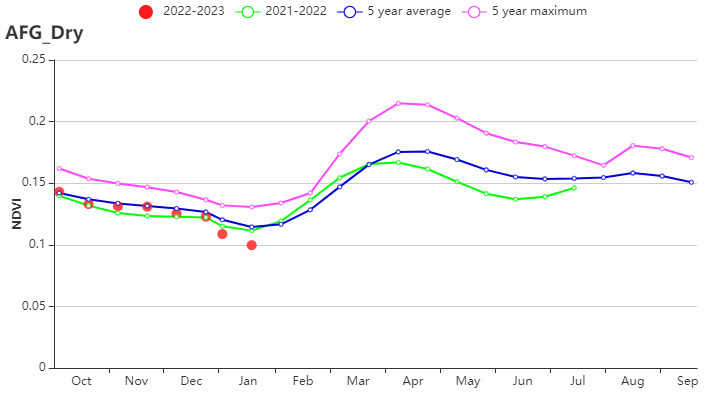
(i) Crop condition development graph based on NDVI (Mixed_Dry_Irrigated Region (left) and Dry (right))
Table 3.2 Afghanistan’s agroclimatic indicators by sub-national regions, current season’s values and departure from 15YA, October 2022 - January 2023
| Region | RAIN | TEMP | RADPAR | BIOMSS | ||||
| Current(mm) | Departure from 15YA(%) | Current(°C) | Departure from 15YA(°C) | Current(MJ/m2) | Departure from 15YA(%) | Current(gDM/m2) | Departure from 15YA(%) | |
| Central region with sparse vegetation | 79 | -29 | 1.5 | 1.4 | 808 | 0 | 254 | -5 |
| Dry region | 68 | -24 | 7.9 | 0.6 | 854 | -1 | 257 | -7 |
| Mixed dry farming and irrigated cultivation region | 139 | -26 | 2.5 | -0.5 | 723 | 1 | 289 | -16 |
| Mixed dry farming and grazing region | 54 | -47 | 5.4 | -0.2 | 783 | 0 | 220 | -28 |
Table 3.3 Afghanistan’s agronomic indicators by sub-national regions, current season’s values and departure from 5YA, October 2022 - January 2023
| Region | CALF | Maximum VCI | |
| Current(%) | Departure from 5YA(%) | Current | |
| Central region with sparse vegetation | 1 | -44 | 0.44 |
| Dry region | 2 | 15 | 0.28 |
| Mixed dry farming and irrigated cultivation region | 6 | 4 | 0.65 |
| Mixed dry farming and grazing region | 0 | 12 | 0.41 |
