This reporting period covers the main growing stages for early maize, early soybean and rice, planting of late maize and late soybean and the harvesting of wheat. The situation in South America is variable. Only TEMP showed in general near average values. Agronomic and drought indicators showed poor conditions, in particular in North-East Pampas in Argentina and in the north of the Brazilian agricultural area.
Spatial distribution of rainfall profiles showed five different patterns. The blue profile showed the most negative anomalies and was located in the North of Brazilian agricultural area in the states of Mato Grosso, Goiás and Minas Gerais. The observed negative anomalies throughout the monitoring period ranged from -30 to -100 mm. The orange profile, located in the west of Mato Grosso, Mato Grosso do Sul, San Pablo and part of Rio Grande do Sul state, showed negative anomalies of near -60 mm during most of the period, except at the beginning of October and mid-December when it showed only slight negative anomalies. The red profile was observed in the west of Mato Grosso do Sul, Parana and Santa Catarina states in Brazil, East Paraguay and North Mesopotamia in Argentina and showed high variability, with positive anomalies in mid-October, mid-December and end-January, and negative anomalies during November and end-December. A dark green profile was observed in most of Chaco, Pampas and South Mesopotamia in Argentina, Uruguay and South of Rio Grande do Sul state in Brazil. It showed a quite stable pattern with near no anomalies along the reporting period. Finally, a light green profile was identified in small areas like in Subtropical Highlands and North-West Pampas in Argentina and East Santa Catarina state in Brazil. It showed high positive anomalies during November, December and January, with high peaks (more than 90 mm) at beginning of December and at the end of January.
Temperature profiles showed five homogeneous patterns. These profiles had some similarities among them, with reductions at the beginning of November (except for the blue profile), increases at the beginning of December, reductions at the end of December and increases again during January. Variation among profiles was mostly observed in the magnitude of the anomalies. The orange profile showed in general the most negative values and was observed in West Paraguay, North Mesopotamia in Argentina and Paraná and Santa Catarina states in Brazil. The light green profile, located in Chaco and North Pampas in Argentina, North and East Uruguay and Rio Grande do Sul, Mato Grosso do Sul and San Pablo sates in Brazil, showed less negative anomalies and higher positive anomalies. The blue profile showed also less negative anomalies and high positive anomalies and was observed in East Pampas, South-West Uruguay and West of Mato Grosso in Brazil. The dark green profile, located in South and West Pampas showed values in between the light green and blue profiles. Finally, the red profile showed in general the highest positive anomalies and almost no negative anomalies and was located in Mato Groso do Sul, Goiás and Minas Gerais states in Brazil.
The CALF map showed uncropped areas in Argentina, in Center-East and South-West Pampas, Chaco and Subtropical Highlands. BIOMSS showed the poorest conditions with strong negative anomalies in Mato Grosso, Mato Grosso do Sul, Goiás, San Pablo and South of Rio Grande do Sul in Brazil, as well as in Chaco, South Mesopotamia and Center East Pampas in Argentina and in East Uruguay. Good conditions with positive anomalies were observed in East Paraguay, Paraná and Santa Catarina states in Brazil, and West Pampas and Subtropical Highlands in Argentina.
Surface soil moisture showed low values (less than 30%) in most of agricultural areas of Brazil and Argentina. Intermediate soil moisture values were observed in Paraguay and Mato Gross and Mato Grosso do Sul in Brazil. SPI showed severe to extreme conditions in Goiás and Minas Gerais states in Brazil. Moderate to severe drought conditions were observed in Center-East Pampas and South Mesopotamia in Argentina, Uruguay and Rio Grande do Sul in Brazil. The poor conditions in the drought stricken areas may have affected wheat production and corn and soybean development, and may also have affected or delayed the planting of summer crops in Argentina, where the CALF showed some uncropped areas. Wet conditions were observed in North-West Pampas and Subtropical Highlands in Argentina. The rest of Brazil and Argentina and Paraguay showed normal conditions.
VCIx showed good conditions in Paraguay and most of Brazil (with values higher than 0.8), except for Río Grande do Sul state where poor conditions were observed. The worst conditions were observed in Argentina, with values of VCIx less than 0.5 in North and Center-East Pampas, Chaco, East Subtropical Highlands and South Mesopotamia. Good conditions in Argentina were only observed in part of West and South Pampas and South-West Subtropical Highlands.
Figure 2.3 South America MPZ: Agroclimatic and agronomic indicators, October 2022 to January 2023.
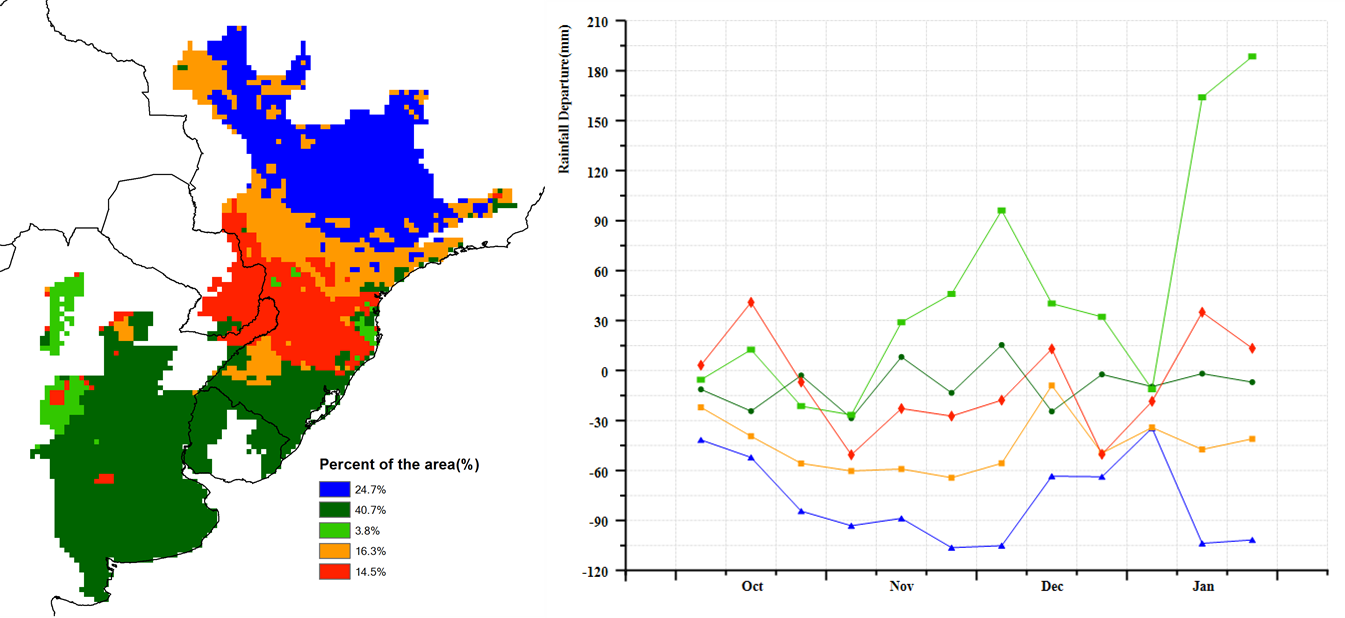
a. Spatial distribution of rainfall profiles b. Profiles of rainfall departure from average (mm)
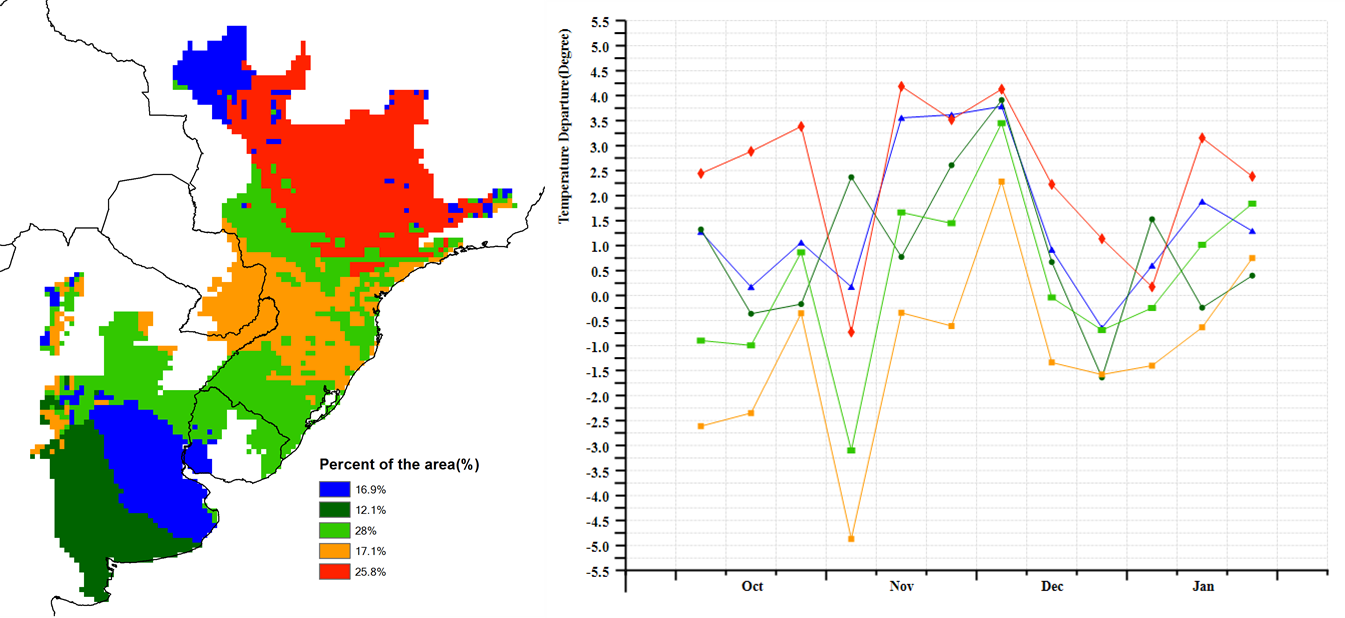
c. Spatial distribution of temperature profiles d. Profiles of temperature departure from average (°C)
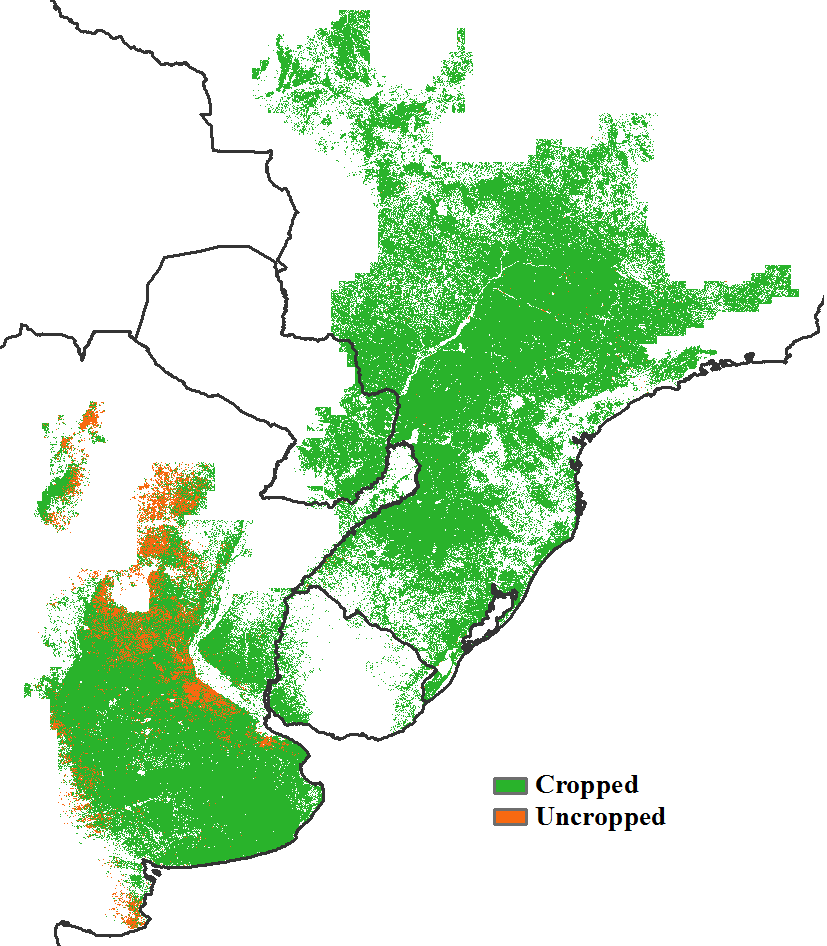
e. Cropped and uncropped arable land
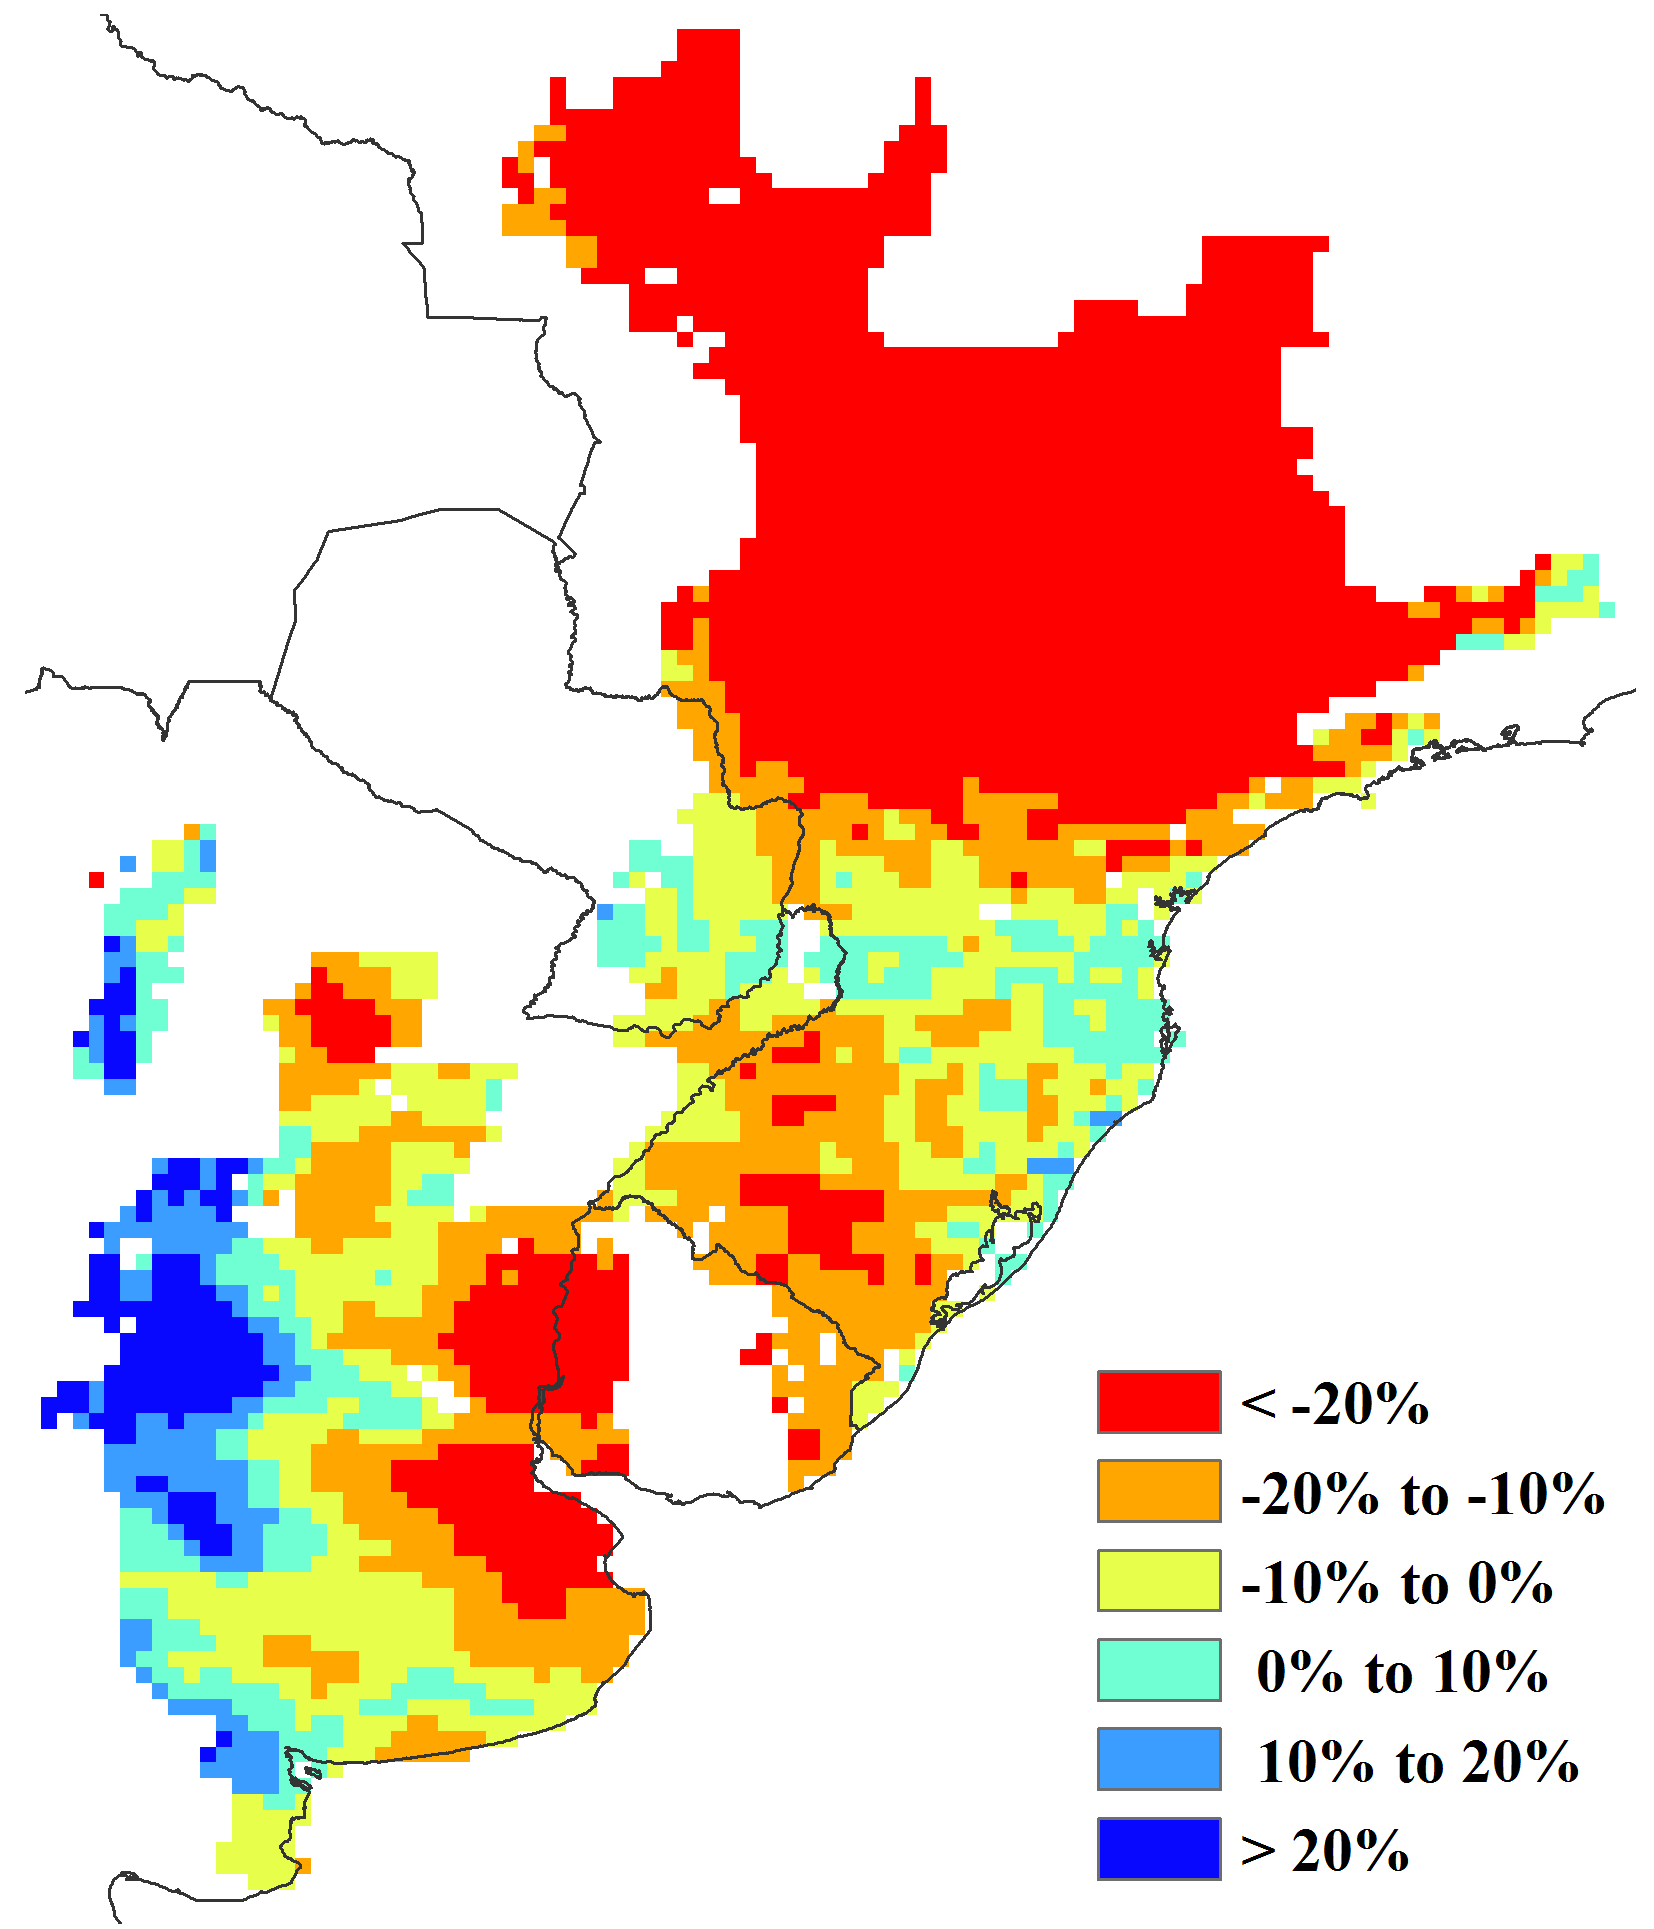
f. Potential biomass departure from 5YA
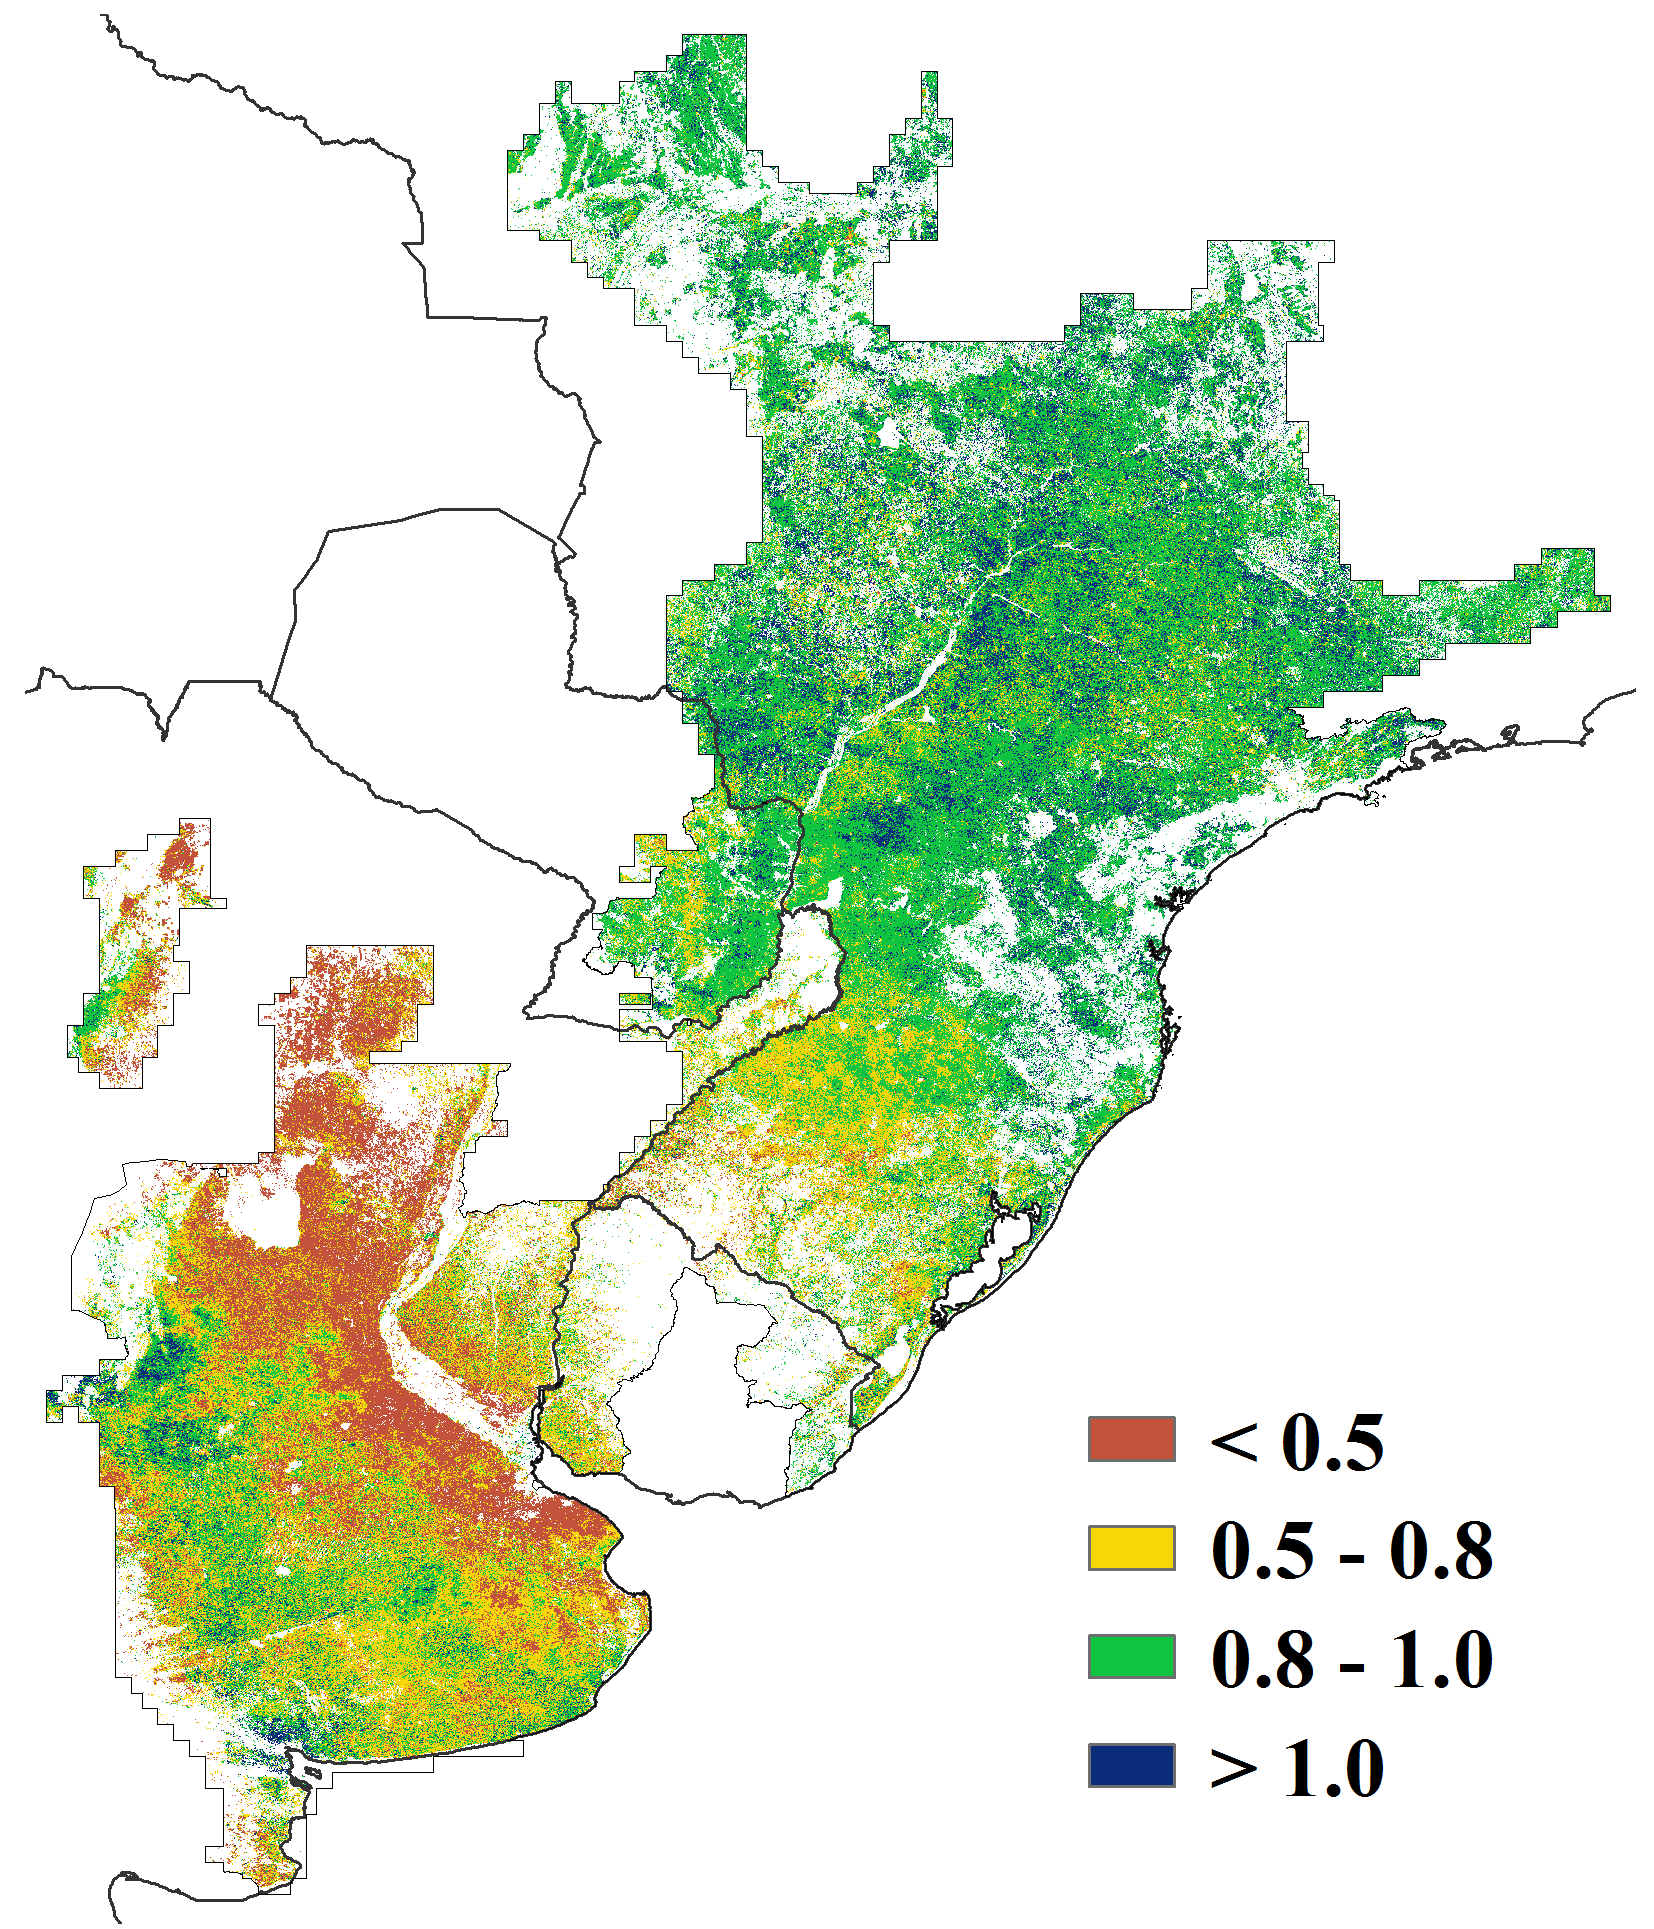
g. Maximum VCI
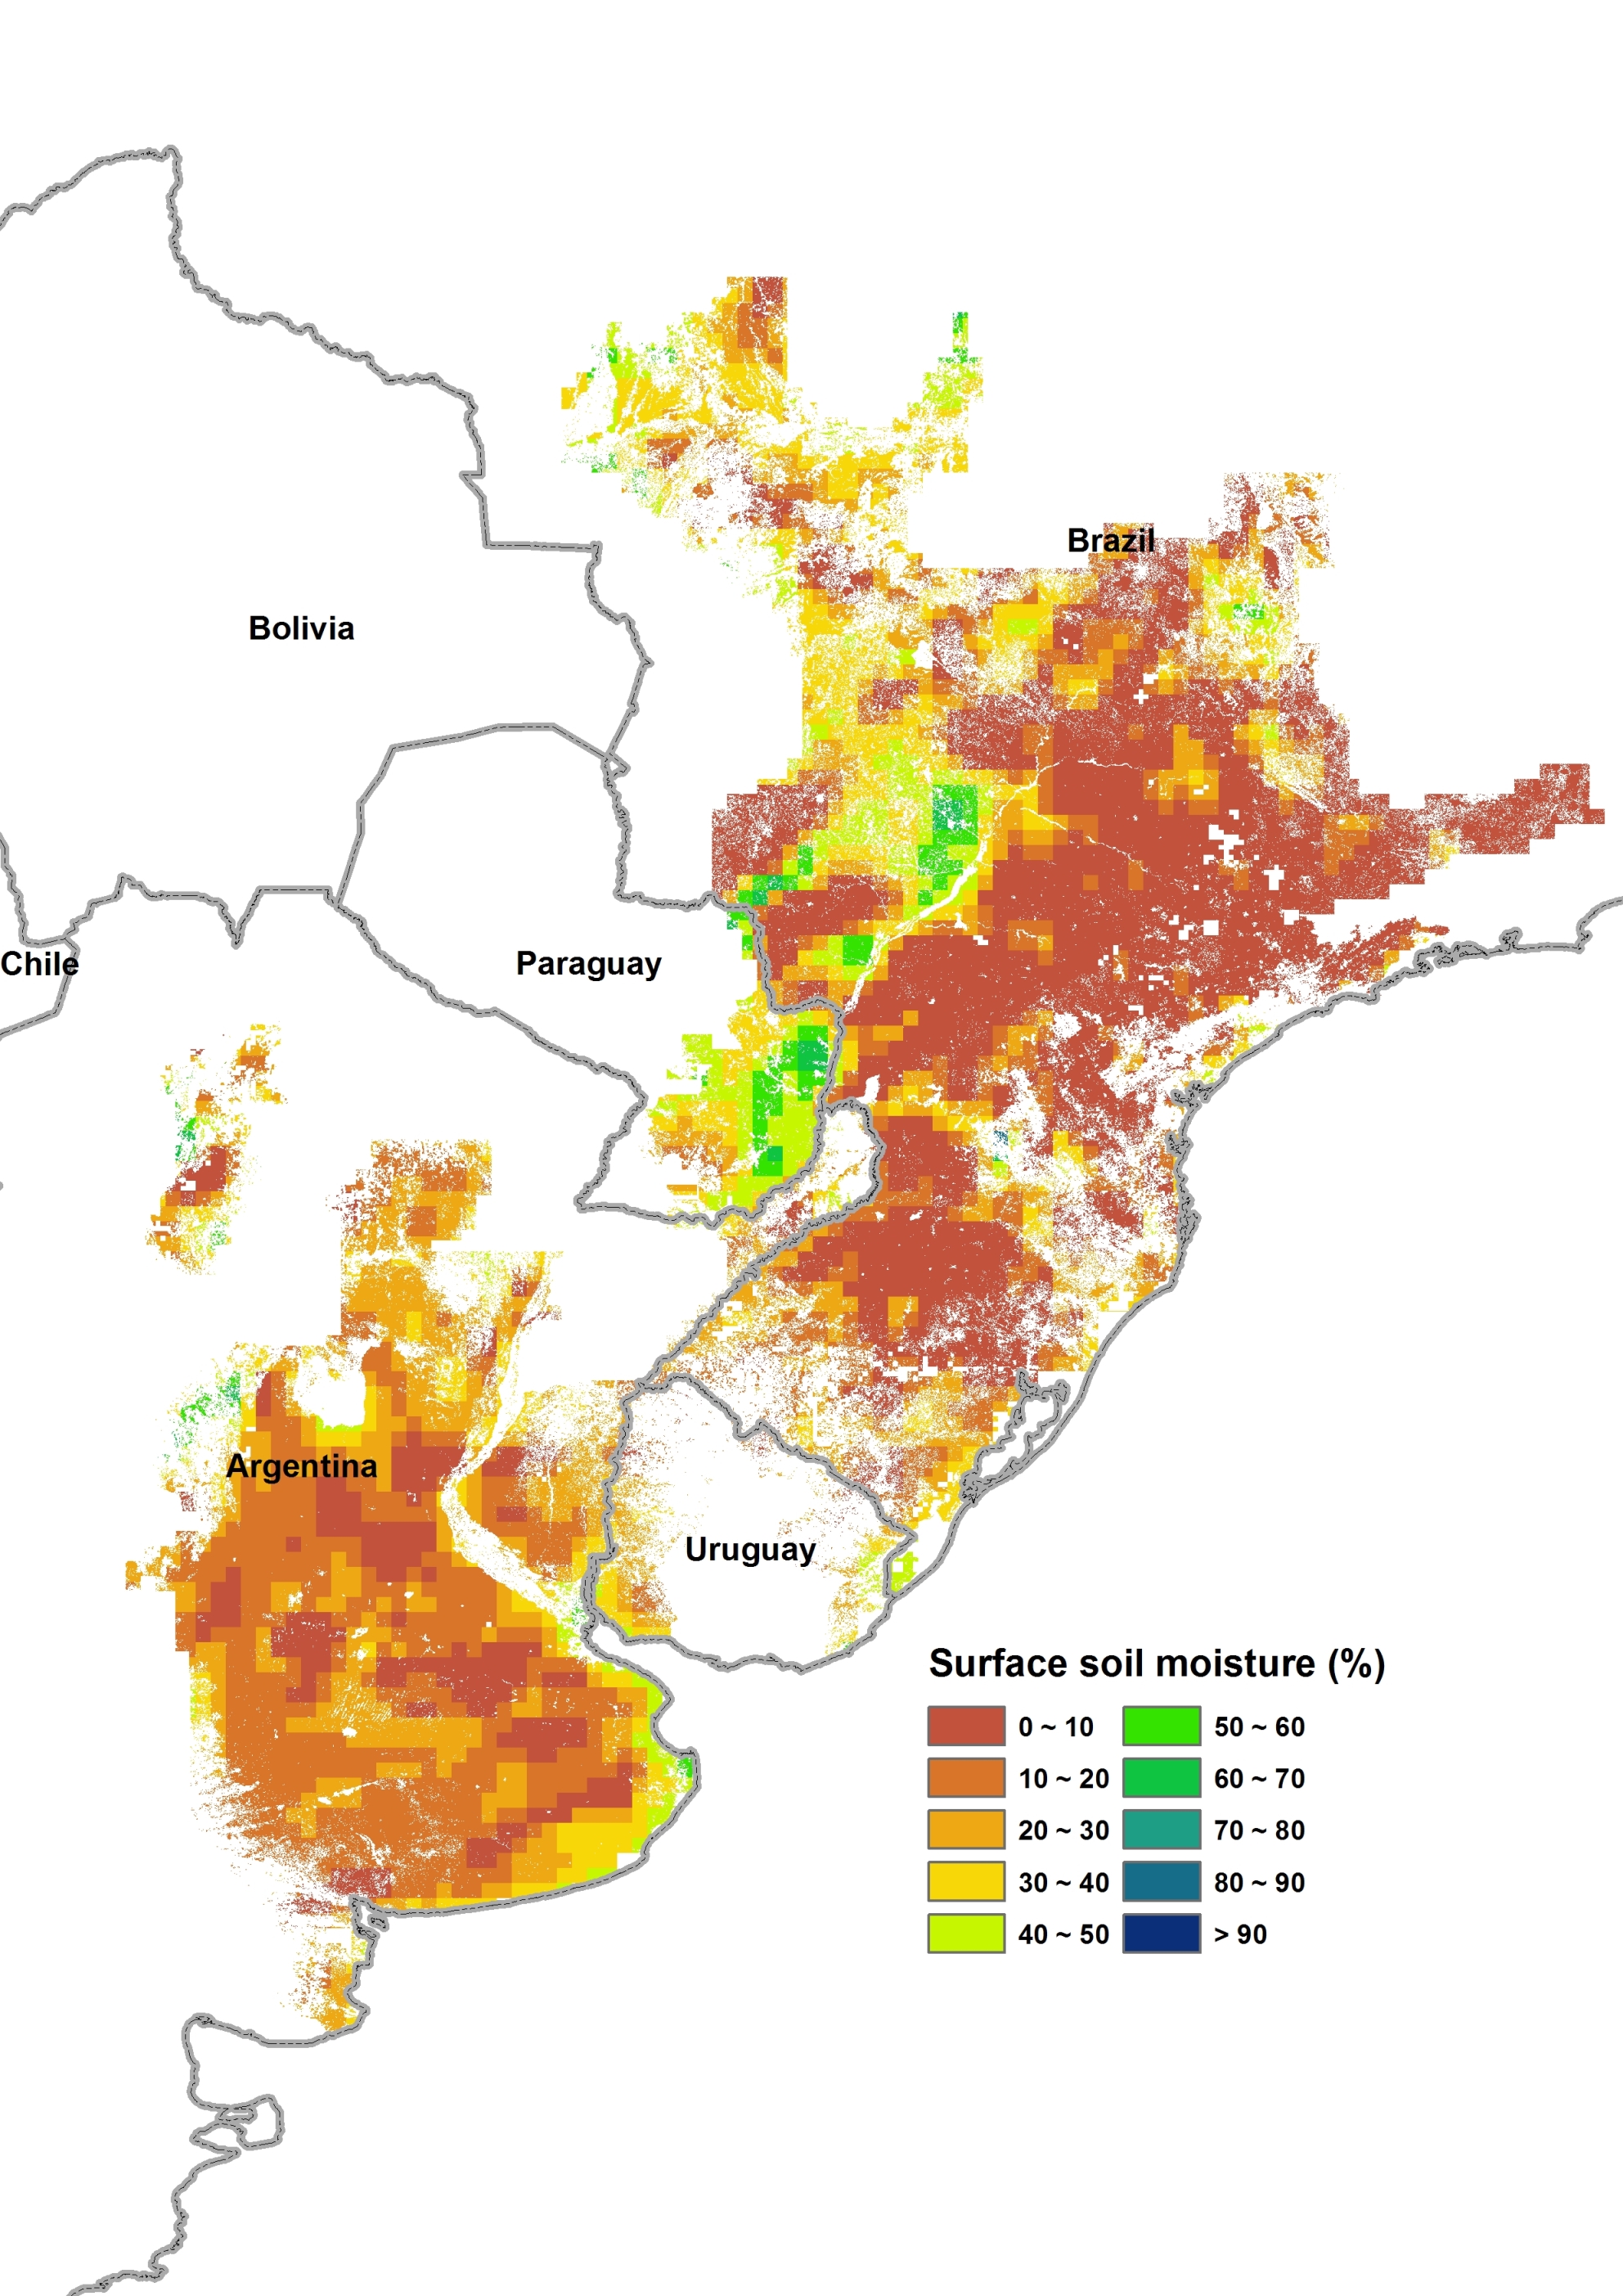
h. Surface Soil Moisture
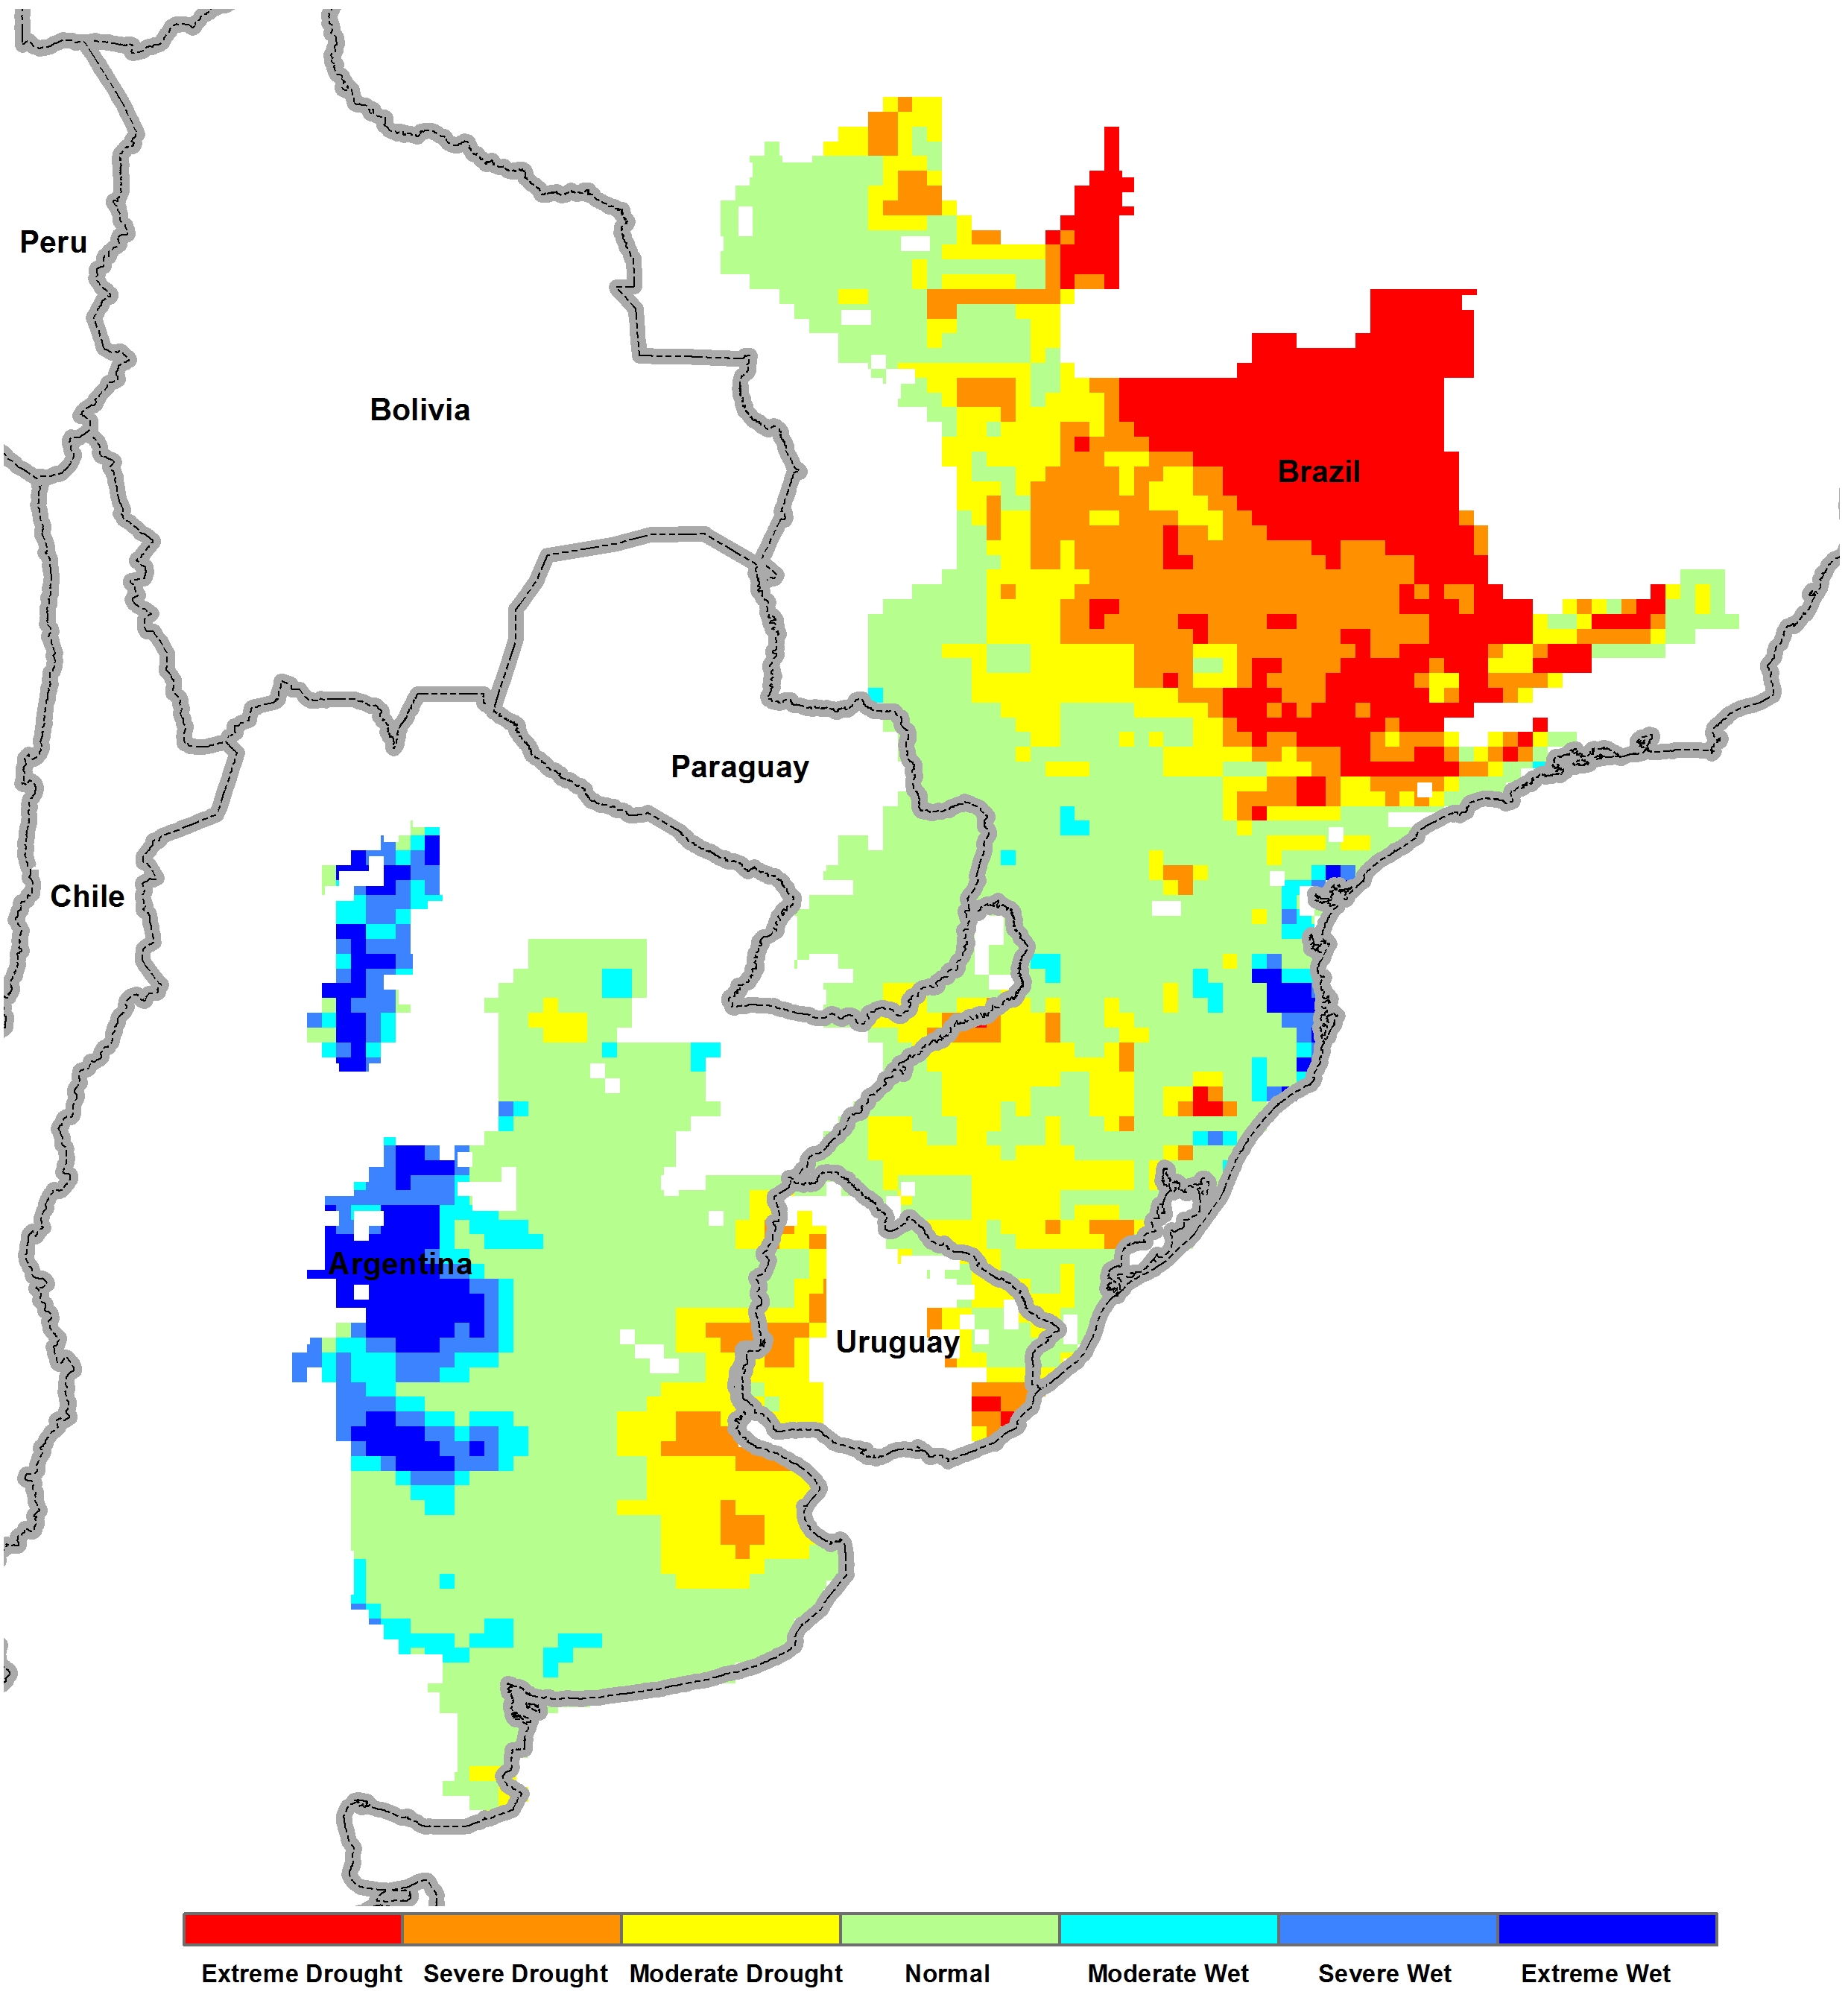
i. Standard Precipitation Index
