In Ethiopia, the primary food crops are teff, wheat, barley, and maize. This monitoring period covers the harvest season for grains, from October 2022 to January 2023.
In the primary agricultural production regions, the persistent drought influenced by the La Niña phenomenon has continued. Nationally, cumulative precipitation has decreased by an average of 33% compared to the 15YA. Meanwhile, average temperature (TEMP 0.0°C) and photosynthetically active radiation (RADPAR -1%) have remained mostly unchanged. Crops had been sown late due to the delayed start of the rainy season. They therefore senesced later than usual. This explains as to why the NDVI curve approached average levels in November and December, despite of lower maximum values which had been observed during the previous monitoring period. Maximum VCI was 0.93. The crop production index (CPI) was 1.18. However, this doesn't necessarily mean that yields have returned to average levels. The estimated biomass (BIOMSS) was 14% lower than the 15YA due to the continued moisture stress throughout the entire 2022 main production season. Additionally, only 4.9% of Ethiopia's farmland is irrigated, making it less resilient to natural hazards, indicating that the 2022 cereal yields were below average.
In summary, the combination of poor rainfall, conflict, and poor macroeconomic conditions has led to below-average crop production in Ethiopia in 2022. Food insecurity is prevalent across the country, with the north, south, and southeast being particularly affected.
Regional analysis
This regional analysis focuses on five major cereal production regions: Central-northern maize-teff highlands (63), Western mixed maize zone (74), Great Rift region (65), South-eastern Mendebo highlands (71), and South-western coffee-enset highlands (73).
The agroclimatic conditions of Central-northern maize-teff highlands (63), Western mixed maize zone (74), and South-eastern Mendebo highlands (71) are similar, with cumulative precipitation below the average levels (RAIN -33%, -22%, and -30%). Biomass also decreased compared to 15YA (BIOMSS -15%, -14% and -14%). The NDVI showed an average trend. Cropped arable land fraction and cropping intensity did not change much. Due to the drought, crop production conditions were below average levels.
The Great Rift region (65) and the South-western coffee-enset highlands (73) were even more severely affected by the drought. Precipitation was almost half compared to the 15YA (RAIN -46%, -46%). Biomass was estimated to be below average (BIOMSS -16%, -20%). Cropped arable land fraction and cropping intensity have remained mostly unchanged. Crop production regions in these two regions were below average.
Figure 3.15 Ethiopia’s crop condition, October 2022 - January 2023

(a) Phenology of major crops
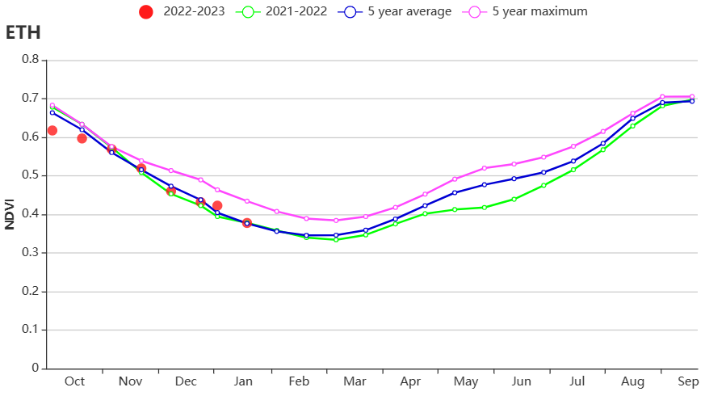
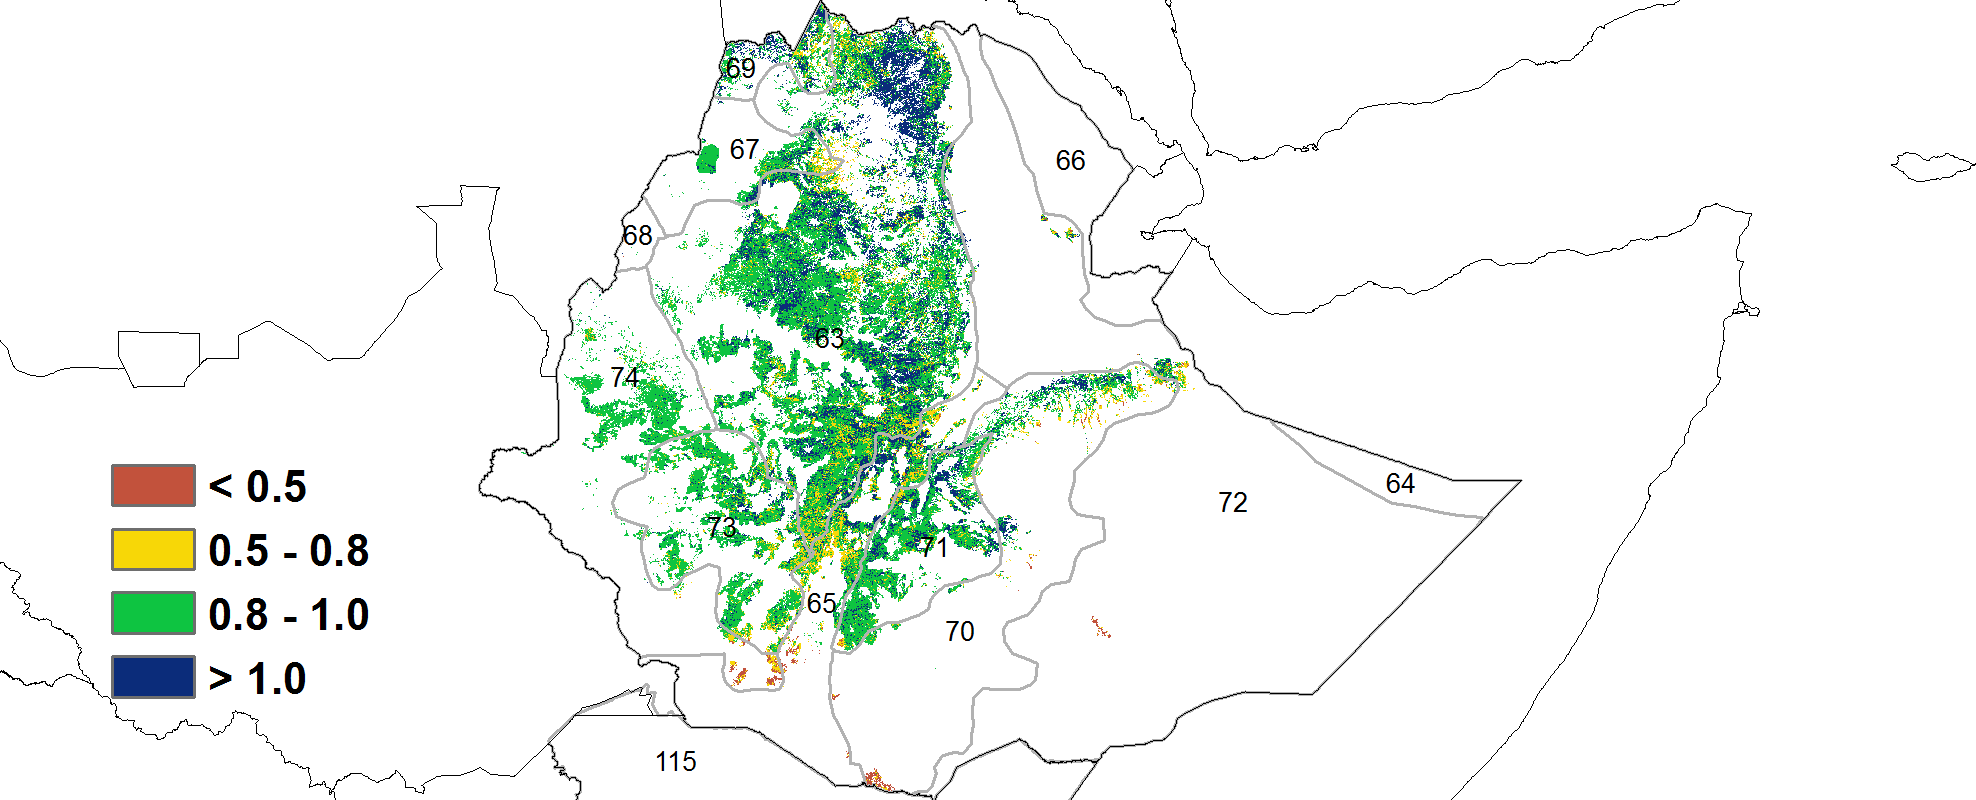
(b) Crop condition development graph based on NDVI (c) Maximum VCI

(f) Rainfall profiles (g) Temperature profiles
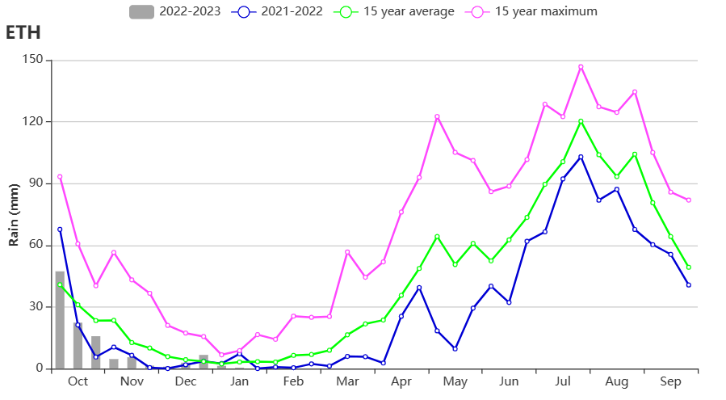
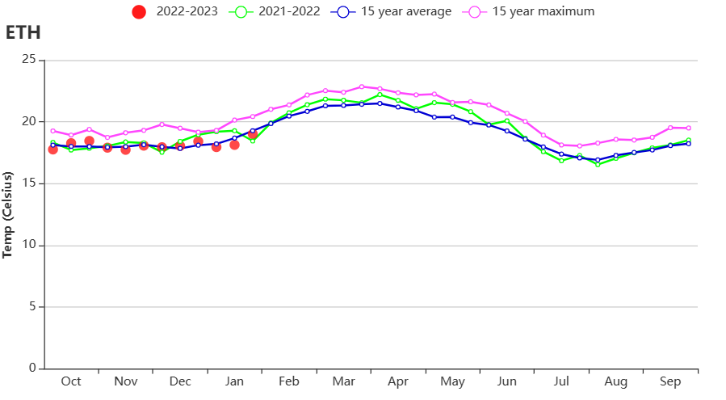
(f) Rainfall profiles (g) Temperature profiles
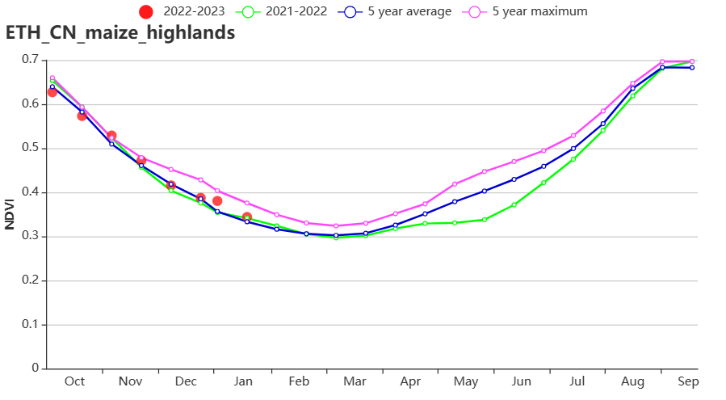

(h) Crop condition development graph based on NDVI (Central-northern maize-teff highlands (left) Great Rift region (right))
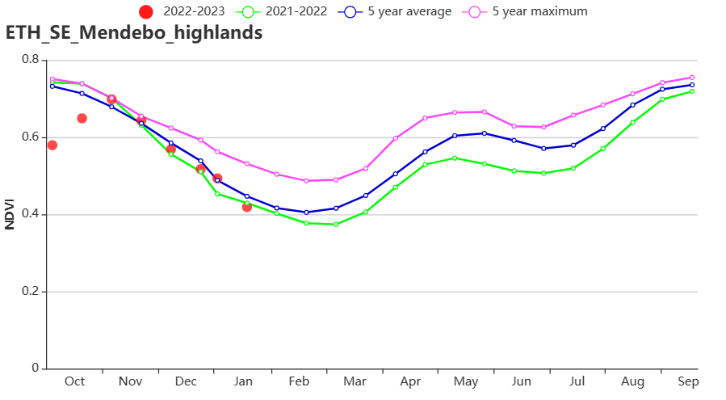
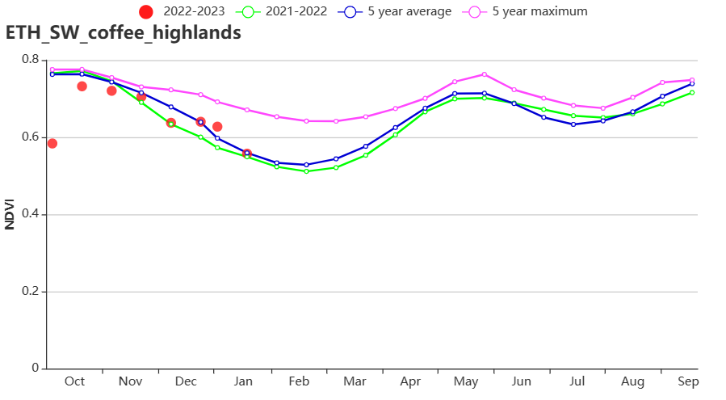
(i) Crop condition development graph based on NDVI (South-eastern Mendebo highlands (left) and South-western coffee-enset highlands (right))
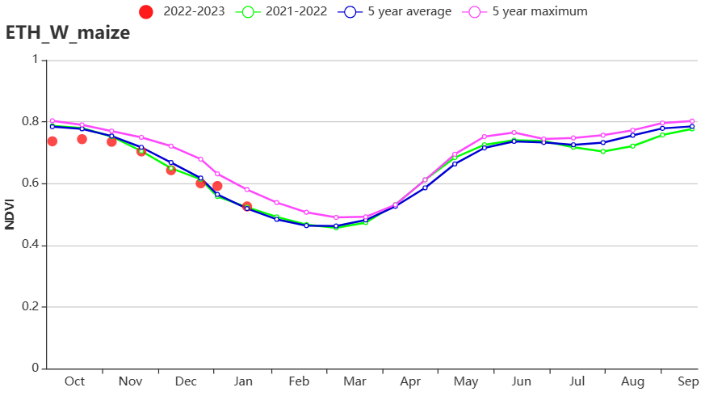
(j) Crop condition development graph based on NDVI (Western mixed maize zone)
Table 3.21 Ethiopia’s agroclimatic indicators by sub‐national regions, current season's values and departure from 15YA, October 2022 - January 2023
| Region | RAIN | TEMP | RADPAR | BIOMSS | ||||
| Current(mm) | Departure from 15YA(%) | Current(°C) | Departure from 15YA(°C) | Current(MJ/m2) | Departure from 15YA(%) | Current(gDM/m2) | Departure from 15YA(%) | |
| Central-northern maize-teff highlands | 59 | -33 | 17.1 | -0.1 | 1334 | -2 | 353 | -15 |
| Great Rift region | 49 | -46 | 18.1 | 0.0 | 1315 | -3 | 390 | -16 |
| South-eastern Mendebo highlands | 94 | -22 | 14.6 | -0.2 | 1264 | -3 | 399 | -14 |
| South-western coffee-enset highlands | 185 | -46 | 18.4 | 0.3 | 1304 | 0 | 595 | -20 |
| Western mixed maize zone | 240 | -30 | 21.3 | -0.3 | 1280 | 2 | 666 | -14 |
Table 3.22. Ethiopia’s agronomic indicators by sub‐national regions, current season's values and departure from 5YA, October 2022 - January 2023
| Region | CALF | Maximum VCI | |
| Current(%) | Departure from 5YA(%) | Current | |
| Central-northern maize-teff highlands | 96 | 4 | 0.96 |
| Great Rift region | 97 | 1 | 0.87 |
| South-eastern Mendebo highlands | 100 | 0 | 0.94 |
| South-western coffee-enset highlands | 100 | 0 | 0.90 |
| Western mixed maize zone | 98 | -2 | 0.88 |
