This report covers the sowing of winter wheat in October and November. According to the crop condition development graph, NDVI values were below average from October to early November, above average in mid-November, below average between late November and December, and above average in January. In this period, the overall rainfall (RAIN -9%) was below the 15YA. Temperature (TEMP, +2.1°C) and PADPAR (+2%) were above average. The combined effect of the three weather parameters led to a 6% increase in estimated BIOMSS.
The national average VCIx was 0.94. CALF (97%) was above 5% compared to its five-year average. CPI was 1.23. The NDVI departure cluster profiles indicate that: (1) 24.4% of arable land experienced above-average crop conditions, mainly in Sardegna, Piemonte, Sicily and Apulia. (2) 19.0% of arable land experienced slightly below-average crop conditions, mainly in Lombardia, Toscana, Marche and Sicily. (3) 11.7% of arable land, mainly in Ancona, Pesaro, Arezzo and Parma, was slightly below average from October to the middle of November. However, in early December, NDVI rose above average. The drop from mid-December to early January can most likely be attributed to cloud cover in the satellite images. Starting from mid-January NDVI was again above average. (4) 42% of arable land was hovering around average in October and early November, and above average from mid-November to January. CropWatch estimates that crop conditions were close to the average for this monitoring period.
Regional analysis
Based on cropping systems, climatic zones and topographic conditions, four sub-national regions can be distinguished for Italy. These four regions are East coast (108), Po Valley (105), Islands (107) and Western Italy (106).
On the East coast (108), rainfall was lower by 14%, while temperature and RADPAR were higher by 1.4°C and 7% respectively and potential biomass was 2% lower than the average of the last 15 years. Higher rainfall mainly occurred in November and mid-January, while the NDVI was below average from October to mid-November, and above average in late November and January. VCIx in the subregion reached 0.98. CPI was 1.57. CALF was 97%. It was 14% higher than the average of the last 5 years. In general, crop growth was fair.
In the Po Valley (105), rainfall and RADPAR were below average by 14% and 5%, while the temperature was higher (+2.4°C) and potential biomass was 20% higher than the average of the last 15 years. Higher rainfall mainly occurred in December and January. Whereas the NDVI was below average in October and late December, average from November to mid-December and above average in January. VCIx in the subregion reached 0.91. CPI was 1.18. CALF experienced a 6% increase compared to the 5YA. Overall, agronomic conditions were near average.
Compared to the average of the last 15 years, rainfall on the Islands (107) was lower by 18%, and temperature and RADPAR were higher by 1.7°C and 6%, respectively. Lower precipitation during the growing season negatively impacted the crops. It resulted in a 10% decrease in BIOMSS. NDVI was below average in October and November, and above average in December and January. VCIx in the subregion reached 0.95. CPI was 1.20. CALF was 100%. During this monitoring period, agronomic conditions were below but close to the average for the islands.
In Western Italy (106), rainfall was lower by 3%, while temperature and RADPAR were higher by 2.1°C and 5% respectively and potential biomass was 7% higher than the average of the last 15 years. Higher rainfall mainly occurred in early December and late December, while the NDVI was above average in early October, mid-November, and early January, below but close to average in the rest of the monitoring period. VCIx in the subregion reached 0.93. CPI was 1.20. CALF was 100%. Overall, agronomic conditions were close to average in this area.
Figure 3.24 Italy’s crop condition, October 2022-January 2023
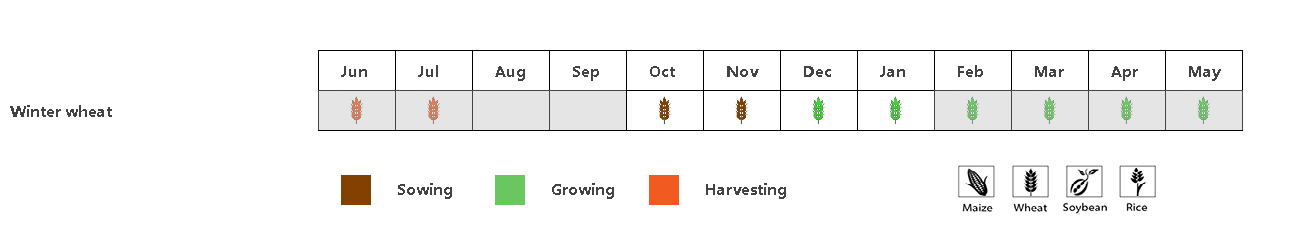
(a). Phenology of major crops
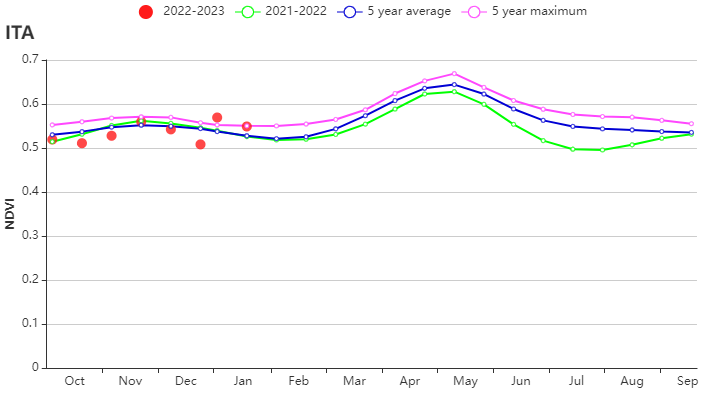
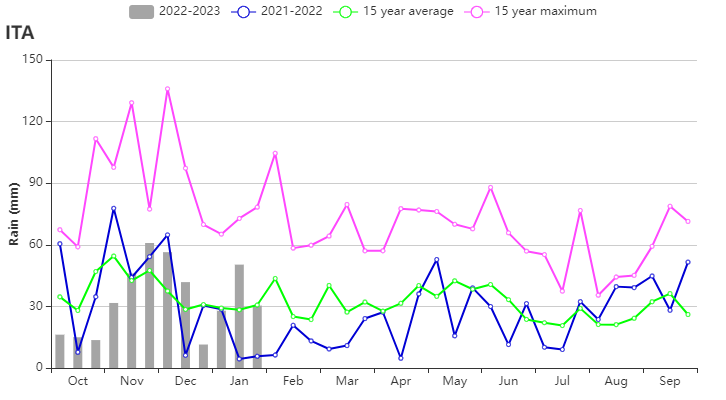
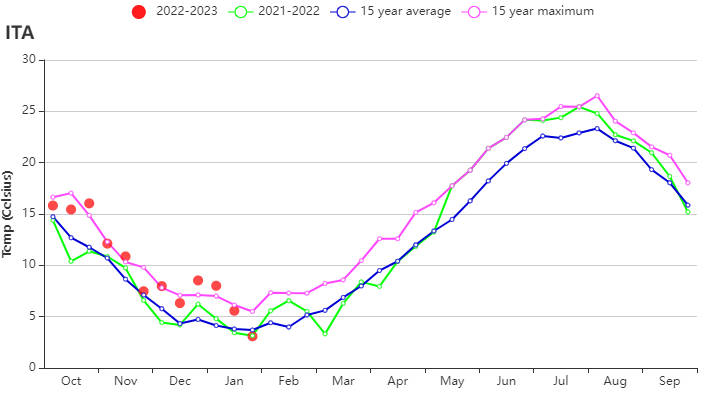
(b) Crop condition development graph based on NDVI, RAIN and TEMP (Italy).
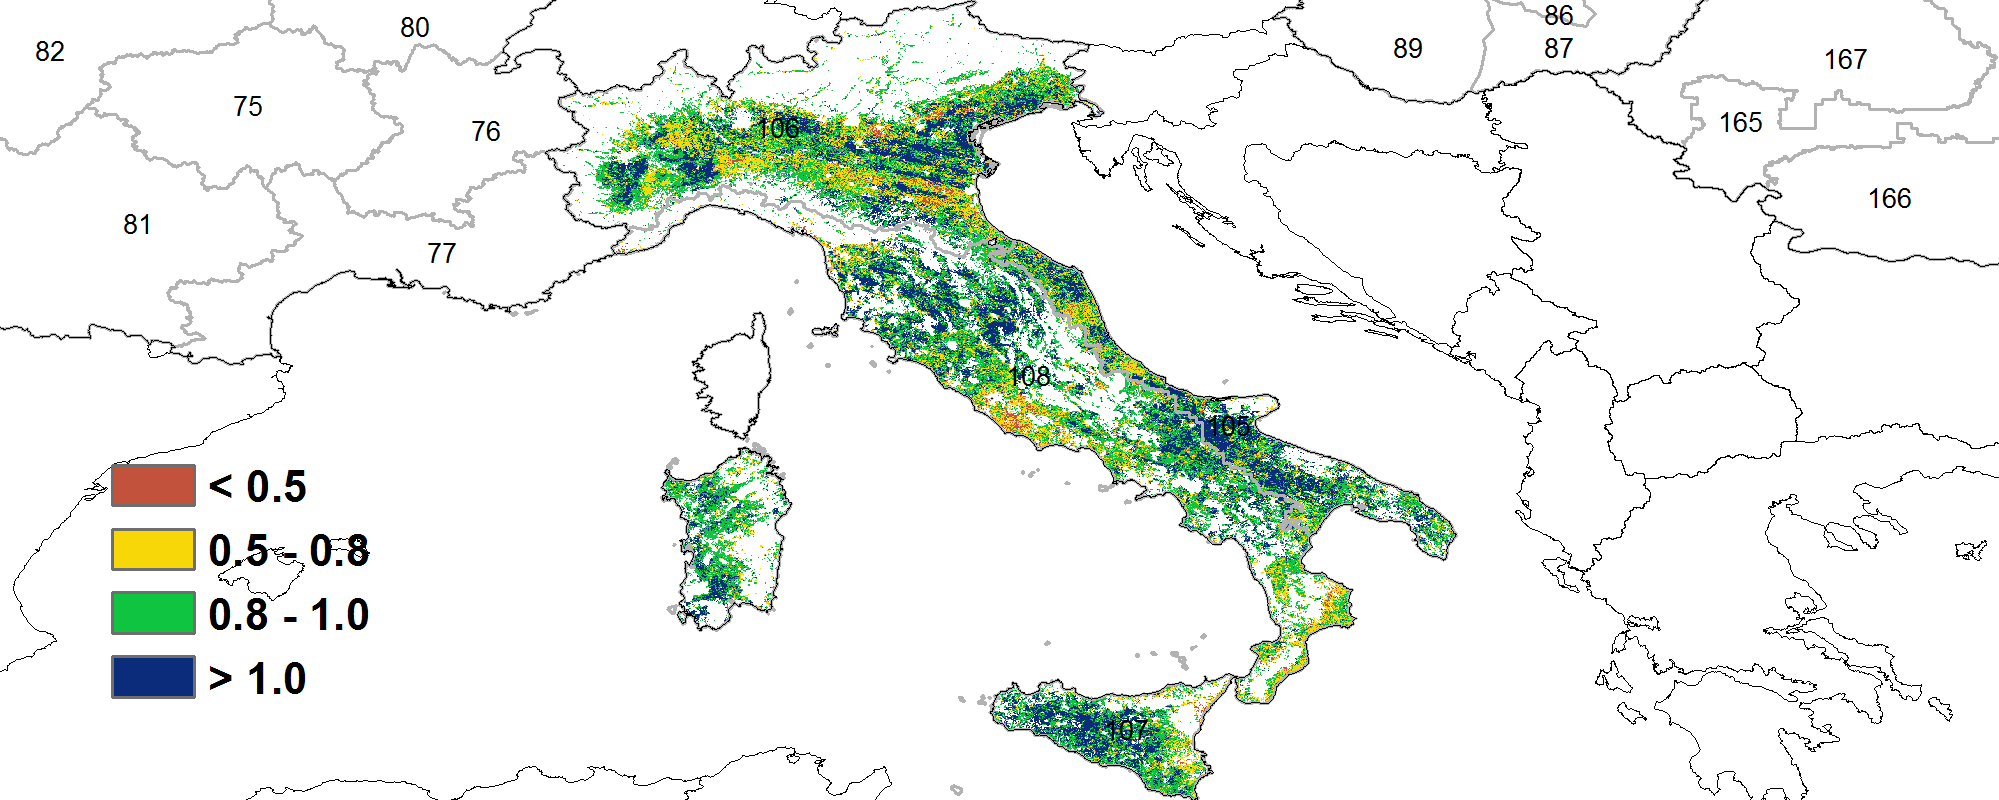
(c) Maximum VCI
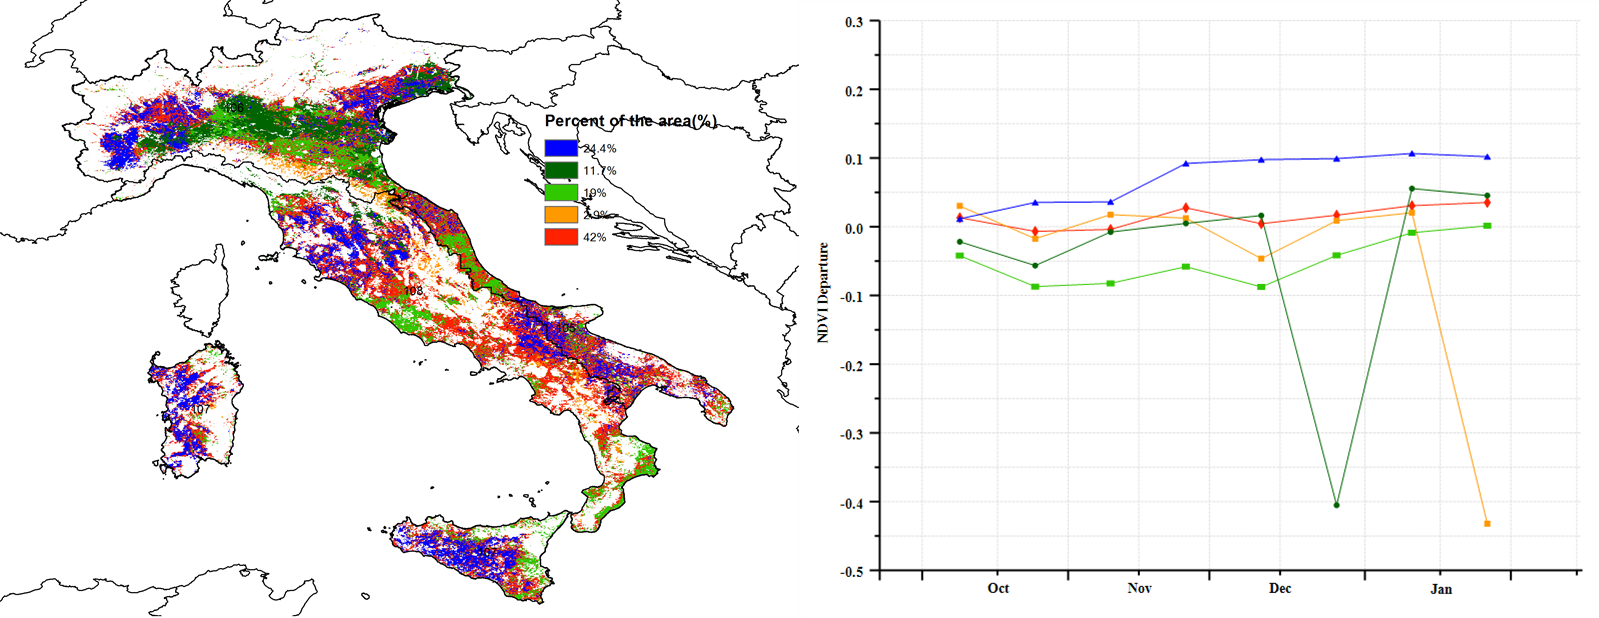
(d)Spatial distribution of NDVI profiles.
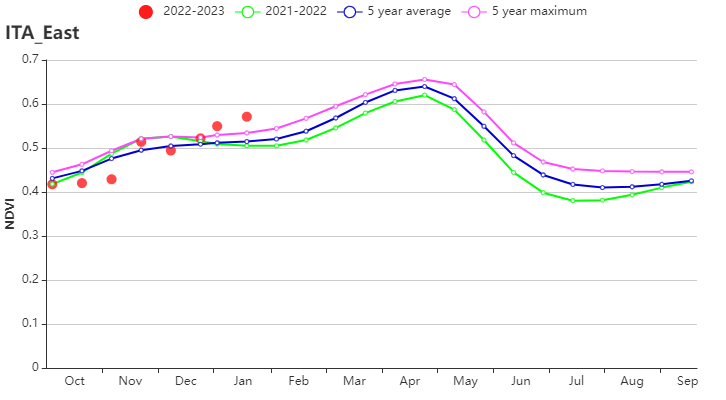
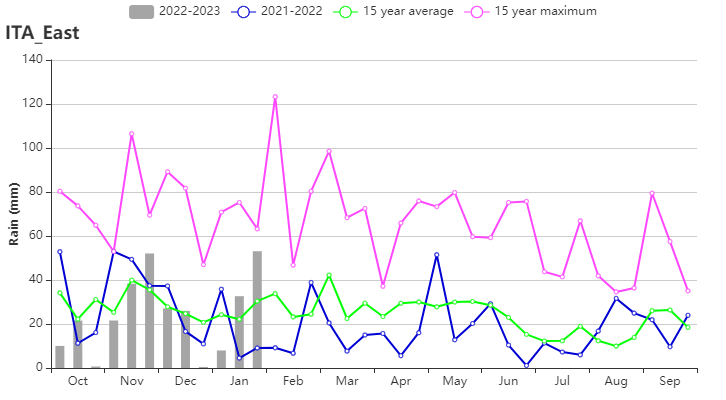
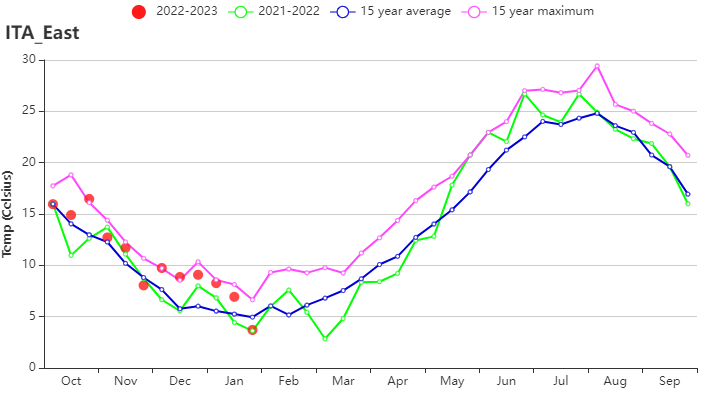
(e) Crop condition development graph based on NDVI, RAIN and TEMP (East Italy).
(f) Crop condition development graph based on NDVI, RAIN and TEMP (Po Valley).
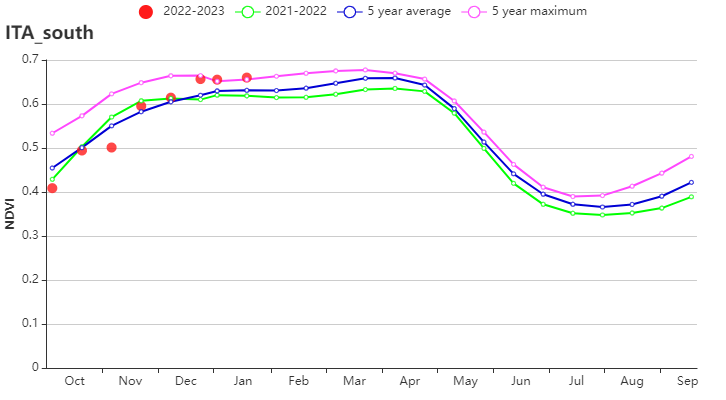
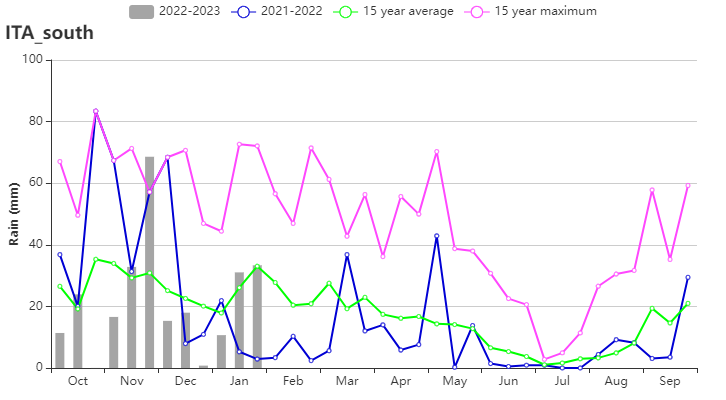
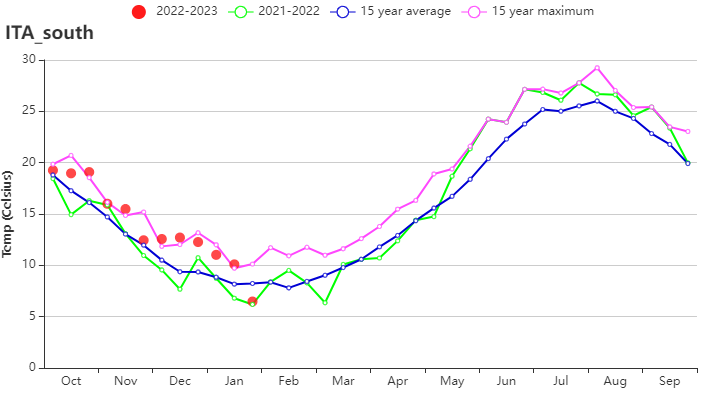
(g) Crop condition development graph based on NDVI, RAIN and TEMP (Islands).
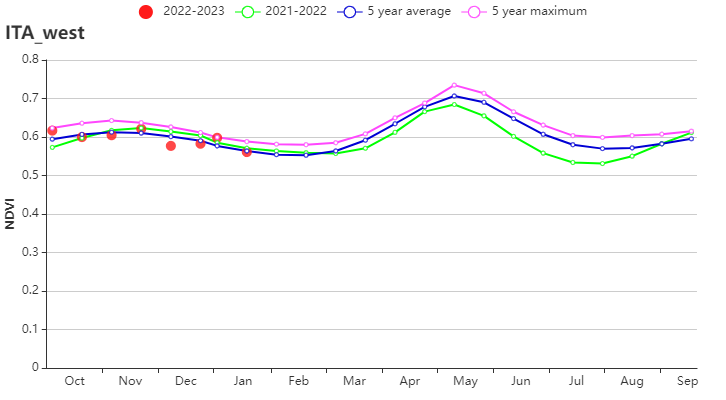
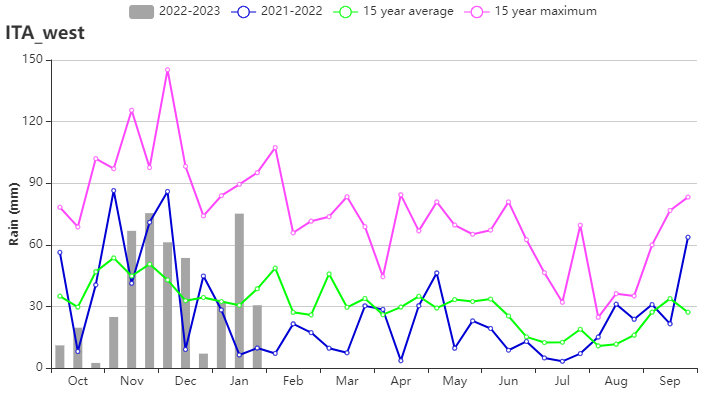
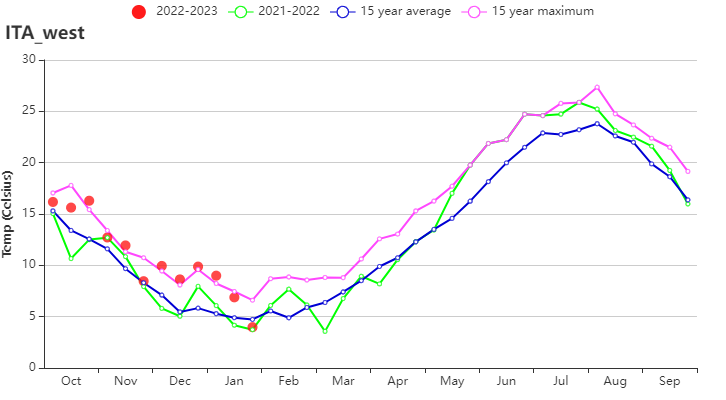
(h) Crop condition development graph based on NDVI, RAIN and TEMP (West Italy).
Table 3.45 Italy’s agroclimatic indicators by sub-national regions, current season’s values and departure from 15YA, October 2022-January 2023
Region | RAIN | TEMP | RADPAR | BIOMSS | |||||
Current (mm) | Departure (%) | Current (°C) | Departure (°C) | Current (MJ/m2) | Departure (%) | Current (gDM/m2) | Departure (%) | ||
East coast | 291 | -14 | 10.5 | 1.4 | 510 | 7 | 583 | -2 | |
Po Valley | 409 | -14 | 7.1 | 2.4 | 373 | -5 | 576 | 20 | |
Islands | 262 | -18 | 13.9 | 1.7 | 615 | 6 | 590 | -10 | |
Western Italy | 460 | -3 | 10.8 | 2.1 | 489 | 5 | 707 | 7 | |
Table 3.46 Italy’s agronomic indicators by sub-national regions, current season’s values and departure from 5YA, October 2022-January 2023
Region | Cropped arable land fraction | Maximum VCI | |
Current (%) | Departure (%) | Current (%) | |
East coast | 97 | 14 | 0.98 |
Po Valley | 94 | 6 | 0.91 |
Islands | 100 | 2 | 0.95 |
Western Italy | 100 | 2 | 0.93 |