During the reporting period of October 2022 to January 2023, CropWatch focused on changes in agro-climatic and agronomic information in the winter wheat producing zones. Winter wheat was predominantly sown in September and October. In the colder regions, such as in Kansas, wheat usually goes dormant in December, whereas in Texas, it stays green. Overall, crop conditions for the winter crop were below average.
The US experienced a relatively warm winter with above-average temperatures (TEMP +0.5°C), close to average RAIN (+1%) and RADPAR(-2%), resulting in 6% above 15YA potential biomass. This monitoring period covers the early growing stage of winter crops, which was accompanied by low temperatures, resulting in a low demand for water by crops. The above-average precipitation was recorded after the sowing of winter crops, which could create a good environment for the germination and establishment of the winter crops.
The marked heterogeneity of agro-climatic conditions and phenology led to significant differences in crop growing conditions between regions. In the national scale, the NDVI profile shows below average crop conditions. The VCIx of 0.75 was close to average. The strong heterogeneity of crop conditions was captured by NDVI deviation clusters. Below average crop condition occurred in the Northwest and at the northern half of the Southern Plains, while average crop conditions occurred in California and in the southern half of the Southern Plains. If the favorable moisture conditions prevail, above-average yield could be expected in California.
The overall crop production index (0.95) indicates below-average crop conditions. In summary, winter crop conditions were below average during this reporting period. In the next monitoring period, the winter crop will enter the jointing, heading, and flowering stages in the Southern Plain and Northwest regions, and the water demand will significantly increase.
Figure 3.44 United States crop condition, October 2022-January 2023

(a) Phenology of United States from October 2022 to January 2023
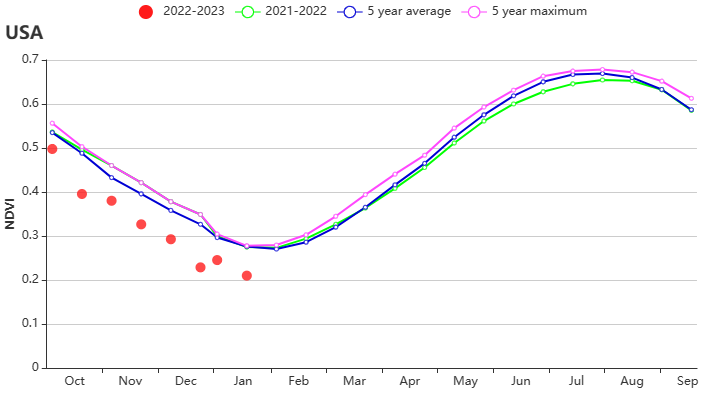
(b) Crop condition development graph based on NDVI
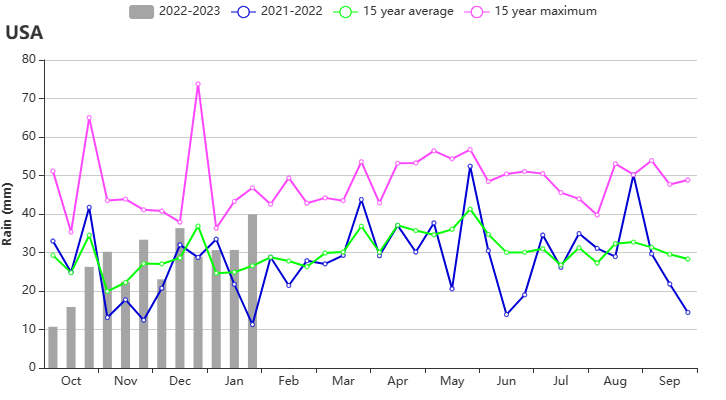
(c) Time series rainfall profile
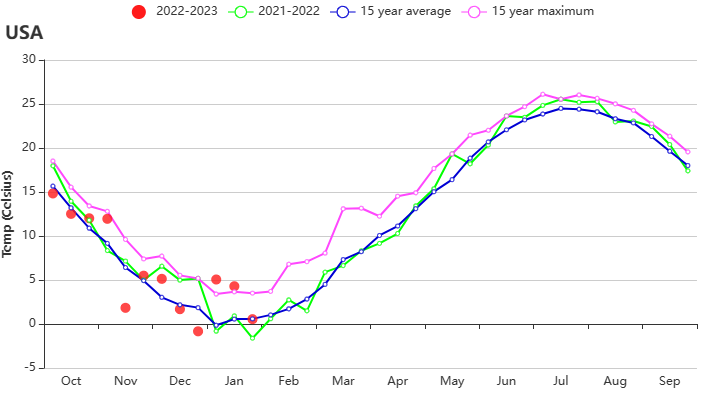
(d) Time series temperature profile
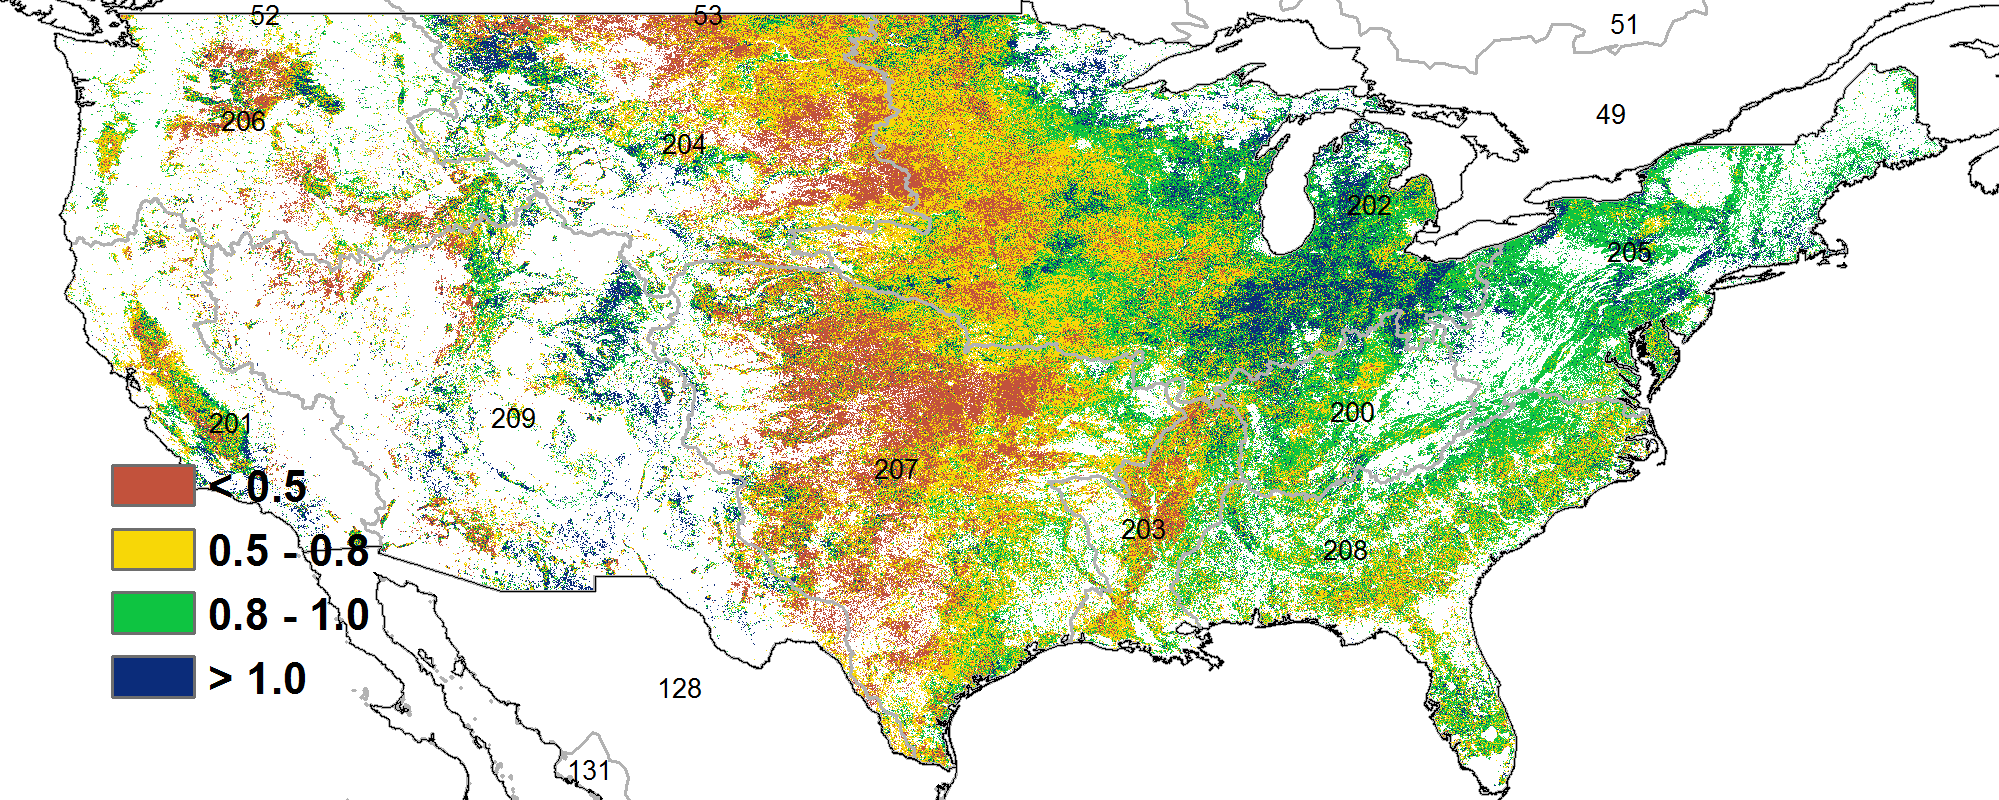
(e) Maximum VCI

(f) Spatial distribution of NDVI profiles
Regional Analysis
Southern Plain (207), Northwest (206), and California (201) are the major winter crops producing regions. The winter crops entered into the sowing, tillering and overwintering stages in the Southern Plain and Northwest. The winter crops in California entered into jointing and heading stage.
(1) California (201)
California is the most important region for fruit and vegetable production in the USA, and it is also a major producer of winter wheat. According to the NDVI profile, the crop condition was close to average at the end of January. The region has a Mediterranean climate with wet and warm winters, and during the reporting period, wet weather dominated in California with significantly above average rainfall (+49%), below average temperature (-0.8°C), and below average RADPAR (-4%). The significantly above average precipitation has provided abundant soil moisture for crop growth, resulting in an increase in potential biomass (+19%). The cropped arable land fraction (CALF, +7%) was above average. The VCIx reached 0.75, which is close to the average. The favorable soil moisture conditions are expected to result in above average yield levels.
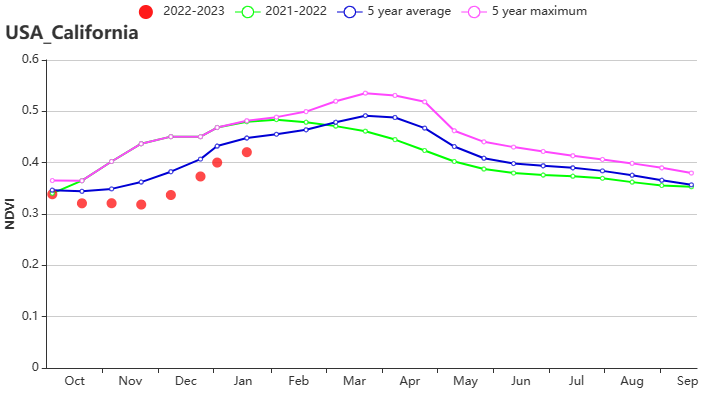
(g) Crop condition development graph based on NDVI
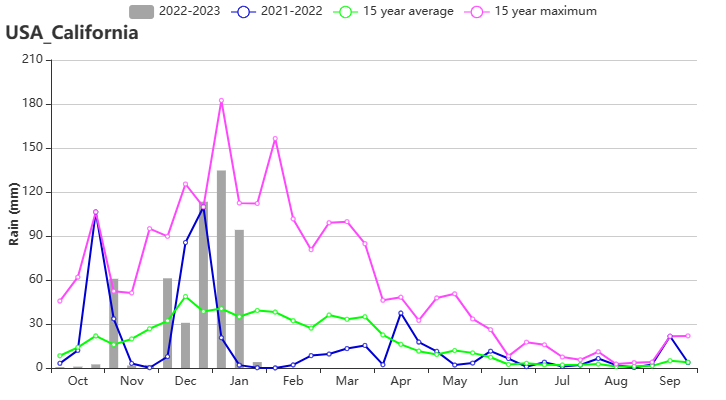
(h) Time series rainfall profile
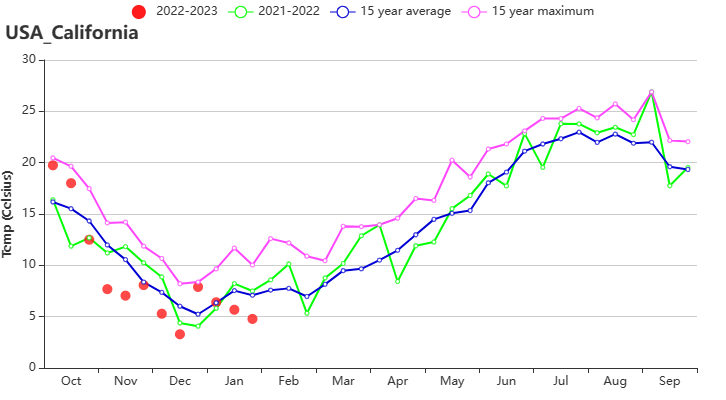
(i) Time series temperature profile
(2) Northwest (206)
The Northwest is another significant winter wheat growing region. It covers the states of Washington and Oregon. The NDVI profile indicated poor crop conditions in this region. The Northwest has
experienced relatively dry weather with below-average precipitation
(-11%), temperature (-0.5℃), and RADPAR (+4%), resulting in average
potential biomass (0%). Rainfall was unevenly distributed. Nevertheless, total precipitation (400 mm) was sufficient to ensure a good establishment of winter wheat. CALF is close to the
average (-1%), and VCIx was (0.7). Conditions for winter wheat can be assessed as normal.
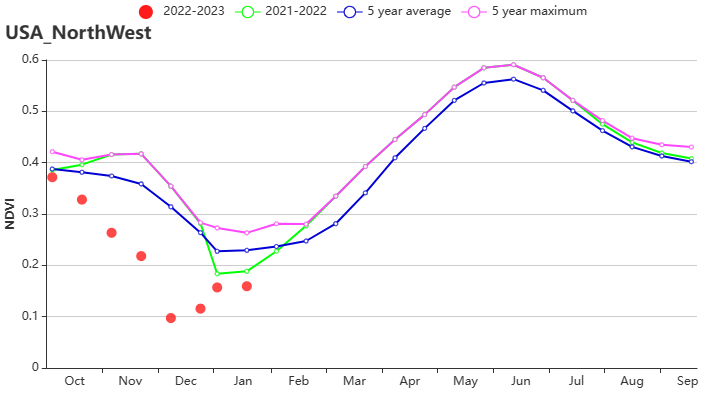
(j) Crop condition development graph based on NDVI
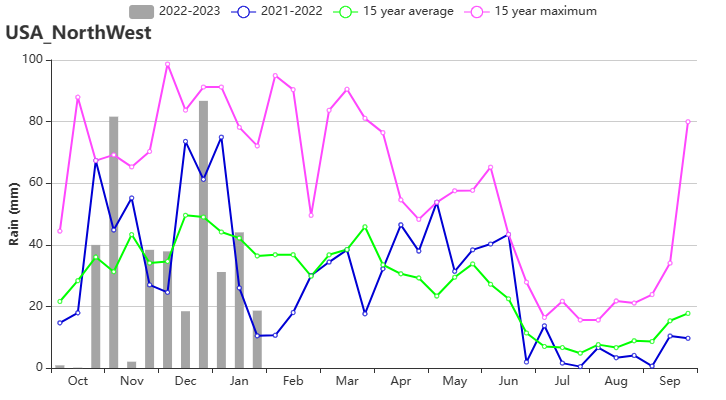
(k) Time series rainfall profile
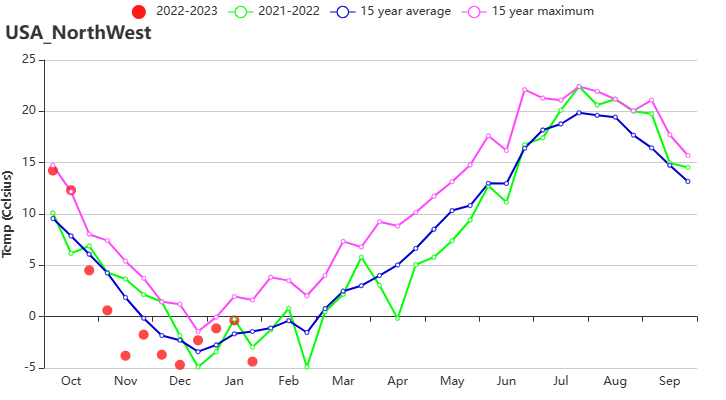
(l) Time series temperature pofile
(3) Southern Plains (207)
The Southern Plains is the most important winter wheat producing region in the United States, including the states of Kansas, Oklahoma, and Texas. On average, the Southern Plains experienced wet and warm weather, characterized by above average rainfall (+8%) and temperature (0.4℃), and low RADPAR (-5%), resulting in above average biomass (+5%). However, as mentioned above, within the Southern Plains, the conditions varied greatly: Dry weather was observed for Kansas, the most important winter wheat producing state, with below average precipitation (-13%) and above average temperatures (0.2℃). Oklahoma has experienced agri-climatic conditions close to average, while more favorable weather conditions occurred in Texas. For the entire AEZ, below average CALF (-21%), low VCIx (0.60), and CPI (0.61) were observed. However, crop conditions in the northern part were less favorable than in Texas, where conditions were average.
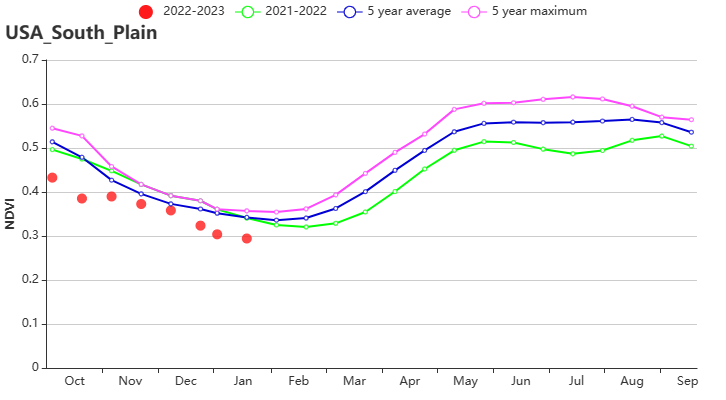
(m) Crop condition development graph based on NDVI
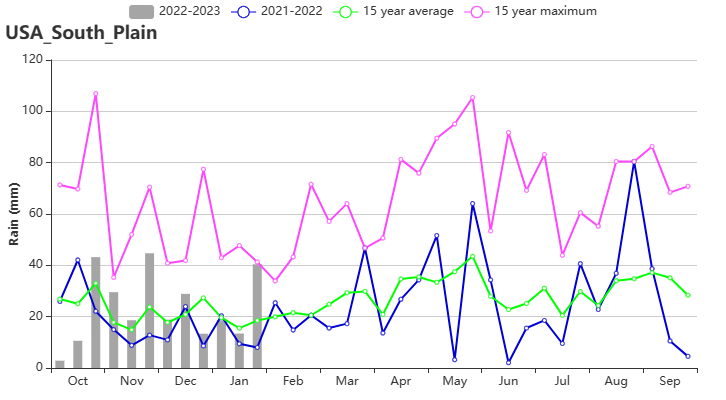
(n) Time series rainfall profile
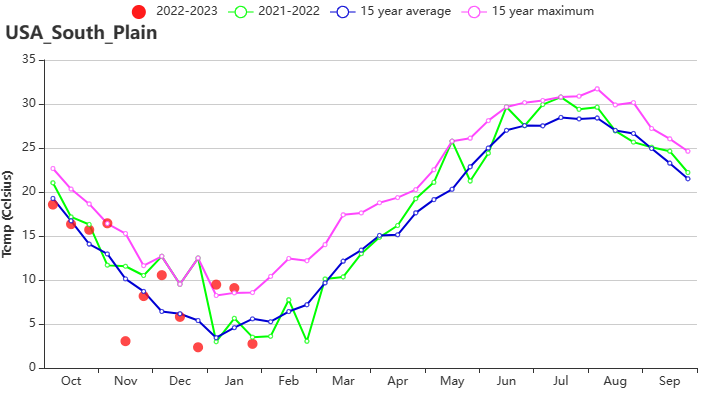
(o) Time series temperature profile
Table 3.80 United States' agroclimatic indicators by sub-national regions, current season's values and departure from 15YA, October 2022-January 2023
Region | RAIN | TEMP | RADPAR | BIOMASS | ||||
Current (mm) | Departure (%) | Current (°C) | Departure (°C) | Current (MJ/m2) | Departure (%) | Current (gDM/m2) | Departure (%) | |
Corn Belt | 255 | -12 | 2.2 | 0.7 | 447 | 0 | 445 | 6 |
Lower Mississippi | 555 | 16 | 12.4 | 1.1 | 603 | -4 | 859 | 10 |
Northern Plains | 163 | 4 | -1.6 | -0.8 | 470 | -1 | 320 | 1 |
North-eastern areas | 412 | 2 | 4.7 | 1.4 | 442 | -1 | 530 | 9 |
Northwest | 400 | -11 | 0.8 | -0.5 | 420 | 4 | 394 | 0 |
Southern Plains | 283 | 8 | 9.9 | 0.4 | 635 | -5 | 510 | 5 |
Southeast | 363 | -8 | 13.4 | 1.1 | 659 | -2 | 727 | 0 |
Southwest | 190 | 22 | 4.4 | -0.6 | 705 | -5 | 368 | 8 |
Blue Grass region | 433 | -2 | 7.5 | 0.7 | 547 | -1 | 668 | 5 |
California | 507 | 49 | 8.9 | -0.8 | 620 | -4 | 570 | 19 |
Table 3.81 United States’agronomic indicators by sub-national regions, current season's values and departure, October 2022-January 2023
Region | Cropped arable land fraction | Maximum VCI | |
Current (%) | Departure (%) | Current | |
Corn Belt | 78 | -2 | 0.80 |
Lower Mississippi | 81 | -10 | 0.69 |
Northern Plains | 15 | -43 | 0.66 |
North-eastern areas | 100 | 0 | 0.93 |
Northwest | 41 | -1 | 0.70 |
Southern Plains | 53 | -21 | 0.60 |
Southeast | 100 | 0 | 0.81 |
Southwest | 29 | 23 | 0.81 |
Blue Grass region | 99 | 0 | 0.86 |
California | 68 | 7 | 0.75 |
