Apart from legumes, barley and wheat are the main crops in Syria. Planting of the cereals starts in November, as soon as soil moisture conditions become favorable. The proportion of irrigated cropland in Syria is about 44%. Cereal production depends on sufficient rainfall.
Compared to the 15-year average, accumulated rainfall was far less than average (RAIN, -54%), while radiation was above average (RADPAR, +4%). The temperature was above average (TEMP, +1.2°C). The average temperature value for the reporting period was 13.9°C. The precipitation was generally below average except in late Nov and late Dec. The temperature was generally above average. It is notable that temperatures rose above 20°C in late October and remained above average throughout this monitoring period. The drought conditions resulted in a decrease of estimated BIOMSS by 29%. According to the NDVI profiles, the national average NDVI values were far below the 5YA during the sowing period of barley and wheat. The national average VCIx was 0.45 and CALF was below average by 23%. Conditions for cereal production in Syria were poor due to the ongoing (CPI=0.80, significantly lower than 1.0), multiyear drought. However, they were slightly better than last year (CPI=0.54).
Regional analysis:
Based on cropping systems, climatic zones and topographic conditions, five sub-national agro-ecological regions can be distinguished for Syria, among which three are relevant for crop cultivation: The first (a) (220) and first (b) region (221), the second region (222), the third (223) and the fourth region (219).
In the first two regions (a and b), the accumulated precipitation was below average, and the temperature was almost close to average, also the RADPAR was close to average. The hot and dry weather resulted in a decrease of BIOMSS by 28% to 32%. The national average VCIx values were not higher than 0.81 for the two regions. Compared to the other regions, the higher CALF values indicated more agricultural activities in this region, they were above their 5YA by 4% and 2% respectively. According to NDVI profiles of the two regions, crop conditions were mostly below the 5YA. But they surpassed it by the end of this monitoring period (Jan) for b zone. The severe drought limited crop growth. The conditions for barley and wheat sowing and growing were not favorable.
Agro-climatic conditions in the second, third and fourth region were also unfavorable. The rainfall was below average by more than 56%, whereas the temperature and RADPAR were above average. The low rainfall led to a decrease of potential biomass by at least 30%. The CALF values in the three regions decreased significantly by more than 26%. The average VCIx value in the second region, the third region and the fourth region was 0.36, 0.31 and 0.30. According to NDVI profiles of three regions, crop conditions were below the 5YA, particularly from Nov to Jan. Due to the severe rainfall deficit and high temperature in the main sowing period, the growth of wheat and barley in the second region are estimated to be below average, and the conditions for barley grown in the third and fourth region were not favorable either.
Figure 3.40 Syria's crop condition, October 2022 - January 2023
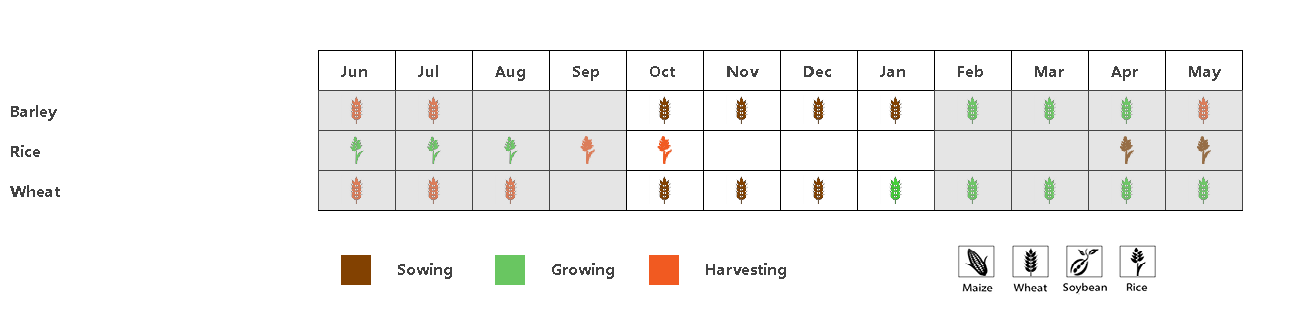
(a) Phenology of major crops
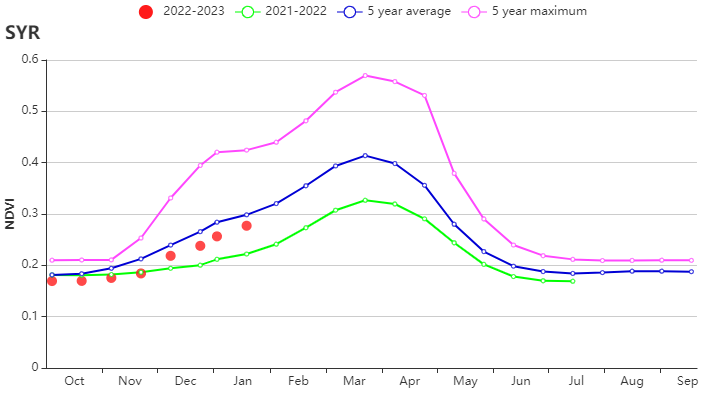
(b) Crop condition development graph based on NDVI
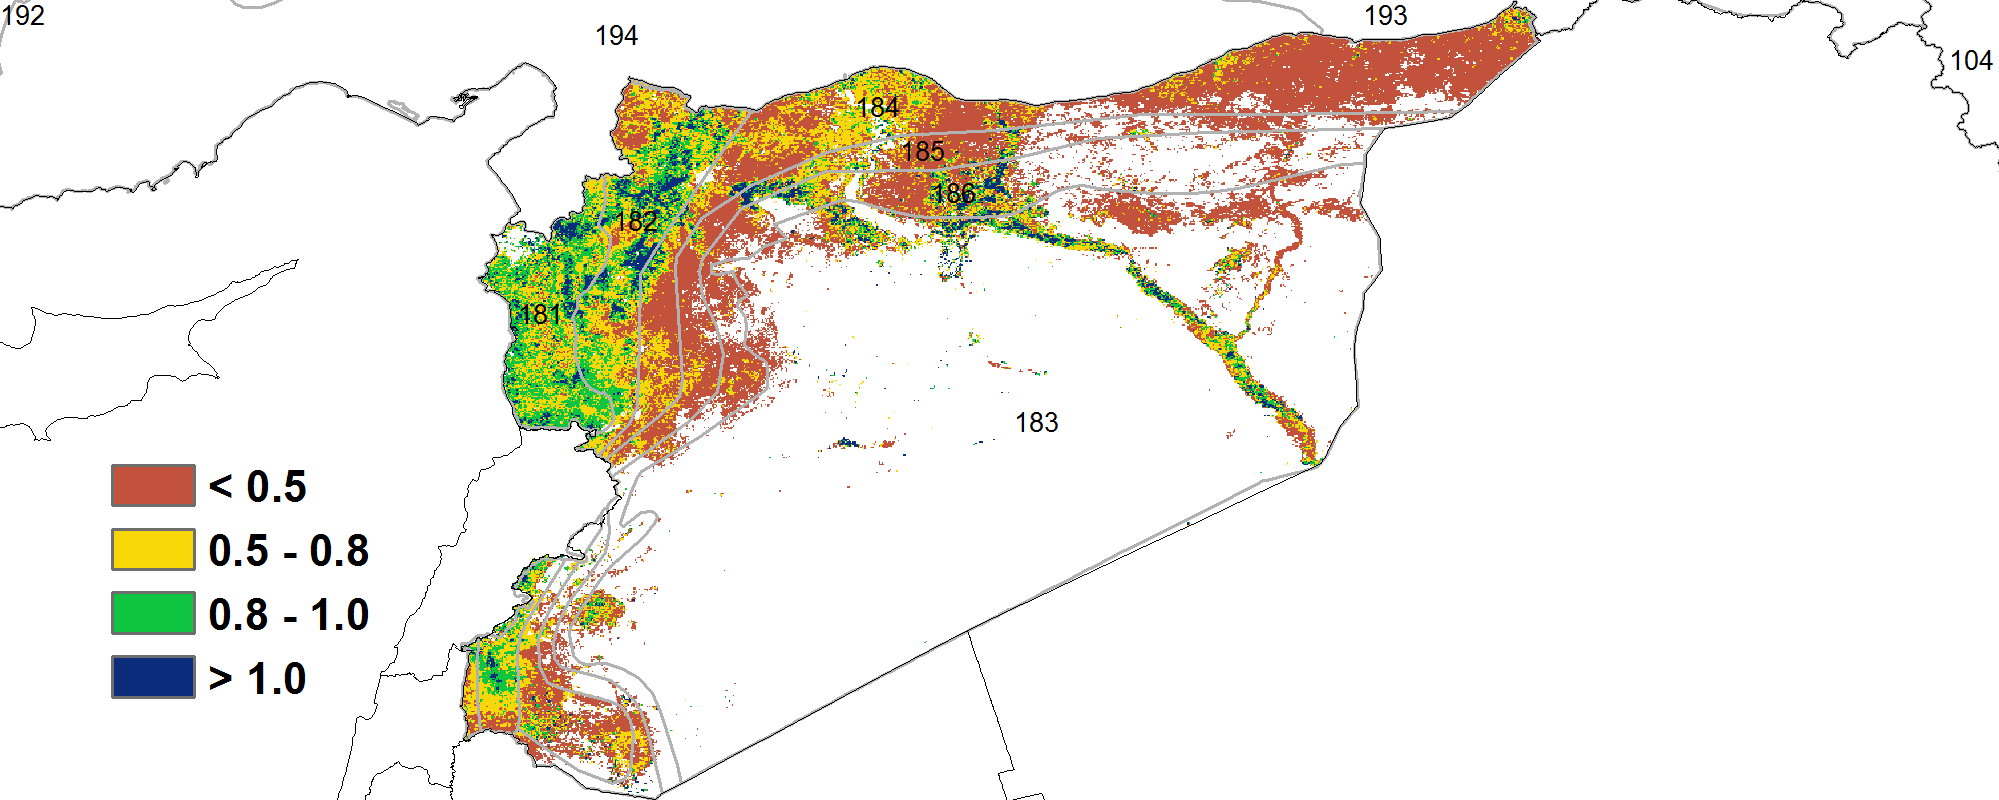
(c) Maximum VCI
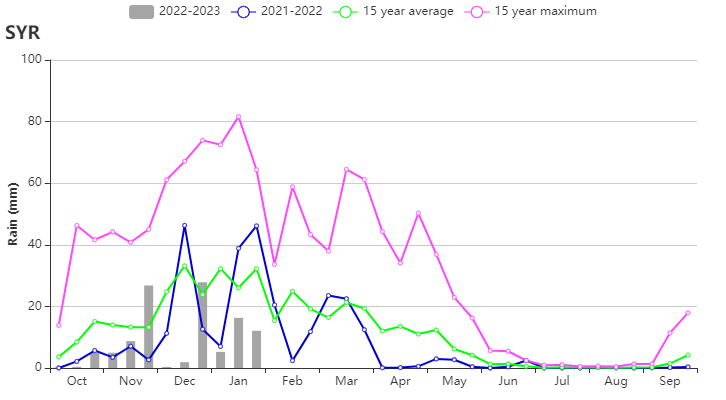
(d) Rainfall profiles
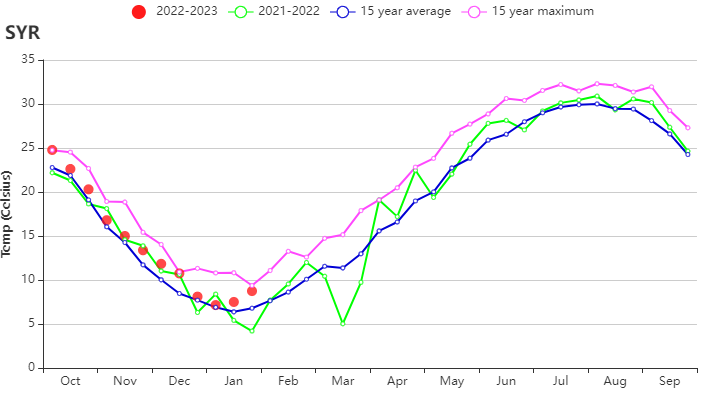
(e) Temperature profiles
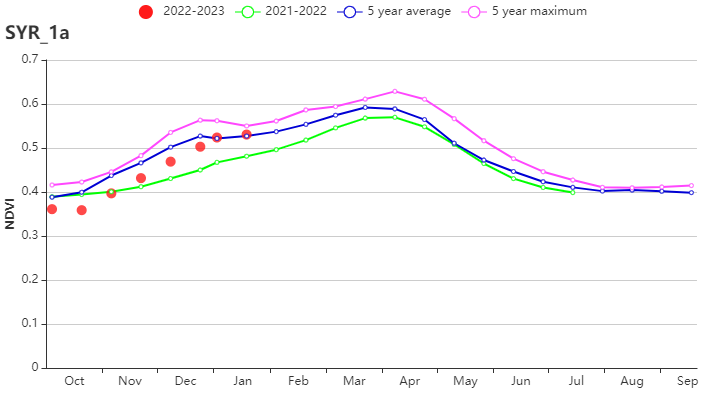
(f) Crop condition development graph based on NDVI (The first(a) region)
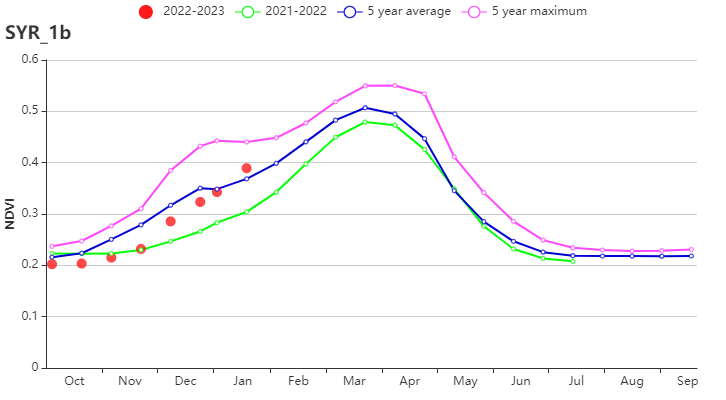
(g) Crop condition development graph based on NDVI (The first (b) region)
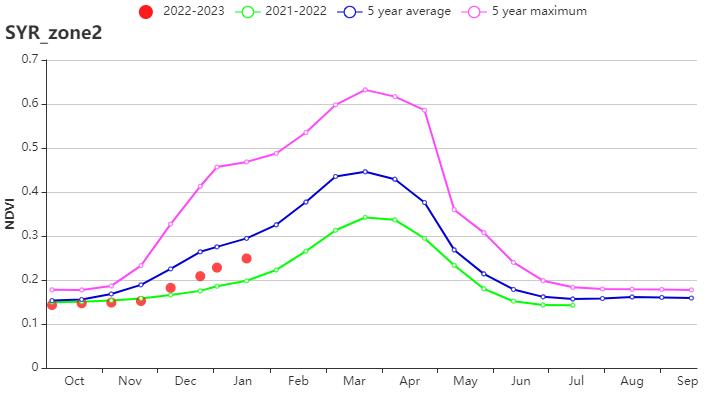
(h) Crop condition development graph based on NDVI (The second region)
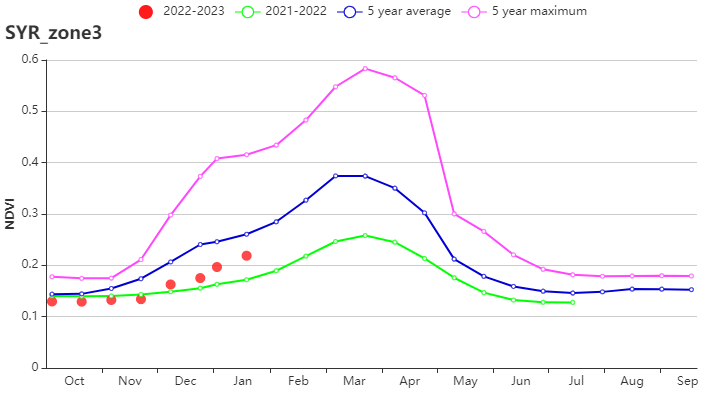
(i) Crop condition development graph based on NDVI (The third region)
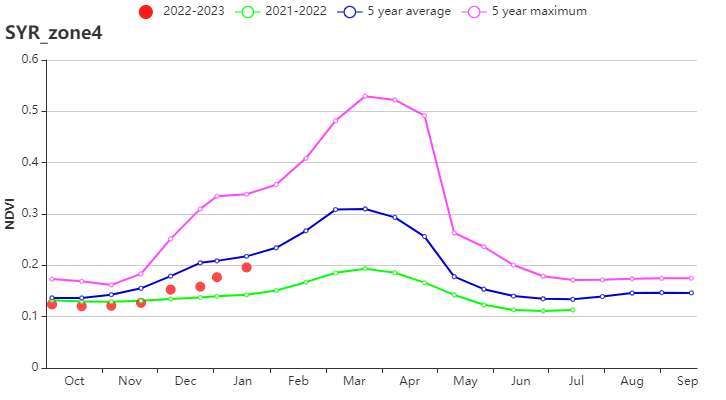
(j) Crop condition development graph based on NDVI (The fourth region)
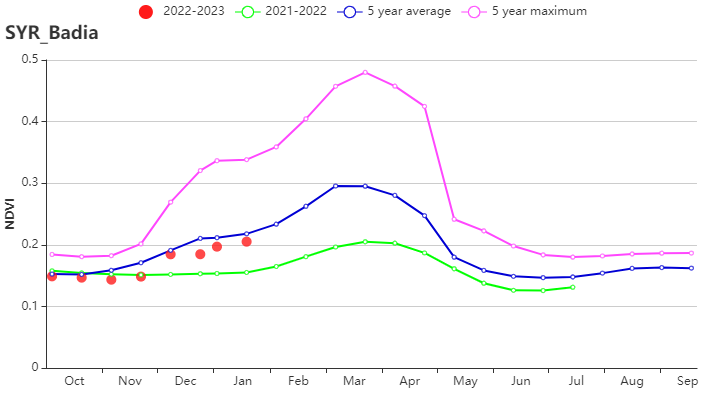
(k) Crop condition development graph based on NDVI (Badia region)
![]()
Table 3.72 Syria agroclimatic indicators by sub-national regions, current season's values and departure from 15YA, October 2022-January 2023
| RAIN | TEMP | RADPAR | BIOMASS | |||||
| Region | Current (mm) | Departure (%) | Current (°C) | Departure (°C) | Current (MJ/m2) | Departure (%) | Current (gDM/m2) | Departure (%) |
| 1st agro-ecological a | 183 | -53 | 15 | 0 | 732 | 4 | 498 | -28 |
| 1st agro-ecological b | 145 | -59 | 13 | 1 | 722 | 6 | 417 | -32 |
| Badia | 64 | -53 | 14 | 1 | 724 | 2 | 283 | -28 |
| 2nd agro-ecological | 107 | -53 | 14 | 2 | 702 | 5 | 349 | -30 |
| 3rd agro-ecological | 88 | -56 | 13 | 1 | 725 | 5 | 322 | -33 |
| 4th agro-ecological zone | 78 | -56 | 14 | 1 | 719 | 4 | 307 | -33 |
Table 3.73 Syria agronomic indicators by sub-national regions, current season's values and departure, October 2022-January 2023
| Region | Cropped arable land fraction | Maximum VCI | |
| Current (%) | Departure (%) | Current | |
| 1st agro-ecological a | 89 | 4 | 0.81 |
| 1st agro-ecological b | 29 | 2 | 0.75 |
| Badia | 5 | -10 | 0.39 |
| 2nd agro-ecological | 2 | -84 | 0.36 |
| 3rd agro-ecological | 3 | -76 | 0.31 |
| 4th agro-ecological zone | 4 | -26 | 0.30 |