According to the Australian Government Bureau of Meteorology, the La Niña event in the tropical Pacific Ocean is ongoing, and while oceanic indicators like sea surface temperatures have weakened to ENSO-neutral values, the atmosphere remains La Niña-like. Despite the weakening, La Niña can continue to impact global weather and climate. Forecasts suggest that sea surface temperatures in the central Pacific Ocean will warm further, but remain at neutral levels until at least mid-autumn [1].
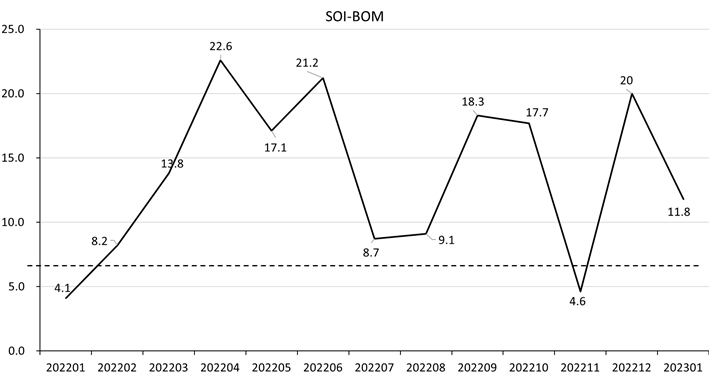
Figure 5.7 depicts the standard Southern Oscillation Index (SOI) behavior from January 2022 to January 2023. The SOI has been positive and high (greater than +7) for the past four months, with the exception of November 2022. However, there has been a recent weakening trend, with the SOI declining from 20 in 2022 to 11.8 in 2023. This suggests a weakening of La Niña's influence, despite its continued presence during the monitoring period.
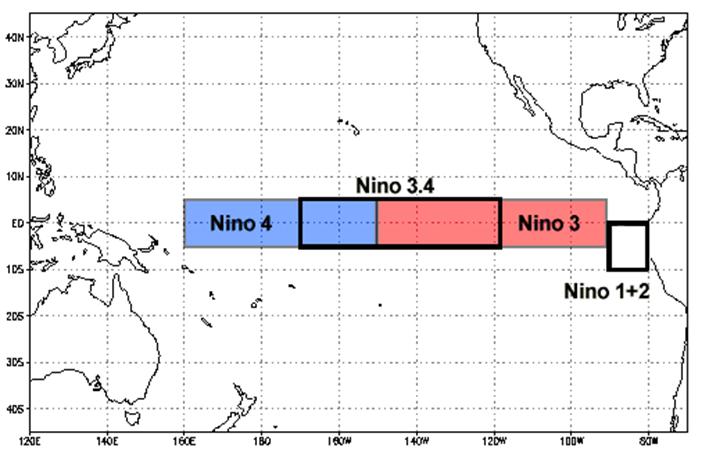
The Oceanic Niño Index (ONI) is another widely-used measure of El Niño. Figure 5.8 displays several ONIs and their respective locations. A quick analysis of Table 5.1 reveals that all three regions (NINO3, NINO3.4, and NINO4) had negative values throughout the four-month period, with the values for NINO3 and NINO3.4 regions consistently negative and of similar magnitude. The NINO4 region exhibited consistently negative values of less than -5°C, which is indicative of cooler-than-average sea surface temperatures and consistent with a La Niña event. It's worth noting that the negative values in the NINO indices suggest the persistence of La Niña conditions in the tropical Pacific Ocean during this period. However, the values for January 2023 were less negative than those of the previous three months, indicating a possible weakening or transition to neutral conditions.
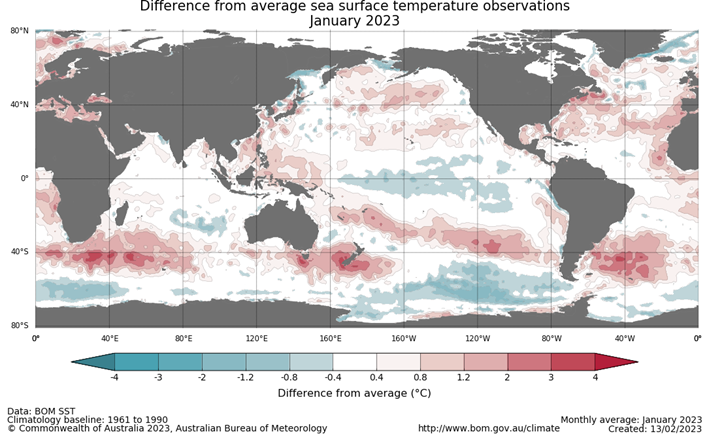
Sea surface temperature (SSTs) (Figure 5.9) for January 2023 were cooler than average across the central tropical Pacific Ocean, extending from around 170°E to around 100°W, although anomalies were generally less than 1 degree cooler than average. Warm anomalies up to 2 degrees above average were observed in a band across the South Pacific stretching from the South American coast around 40°S towards the Coral Sea, while weaker warm anomalies were present across much of the Maritime Continent. Warm SST anomalies also continue to the south of Australia, especially around Tasmania and in waters close to New Zealand.
La Niña has affected different regions in different ways, including more frequent and intense tropical cyclones in the western Pacific, increased rainfall in parts of Southeast Asia, Australia, and South America, drier conditions in parts of Indonesia, Malaysia, and the Philippines, and colder temperatures in some parts of North America. These effects are ongoing, but are expected to ease in the coming months.
East Africa
The Horn of Africa is currently facing its worst drought in over 40 years, with Ethiopia, Kenya, and Somalia experiencing persistent and widespread drought, particularly in the eastern coastal regions. The cause of this drought can be attributed to the jet stream, which is diverting moisture away from the region to areas with lower atmospheric pressure. Unfortunately, the drought is ongoing and is expected to likely continue through the summer of 2023. Urgent humanitarian aid is required on the ground to address the situation [2].
South America
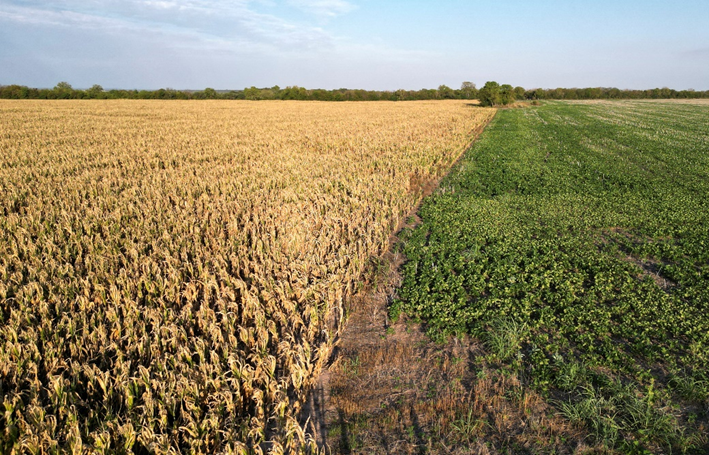
This current La Niña event has persisted for an unusually long period of time and is the primary cause of the devastating drought that has been impacting central South America. The region has been experiencing drought since 2019, with Uruguay declaring an agricultural emergency in October of last year. In addition, the central region of Argentina has experienced its driest year since 1960, resulting in widespread crop failures (figure 5.10). The southern region of Brazil, including Rio Grande do Sul, has also been affected by the drought.
In summary, La Niña has continued to prevail over the past four months, but has begun to weaken. The impacts of La Niña on global weather and climate are ongoing, but it is difficult to predict specific climate events or disasters that may occur in a particular location during a specific time frame.

Figure 5.7 Monthly SOI-BOM time series from January 2022 to January 2023
(Source: http://www.bom.gov.au/climate/enso/soi/)

Figure 5.8 Map of NINO Region
(Source: https://www.ncdc.noaa.gov/teleconnections/enso/sst)

Figure 5.9 Monthly temperature anomalies for January 2023
(Source: http://www.bom.gov.au/climate/enso/index.shtml#tabs=Pacific-Ocean)

5.10 A general view of a farm shows corn and cotton that was planted where corn was ruined by the weather, in Tostado, northern Santa Fe Argentina in February 8, 2023.
Table 5.1 Anomalies of ONIs (°C), October 2022 to January 2023
(Source: https://www.cpc.ncep.noaa.gov/data/indices/sstoi.indices)
Year | Month | NINO3 | NINO3.4 | NINO4 |
2022 | 10 | -0.92 | -0.85 | -1.08 |
2022 | 11 | -0.89 | -0.93 | -0.90 |
2022 | 12 | -0.78 | -0.84 | -0.73 |
2023 | 1 | -0.50 | -0.69 | -0.60 |
Main Sources:
[1] http://www.bom.gov.au/climate/enso/index.shtml#tabs=Overview
[2] Home | Famine Early Warning Systems Network (fews.net)
