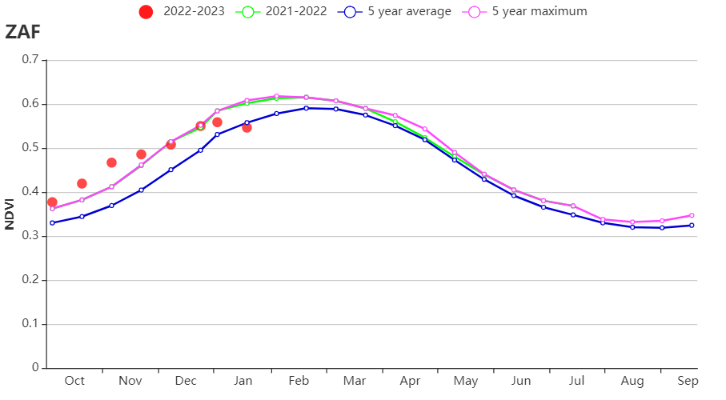
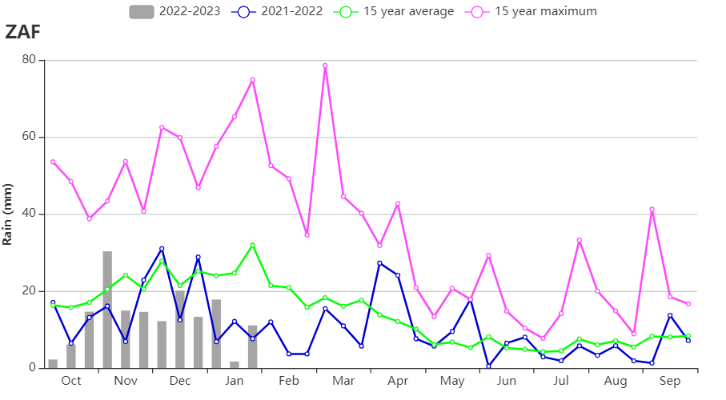
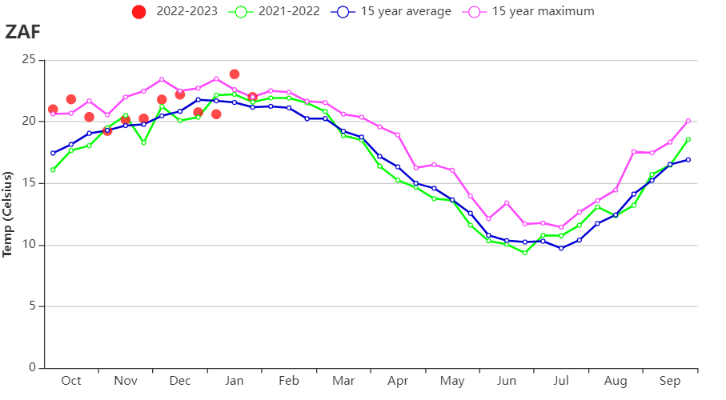
In South Africa, wheat is the main crop harvested during this monitoring period. Maize sowing started in October for the east and in December for the west. Soybean planting also started in October. Water is generally limiting crop production in South Africa. Its government has developed several large water facilities, which have increased the irrigated area of the country by 40%, and the yield of crops has generally increased in recent years. Based on the NDVI development graph, the crop conditions were near or above the 5-year max until the end of December. In January, they dropped to below-average conditions, due to the precipitation deficit. At the national level, the CropWatch agroclimatic indicators show that TEMP and RADPAR were above the 15-year average (+1.1°C, +2%). Due to a rainfall deficit (-41%), the BIOMSS decreased significantly by 15% compared to the 15-year average. The VCIx was 0.88. CALF increased significantly (+16%) compared with the last 5 years, indicating good progress with sowing and establishment of the new crops. As to the spatial distribution of NDVI profiles, crop conditions on about 86.9% of the cropland were close to and above average mainly in the central and eastern parts, and on about 13.1%, they were below average. The areas with negative departures were mainly in the western region, located in Gauteng, Mpumalanga, North West and Orange Free State Province. Overall, crop conditions in South Africa were generally favorable, but the rainfall deficit started to impact growth in January, when NDVI levels dropped to below-average levels.
Regional analysis
In the Arid and desert zones (221), RAIN (81 mm) was significantly below average (-36%) and RADPAR was slightly below average (-1%), whereas TEMP was above average (+1.3°C). BIOMSS decreased by 9% due to the low rainfall. CALF increased (+52%) and VCIx was 0.86. The crop condition development graph based on NDVI indicates that the crop conditions were generally above the 5-year average and even above the 5-year maximum in most months. Crop production is expected to be favorable.
In the Humid Cape Fold mountains (222), the TEMP (+1.3°C) and RADPAR (+4%) were above average. Due to insufficient rainfall (288 mm, -26%), BIOMSS was below the 15-year average (-9%). CALF was 97% and VCIx was 0.92. The crop condition development graph based on NDVI also indicates favorable crop conditions, but the large rainfall deficit started to impact growth in January, when NDVI levels dropped to below-average levels.
In the Mediterranean zone (223), the TEMP was close to average (0.7°C). Rainfall dropped to 73 mm (RAIN -40%) and RADPAR was as average. The BIOMSS was significantly decreased by 12% due to the insufficient rainfall. CALF decreased slightly (56%, -4%) and VCIx was 0.68. According to the crop condition development graph, the NDVI was below the 5-year average for most of the period, the CPI was 0.77, indicating that crop conditions were generally unfavorable.
In the Dry Highveld and Bushveld maize areas (224), RAIN (147 mm, -46%) was significantly below the 15-year average, whereas TEMP and RADPAR were above average (+1.1°C, +3%). The BIOMSS was decreased by 17% due to the insufficient rainfall. CALF increased significantly (95%, +19%) and VCIx was 0.90. The crop condition development graph based on NDVI shows that the NDVI was above the 5-year max for most of the period, and the CPI was 1.18. All in all, the crop conditions were favorable, but the large rainfall deficit started to impact growth in January, when NDVI levels dropped to below-average levels.
Figure 3.47 South Africa's crop condition, October 2022 - January 2023
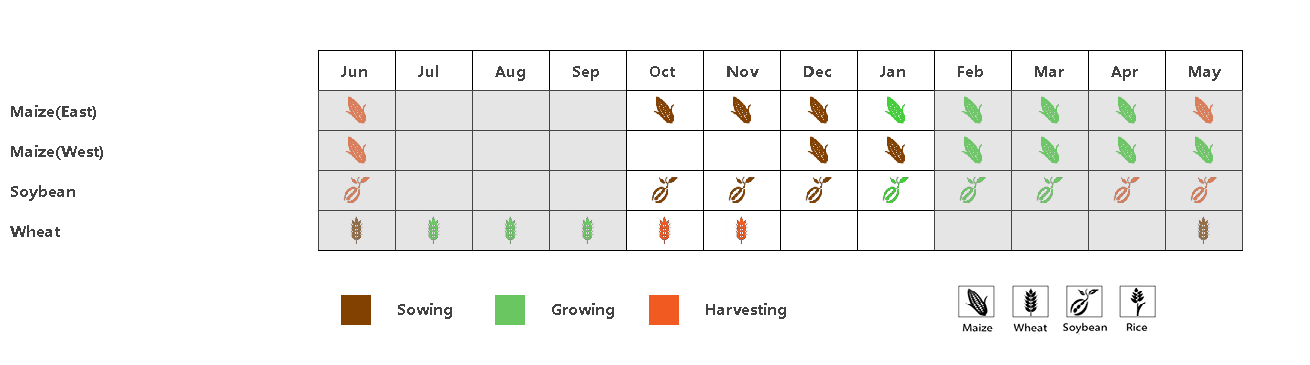
(a) Phenology of the main Crop
(b) Crop condition development graph based on NDVI

(c) Maximum VCI
(d) Rainfall index
(e) Temperature index
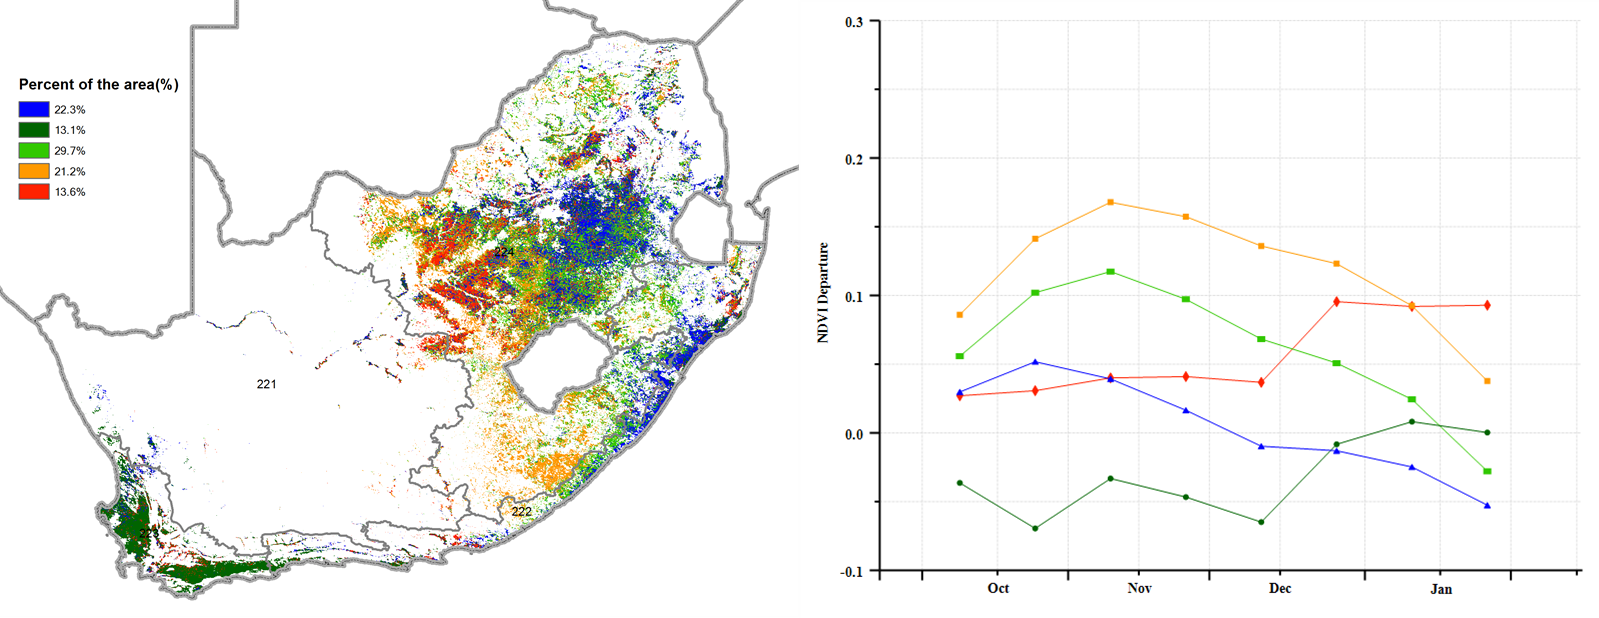
(f) Spatial NDVI patterns compared to 5YA (g) NDVI profiles
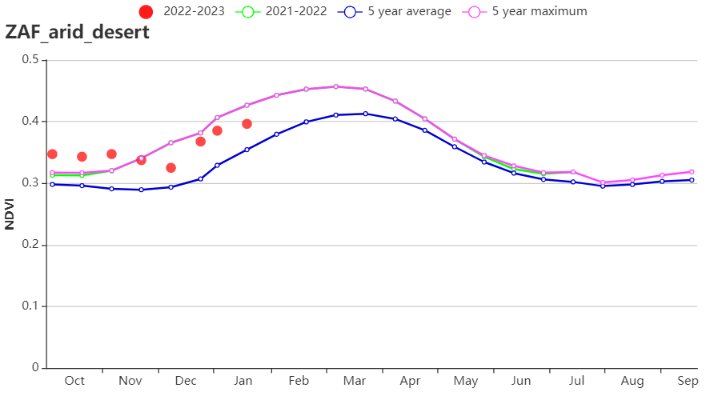
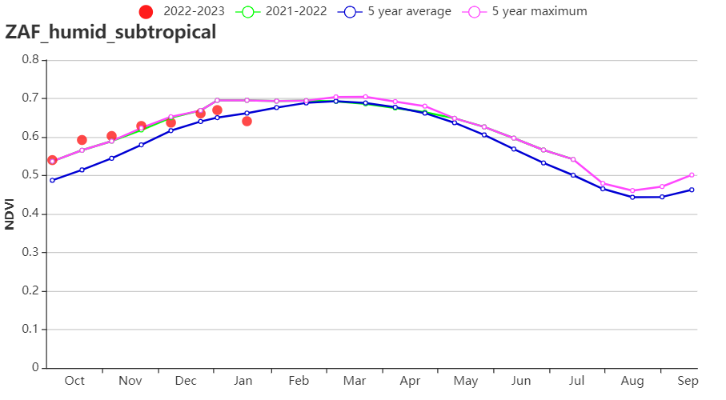
(h) Crop condition development graph based on NDVI Arid desert (left) and Humid sub-tropical (right)
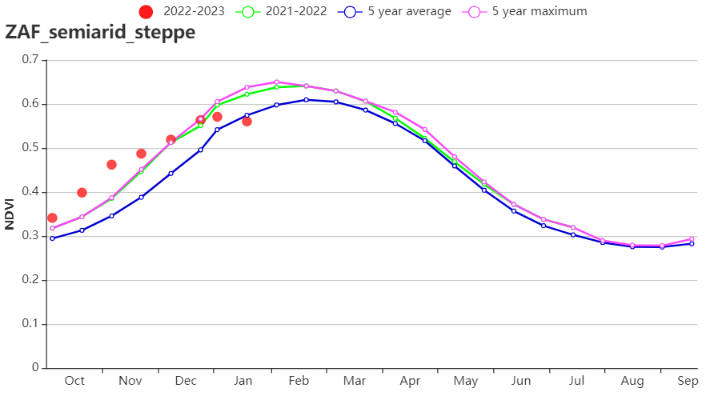
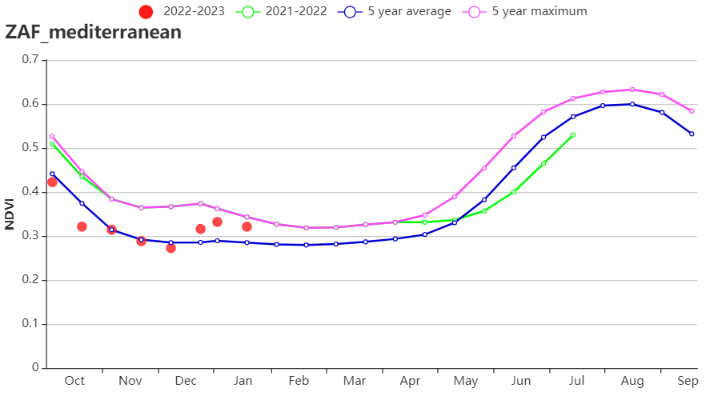
(i) Crop condition development graph based on NDVI semiarid steppe (left) and Mediterranean (right)
Table3.86 South Africa's agro-climatic indicators by sub‐national regions, current season's values and departure from 15YA, October 2022 - January 2023
| Region | RAIN | TEMP | RADPAR | BIOMSS | ||||
| Current(mm) | Departure from 15YA(%) | Current(°C) | Departure from 15YA(°C) | Current(MJ/m2) | Departure from 15YA(%) | Current(gDM/m2) | Departure from 15YA(%) | |
| Arid and desert zones | 81 | -36 | 21.8 | 1.3 | 1592 | -1 | 626 | -9 |
| Humid Cape Fold mountains | 288 | -26 | 20.5 | 1.3 | 1320 | 4 | 891 | -9 |
| Mediterranean zone | 73 | -40 | 19.0 | 0.7 | 1575 | 0 | 563 | -12 |
| Dry Highveld and Bushveld maize areas | 147 | -46 | 21.5 | 1.1 | 1511 | 3 | 728 | -17 |
Table3.87 South Africa's agronomic indicators by sub-national regions, current season's values and departures from 5YA, October 2022 - January 2023
| Region | CALF | Maximum VCI | |
| Current(%) | Departure from 5YA(%) | Current | |
| Arid and desert zones | 47 | 52 | 0.86 |
| Humid Cape Fold mountains | 97 | 3 | 0.92 |
| Mediterranean zone | 56 | -4 | 0.68 |
| Dry Highveld and Bushveld maize areas | 95 | 19 | 0.90 |