This monitoring period covers the harvest of the main rice crop as well as the planting of second season rice (dry season). According to the agroclimatic indicators, Thailand experienced wetter and cooler weather than usual in this monitoring period with above-average rainfall (RAIN +23%), slightly below average temperature (TEMP -0.3°C) and average radiation (RADPAR 0%). As a result of these indicators, a slight increase in crop biomass production potential was estimated (BIOMSS +3%). The ratio of irrigated cropland in Thailand is approximately 22.5%. It is located in the central region of Thailand. Therefore, rainfall is important for crop growth.
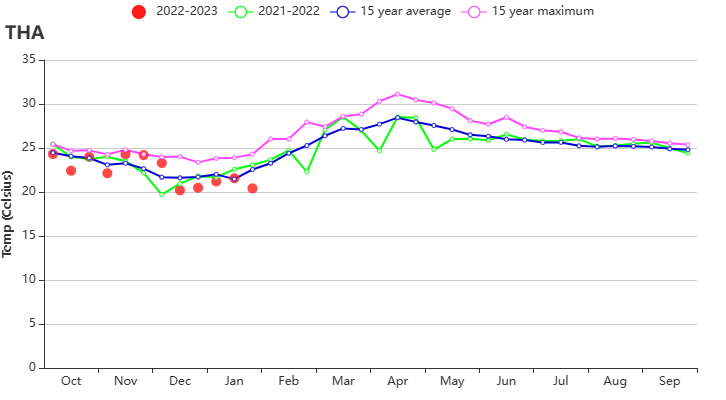
The NDVI development graph demonstrates that the crop conditions were generally below the 5-year average during the whole monitoring period. The large negative departures are artifacts, caused by cloud cover in the satellite images. The temperature was mainly below the 15-year average although the temperature from November to December was slightly higher than unusual. The rainfall was high at the beginning of October and at end of the November 2022, when it reached levels close to the 15-year maximum. Subsequently, it followed the 15YA. According to the NDVI departure clustering and the corresponding profiles, crop conditions were generally close to average on 65.5% of total arable land, located in the northeast, eastern, central, and some areas in the northern region. In the other regions, cloud cover in the satellite images affected the trends.
At the national level, most of the arable land was cropped during the season (CALF 99%). VCIx values were around 0.86. The Crop Production Index (CPI) in Thailand was 1.05. CropWatch estimates that the crop conditions were close to average.
Regional analysis
The regional analysis below focuses on some of the already mentioned agro-ecological zones of Thailand, which are mostly defined by the rice cultivation typology. Agro-ecological zones include Central double and triple-cropped rice lowlands (187), the South-eastern horticulture area (188), the Western and southern hill areas (189), and the Single-cropped rice north-eastern region (190).
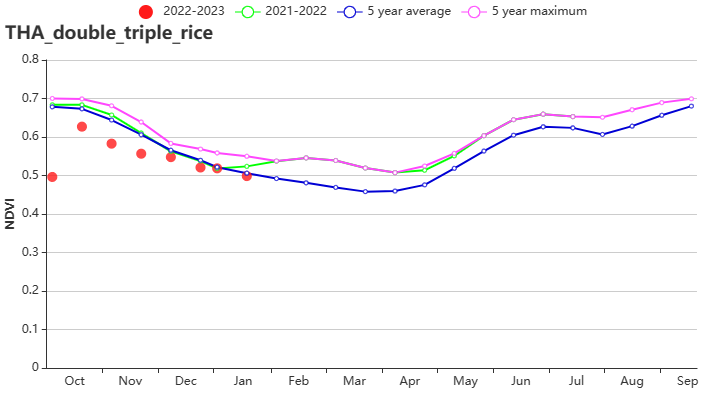
Compared to the 15YA, the Central double and triple-cropped rice lowlands experienced cooler and wetter conditions. Radiation (RADPAR +3%) was above average accompanied by lower temperatures (TEMP -0.3°C) and higher rainfall (RAIN +30%). These conditions led to a slightly above-average estimate for BIOMSS (BIOMSS +1%). The NDVI development graph shows that crop conditions were below the five-year average for most of the monitoring period except for January, as was the moderate VCIx value of 0.83. Overall, conditions were slightly below average.
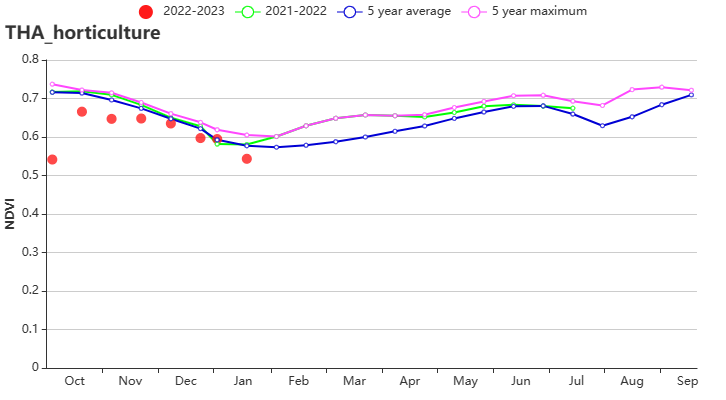
Indicators for the South-eastern horticulture area show that temperature (TEMP -0.7°C) and radiation (RADPAR -2%) were below average accompanied by higher rainfall (RAIN +21%). This led to a slightly above-average estimate for BIOMSS (BIOMSS +2%). According to the NDVI development graph, however, the crop conditions were slightly below average during this monitoring period except in early January. The VCIx was at 0.85. All in all, conditions were slightly below average.
Agroclimatic indicators show that the conditions in the Western and Southern Hills were slightly below average: radiation (RADPAR -2%) and temperature (TEMP -0.1°C) were below average, while the rainfall (RAIN, +29%) was above average. The average weather conditions led to a 3% increase in BIOMSS. According to the NDVI development graph, the crop conditions were significantly below average. According to the VCIx value of 0.89, crop conditions were assessed as below average.
In the Single-cropped rice north-eastern region, the temperature was below average (TEMP -0.5°C), while radiation (RADPAR +3%) and rainfall (RAIN, +7%) were above average. All these agroclimatic indicators led to an increase in potential biomass (BIOMSS +3%). According to the NDVI development graph, the crop conditions were close to average. Considering the moderate VCIx value of 0.86, the crop conditions are considered normal.
Figure 3.41 Thailand's crop condition, October 2022- January 2023.

(a) Phenology of major crops


b) Crop condition development graph based on NDVI c) Maximum VCI

d) Spatial NDVI patterns compared to 5YA e) NDVI profile


f) Rainfall profile g) Temperature profile


h) Crop condition development graph based on NDVI in the double and triple-cropped rice lowlands (left) and single-cropped rice North-eastern region (right)


i) Crop condition development graph based on NDVI in the South-eastern horticulture area (left) and Western and southern hill areas (right)
Table 3.74 Thailand's agroclimatic indicators by sub-national regions, current season's values and departure from 15YA,October 2022- January 2023.
| Region | RAIN | TEMP | RADPAR | BIOMSS | ||||
| Current(mm) | Departure from 15YA(%) | Current(°C) | Departure from 15YA(°C) | Current(MJ/m2) | Departure from 15YA(%) | Current(gDM/m2) | Departure from 15YA(%) | |
| Central double and triple-cropped rice lowlands | 500 | 30 | 22.9 | -0.3 | 1083 | 3 | 826 | 1 |
| South-eastern horticulture area | 493 | 21 | 23.9 | -0.7 | 1056 | -2 | 909 | 2 |
| Western and southern hill areas | 730 | 29 | 22.2 | -0.1 | 1052 | -2 | 983 | 3 |
| Single-cropped rice north-eastern region | 306 | 7 | 22.0 | -0.5 | 1068 | 3 | 726 | 3 |
Table 3.75 Thailand's agronomic indicators by sub-national regions, current season's values and departure,October 2022- January 2023.
| Region | CALF | Maximum VCI | |
| Current(%) | Departure from 5YA(%) | Current | |
| Central double and triple-cropped rice lowlands | 98 | -1 | 0.83 |
| South-eastern horticulture area | 99 | 0 | 0.85 |
| Western and southern hill areas | 100 | 0 | 0.89 |
| Single-cropped rice north-eastern region | 99 | -1 | 0.86 |
