Chapter 1 describes the CropWatch Agroclimatic Indicators (CWAIs) rainfall (RAIN), temperature (TEMP), and radiation (RADPAR), along with the agronomic indicator for potential biomass (BIOMSS) in 105 global Monitoring and Reporting Units (MRU). RAIN, TEMP, RADPAR and BIOMSS are compared to their average value for the same period over the last fifteen years (called the “average”). Indicator values for all MRUs are included in Annex A table A.1. For more information about the MRUs and indicators, please see Annex B and online CropWatch resources at www.cropwatch.com.cn. Compared to the previous bulletin, some of the larger MRU with several different phenology and agroclimatic conditions have been subdivided. Thus, the number of MRU wad increased by 40 in this bulletin.
1.1 Introduction to CropWatch agroclimatic indicators (CWAIs)
This bulletin describes the agroclimatic conditions and their potential impacts on crops over the period from October 2022 to January 2023, ONDJ, referred to as "reporting period". CWAIs are averages of climatic variables over agricultural areas only inside each MRU and serve the purpose of identifying global agroclimatic patterns. Refer to able A.1 for 2023 ONDJ numeric values of CWAIs by MRU. Although they are expressed in the same units as the corresponding climatological variables, CWAIs are spatial averages limited to agricultural land and weighted by the biomass production potential inside each area.
We also stress that the reference period, referred to as "average" in this bulletin covers the 15-year period from 2008 to 2022. Although departures from the 2008-2022 are not anomalies (which, strictly, refer to a "normal period" of 30 years), we nevertheless use that terminology. The specific reason why CropWatch refers to the most recent 15 years is our focus on agriculture, as already mentioned in the previous paragraph. 15 years is deemed an acceptable compromise between climatological significance and agricultural significance: agriculture responds much faster to persistent climate variability than 30 years, which is a full generation. For "biological" (agronomic) indicators used in subsequent chapters we adopt an even shorter reference period of 5 years (i.e., 2018-2022). This makes provision for the fast response of markets to changes in supply.
Correlations between variables (RAIN, TEMP, RADPAR and BIOMSS) at MRU scale derive directly from climatology. For instance, the positive correlation between rainfall and temperature results from high rainfall in equatorial, i.e., in warm areas.
Considering the size of the areas covered in this section, even small departures may have dramatic effects on vegetation and agriculture due to the within-zone spatial variability of weather. It is important to note that we have adopted an improved calculation procedure of the biomass production potential in the bulletin based on previous evaluation.
1.2 Global overview
According to WMO, global average temperatures in 2022 were 1.15ºC above pre-industrial levels. Globally, 2022 was the sixth warmest year on record. According to NOAA, the 10 warmest years in the last 143 years occurred since 2010. Europe and Asia recorded the second warmest years in 2022. Record temperatures during the summer months were accompanied by droughts, such as in most of Europe and Southern China. A heat wave in the northwest of India, in which temperatures exceeded 35ºC in March, caused yield losses in wheat.
1.3 Rainfall

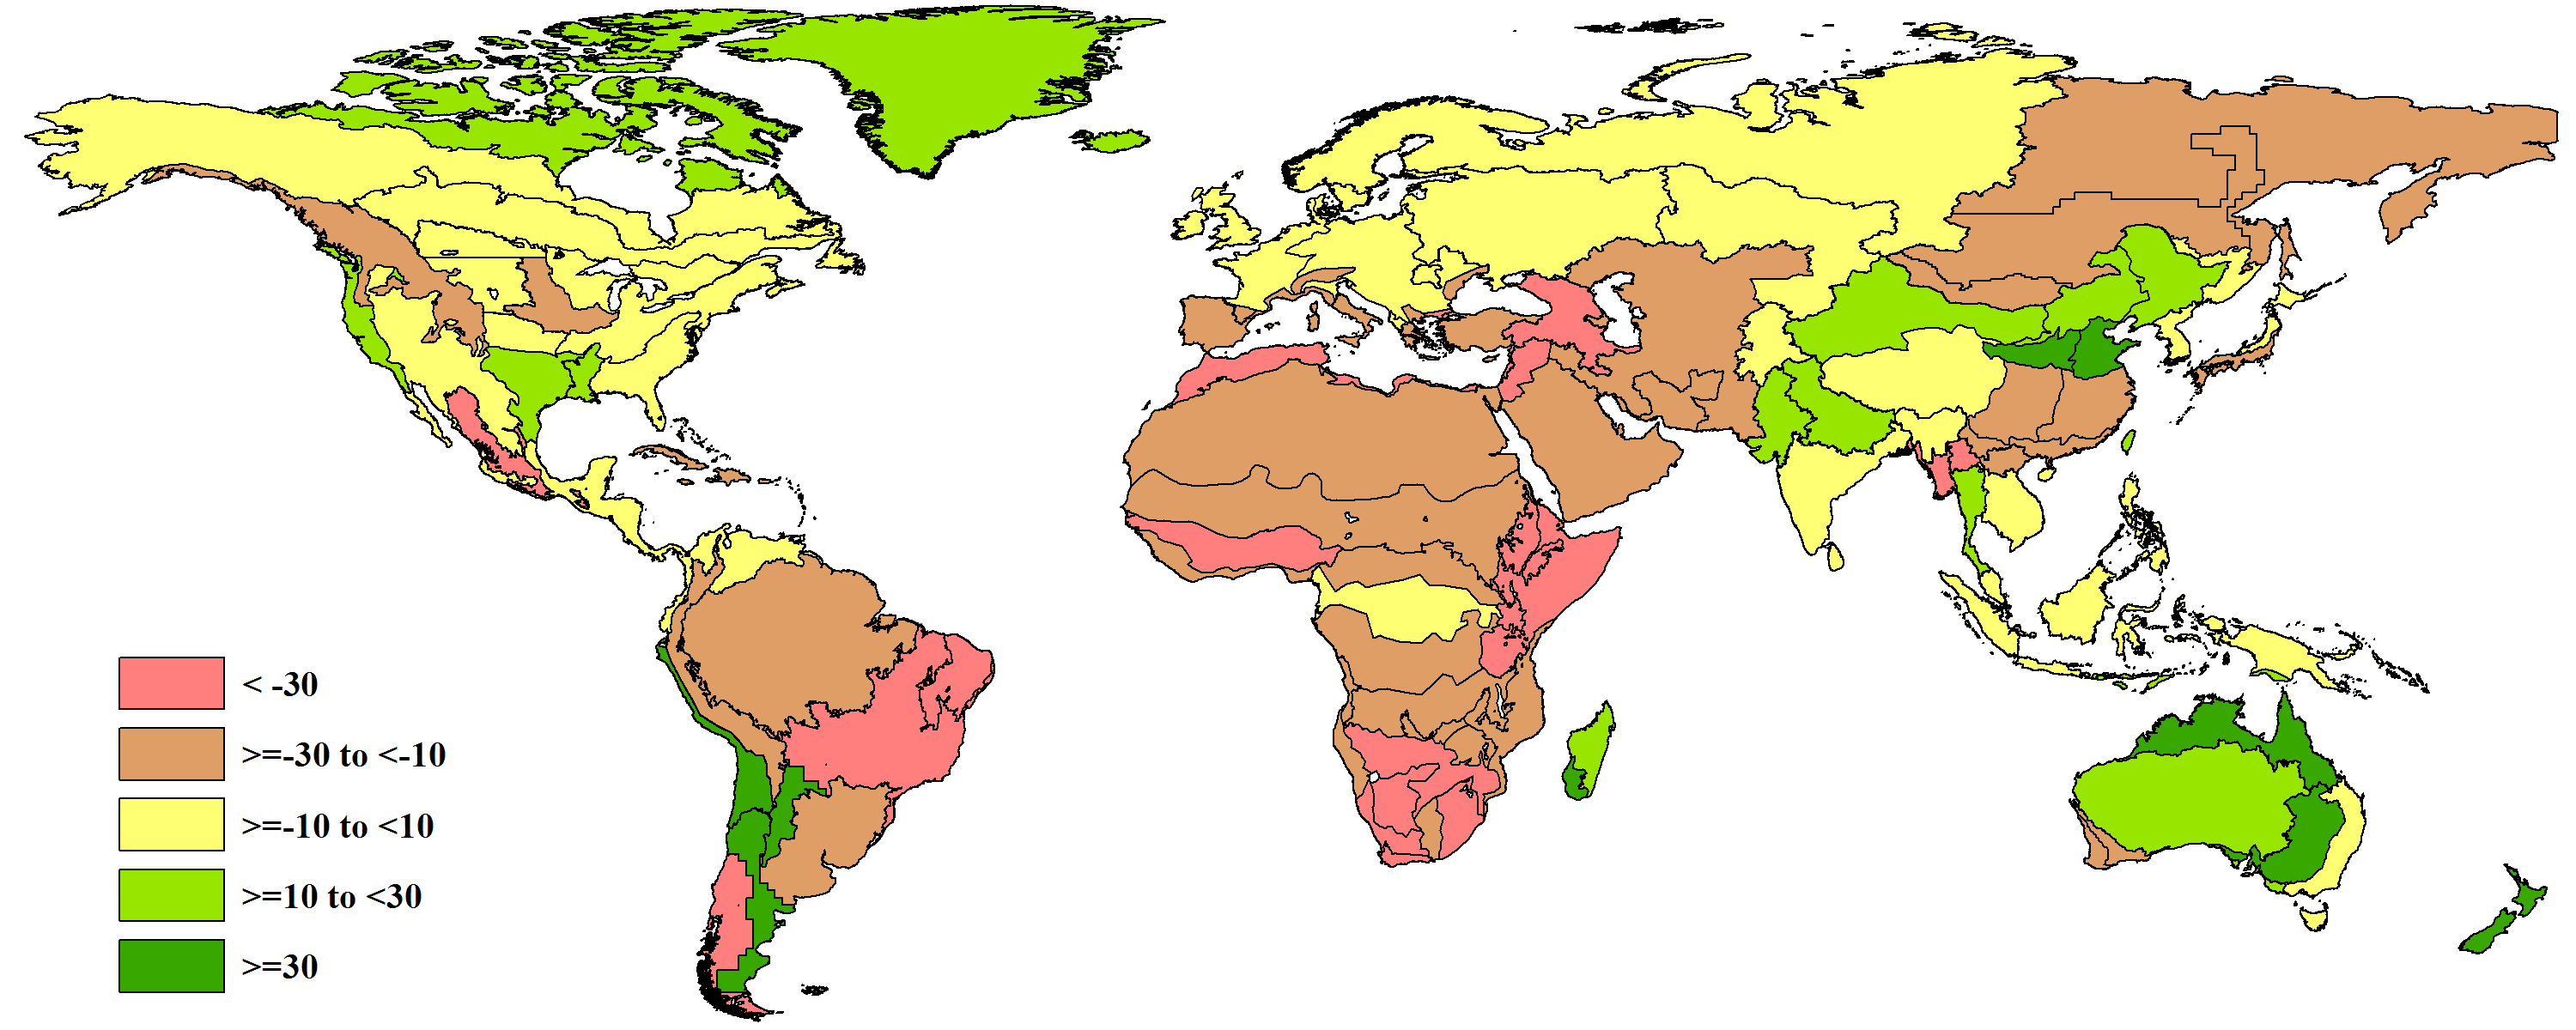
Figure 1.1 Global map of rainfall anomaly (as indicated by the RAIN indicator) by CropWatch Mapping and Reporting Unit: Departure of October 2022 to January 2023 total from 2008-2022 average (15YA), in percent.
A rainfall deficit was recorded for most of South America, Africa, the Middle East and South East China. Conditions were mixed in North America. Only the Sierra Madre in Mexico experienced a deficit that was larger than -30%. Above-average precipitation was recorded for California and the Central South of the USA. All countries bordering the Mediterranean Sea experienced severe deficits. In that region, winter is the period with the highest precipitation. The rainfall situation is grave in the Maghreb and Levant, as well as in the Caucasus, where the deficit exceeded -30%. In Central and Northern Europe, conditions were average as well as in most of Russia’s crop production regions. In Africa, a region along the Gulf of Guinea, as well as East and Southern Africa also had a severe rainfall deficit. Most of South and South-East Asia, Northern China as well as Australia and New Zealand experienced average to above average rainfall.
1.4 Temperatures

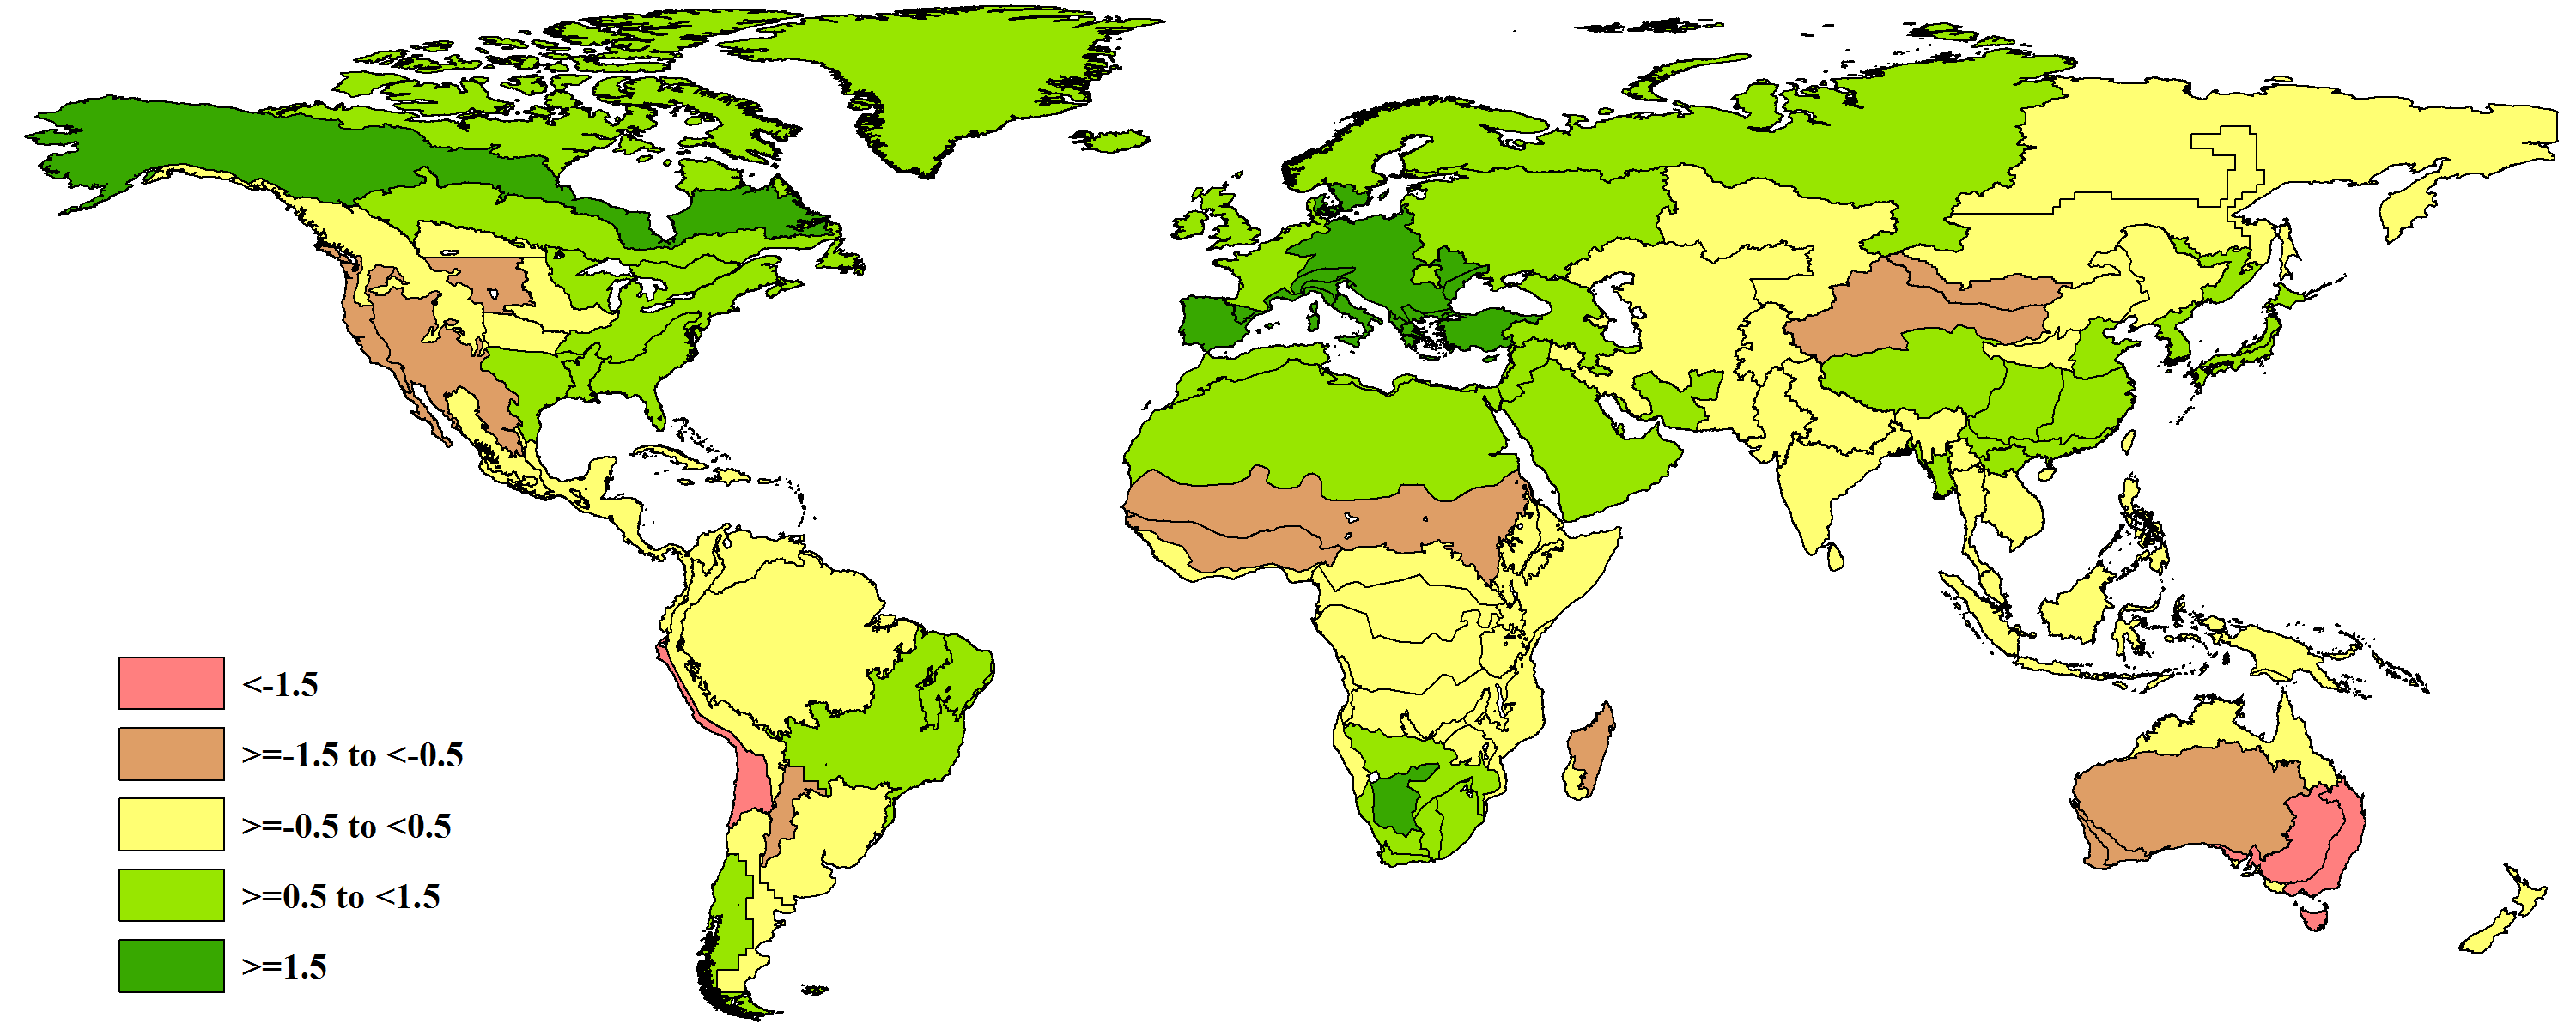
Figure 1.2 Global map of temperature anomaly (as indicated by the TEMP indicator) by CropWatch Mapping and Reporting , Unit: departure of October 2022 to January 2023 average from 2008-2022 average (15YA), in °C.
Temperatures were average in most of South America’s crop production regions. In Central and Northeastern Brazil, temperatures were warmer by more than 0.5ºC. The coastline along the Pacific from northern Chile to Ecuador experienced cooler than usual temperatures (<-1.5ºC). The Western USA also experienced cooler than usual temperatures, whereas the south and east were warmer. Temperatures were warmer than usual in all of Europe, northern Africa and the Levant. The Sahel and the south experienced cooler temperatures than usual, whereas the countries in Southern Africa were warmer than usual (>0.5ºC). Most of China, apart from the Northwest, had temperatures that were 0.5 to 1.5ºC above average. Cooler than usual temperatures were recorded for most of Australia. Especially Southeast Australia experienced cooler than usual temperatures (<-1.5ºC).
1.5 RADPAR

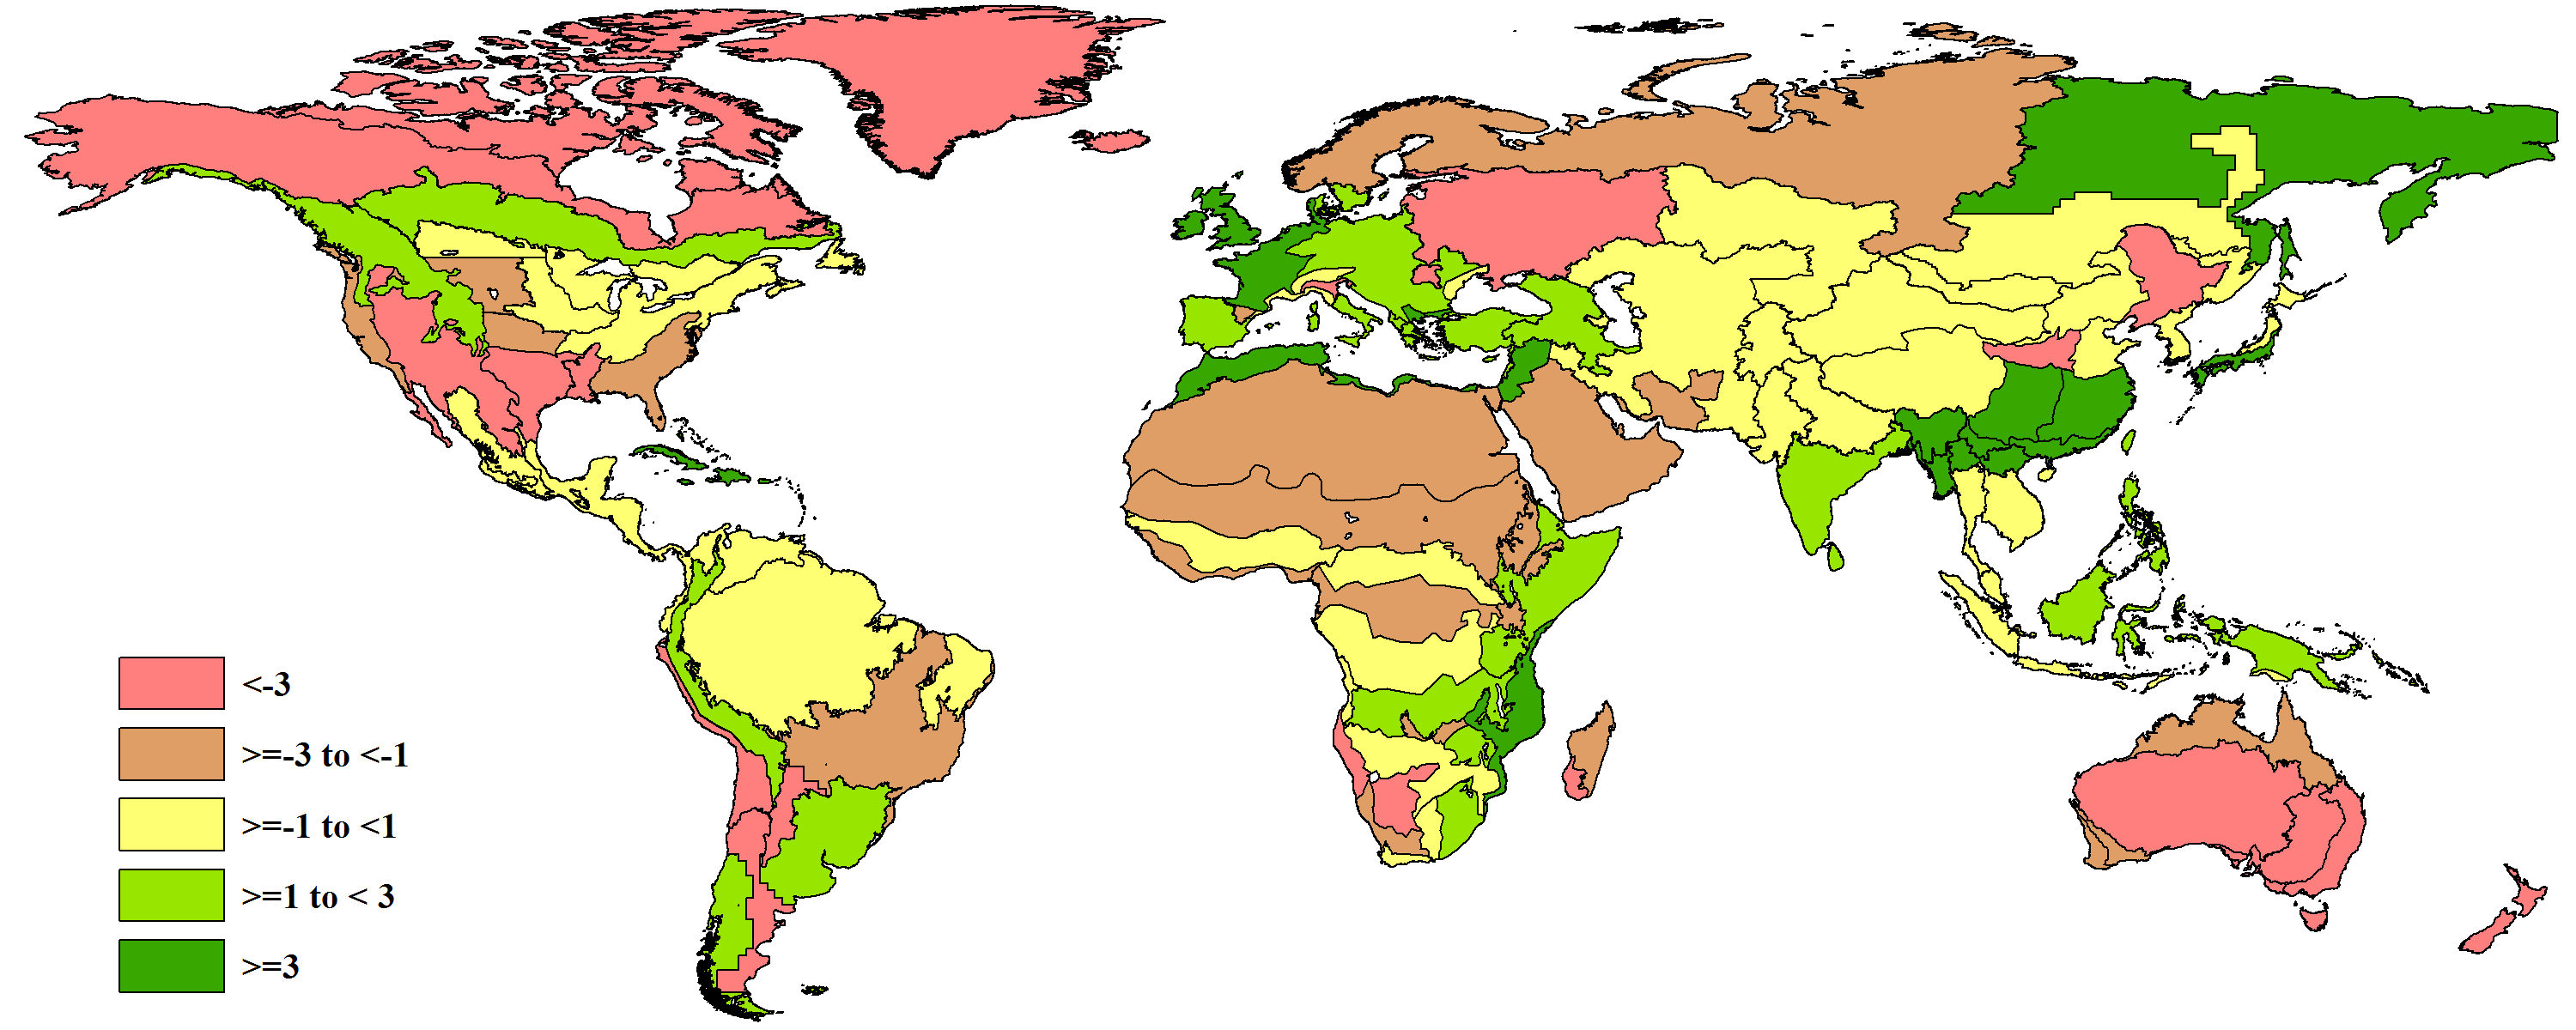
Figure 1.3 Global map of photosynthetically active radiation anomaly (as indicated by the RADPAR indicator) by CropWatch Mapping and Reporting Unit: departure of October 2022 to January 2023 average from 2008-2022 average (15YA), in percent.
Within the important crop production regions, the strongest negative departures (<-3%) in photosynthetically active radiation were observed for the southern USA, Ukraine, Russia west of the Ural, Northeast China, Australia and New Zealand. In the Cerrado of Brazil, solar radiation was below average by -1 to -3%. A similar negative departure from the 15YA was observed for California and the Southeast of the USA, the Sahel region, Central Africa and the Arabian Peninsula. Conditions were average for Central America, northeast of the USA and most of Central Asia. Positive departures in the range of +1 to +3% were recorded for Southern Brazil, the Pampas, the Andes region from Bolivia to Venezuela, Central Europe, Türkiye, the Caucasus region, East and South-East Africa, India and the Philippines. The Maghreb, Western Europe, the Levant as well as South-East China received radiation that was more than 3% above average.
1.6 BIOMSS

Figure 1.4 Global map of biomass accumulation (as indicated by the BIOMSS indicator) by CropWatch Mapping and Reporting Unit: departure of October 2022 to January 2023 average from 2008-2022 average (15YA), in percent.
Almost all of the relevant crop production regions in South America had a decline in estimated biomass production by more than -5%. The only exception was Central Chile, for which a strong positive departure was estimated. Strong negative departures were observed for the Iberian Peninsula, and most of Africa, with the exception of the Sahel and Central Africa, where the decline ranged between -2 to -5%. The near and Middle East, as well as Southern China, Southern Japan, Myanmar and Southwest Australia also had a decline by more than -5%. Apart from the Rocky Mountain region, biomass production in most of the USA and Canada showed strong positive departures by more than +5%. Positive (+2 to +5%) to strongly positive (>+5%) departures were estimated for Western, Central and Eastern Europe, together with India, Thailand, Vietnam, the Malay Archipelago, the Murray-Darling basin in Eastern Australia and New Zealand.
