The reporting period covers the onset and establishment of the rainy season, characterized by agricultural activities of the land preparation and planting of rainfed cereal crops and legumes/pulses. The early part of the reported period also included the harvested of irrigated wheat grown mainly under center pivot systems. This monitoring period recorded a below-average rainfall of 723 mm (RAIN -18%), an average temperature of 23.4°C (-0.1°C) and an average radiation of 1316 MJ/m2 (+0%), resulting in potential biomass production reduction of 1147 gDM/m2, -6%). The cropped arable land fraction (CALF) was 98% (+0%), and the VCIx was 0.90. The crop condition based on the NDVI indicates a significant decline in January. The reduced NDVI can be partly attributed to the above-normal rainfall in January, resulting in a prolonged flooding of cropped fields. Cloud cover in the satellite images may also have contributed to the sharp drops in NDVI. Countrywide, climatic indicators generally showed average conditions for early crop establishment for the main cereals (maize, sorghum, and millet) and pulses/legumes (soybean, groundnuts, cowpeas, sunflower, beans, pumpkins, and other minor crops).
Regional analysis
Zambia is classified into four major agroecological zones (AEZs), primarily based on rainfall amount but also incorporating soils and other climatic characteristics. These AEZs include: Luangwa-Zambezi Rift Valley (225), covering the major river valleys with rainfall less than 400-800 mm per year; Northern high rainfall zone (226); Central-Eastern and Southern Plateau (227), with relatively fertile soils; Western Semi-Arid Plain (228), dominated by relatively poor sandy soils.
The analyses of the agroecological regions show that the rainfall was below-average in all regions. The reduction in rainfall ranged from -30% (Western Semi-arid Plateau) to -10% (Central-Eastern and Southern Plateau). However, average rainfall levels were still rather high, with the total exceeding 550 mm. Hence, rainfall was probably not limiting crop production in most regions. The average temperature varied from 21.9°C (Northern High Rainfall Zone) to 24.6°C (Luangwa Zambezi Rift Valleys) with negative departure (-0.2°C to -0.1°C) from the 15YA, respectively. The radiation in all agroecological zones was above 1280 MJ/m2. Negative departures in radiation were observed for the Luangwa Zambezi Rift Valley (-2%) and Central Eastern and Southern Plateau (-1%). The interplay of rainfall, temperature and solar radiation led to a reduction in potential biomass production (-7% to - 6%) in all three regions.
The observed Cropped Arable Land Fraction (CALF) was above 96% in all the regions; however, the crop condition based on NDVI showed reduced values during January across all the areas due to flooding and effects of cloud cover on NDVI, as mentioned above. The maximum vegetation health index (VCIx) was the lowest in Central-Eastern Southern Plateau region (0.87) and Western Semi-Arid Areas (0.89), while Northern High Rainfall Zone and Western semi-arid and Luangwa-Zambezi Rift Valleys were above 0.90.
In general, the traditionally low rainfall regions experienced increased rainfall, hence favorable conditions for crop production; however, excessive rainfall and prolonged flooding in January would negatively impact the expected crop yields in limited areas. All in all, prospects for crop production are fair.
Figure 3.48 Zambia’s crop condition, October 2022 - January 2023
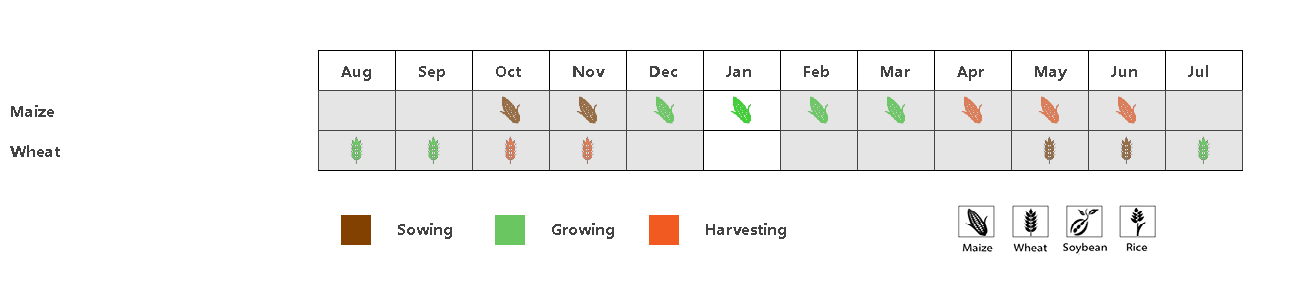
Figure A: Crop Phenology
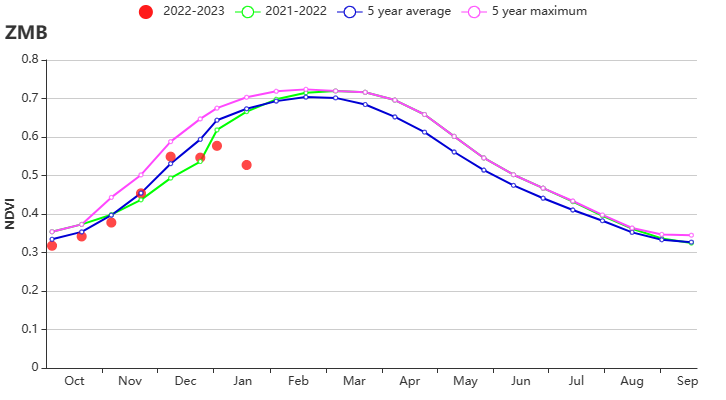
Figure B: Crop condition development graph based on NDVI
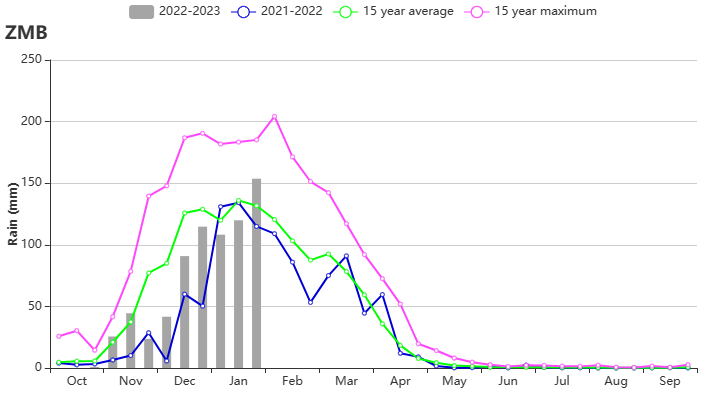
Figure C: Time series rainfall profile

Figure D: Time series temperature profile
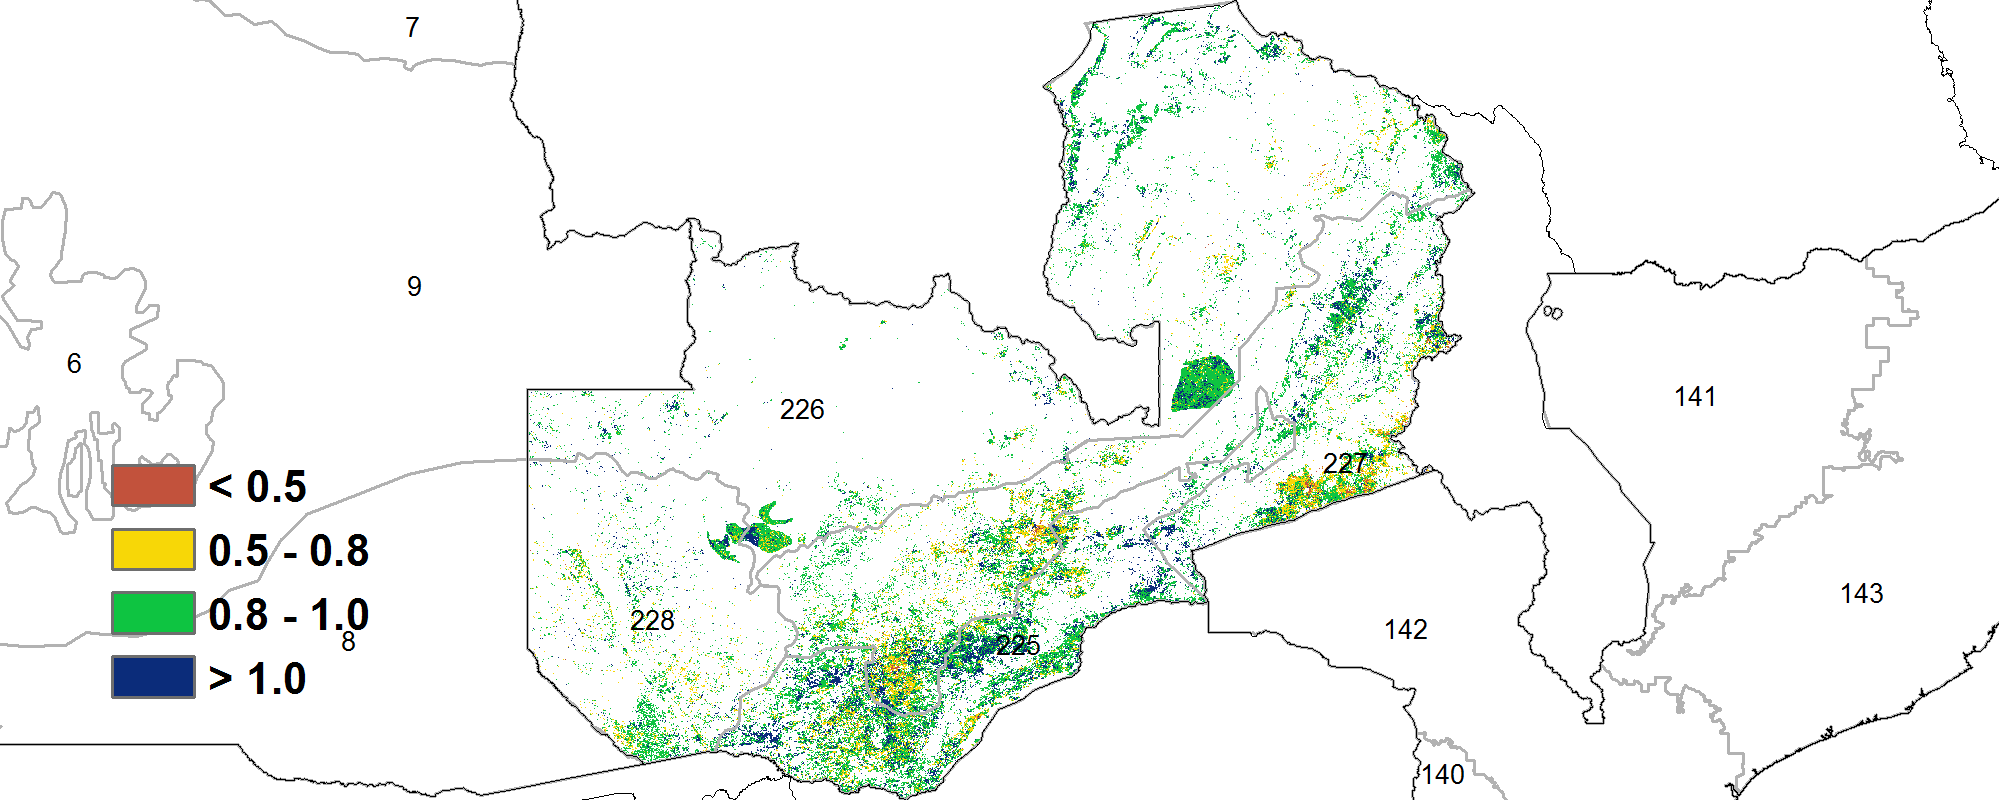
Figure E: Maximum VCI
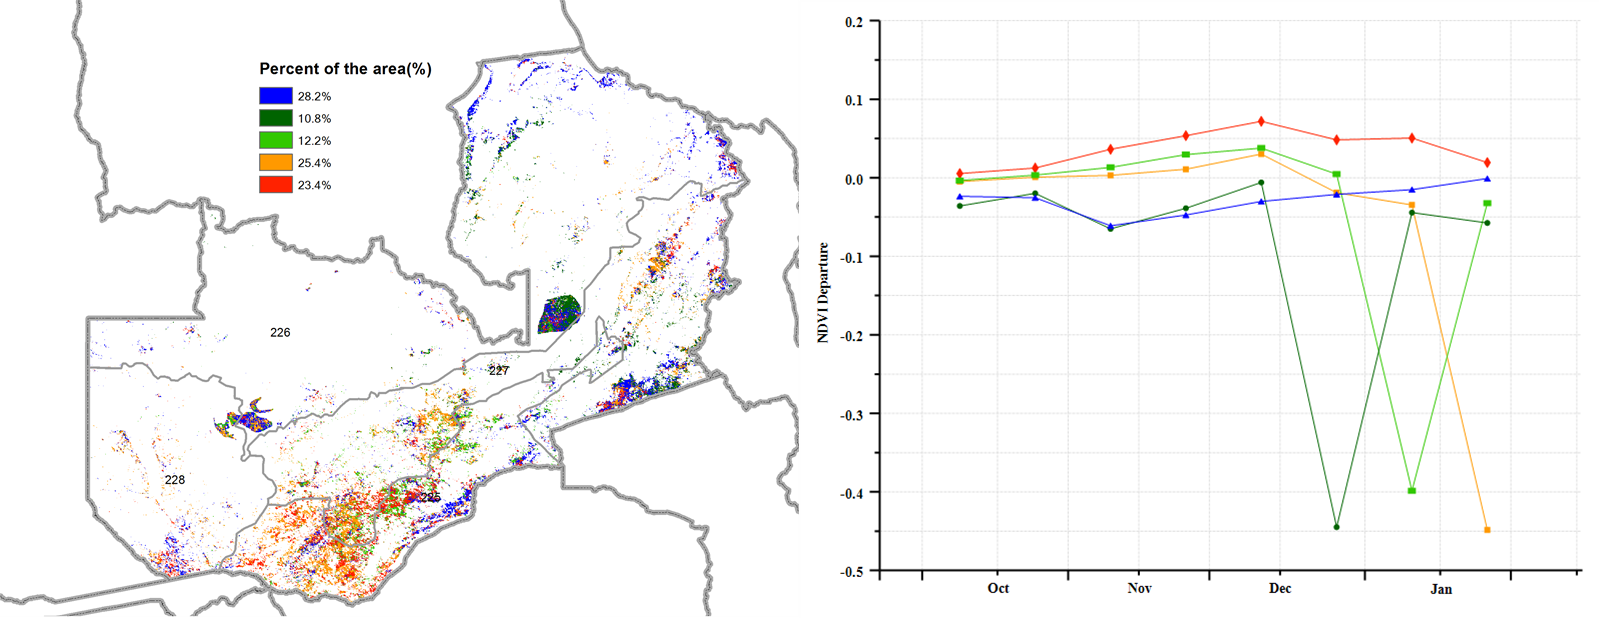
Figure F: Spatial distribution of NDVI profiles
Table 3.88: Country's agroclimatic indicators by sub‐national regions, current season's values and departure from 15YA, October 2022 – January 2023
| Region | RAIN | TEMP | RADPAR | BIOMSS | ||||
| Current(mm) | Departure from 15YA(%) | Current(°C) | Departure from 15YA(°C) | Current(MJ/m2) | Departure from 15YA(%) | Current(gDM/m2) | Departure from 15YA(%) | |
| Luanguwa Zambezi rift valley | 651 | -20 | 24.6 | -0.2 | 1361 | -2 | 1126 | -6 |
| Northen high rainfall zone | 788 | -20 | 21.9 | -0.1 | 1286 | 2 | 1176 | -8 |
| Central-eastern and southern plateau | 741 | -10 | 23.7 | -0.1 | 1314 | -1 | 1130 | -6 |
| Western semi-arid plain | 586 | -30 | 24.5 | -0.2 | 1319 | 0 | 1193 | -7 |
Table 3.89: Country's agronomic indicators by sub-national regions, current season's values and departure from 5YA, October 2022 – January 2023
| Region | CALF | Maximum VCI | |
| Current(%) | Departure from 5YA(%) | Current | |
| Luanguwa Zambezi rift valley | 99 | 1 | 0.93 |
| Northen high rainfall zone | 100 | 0 | 0.92 |
| Central-eastern and southern plateau | 96 | -1 | 0.87 |
| Western semi-arid plain | 100 | 0 | 0.89 |