According to the phenology calendar, the current period covers the harvest of crops in Australia. Compared to the 15-year average, the rainfall increased by 17%, to 324 mm. Precipitation was above average mostly in October. The temperature was 19.7 °C (-1.4 °C), while the radiation was 1393 MJ/m2 (-5%). As a result, the potential accumulated biomass was slightly above average (+2%). The CALF increased by 45% compared to the 5YA, and VCI was 1.08. Conditions for cereal production remained favorable through this monitoring period.
The NDVI profiles also showed continued favorable conditions, as the crop conditions were around the maximum of the last 5 years, especially in October and November. The spatial NDVI clustering map also showed good conditions, where more than 90% of areas had mostly positive departures. The only constraint was flooding, which had occurred in New South Wales and Victoria in October.
In general, the crop conditions in the current period were favorable. Drier weather after October improved conditions for wheat harvest. With a CPI of 1.83, above-average production can be expected for Australia.
Regional analysis
Australia has five agro-ecological zones (AEZs), namely the Arid and Semi-arid Zone (marked as 18 on the NDVI clustering map), Southeastern Wheat Zone (19), Subhumid Subtropical Zone (20), Southwestern Wheat Zone (21), Wet Temperate and Subtropical Zone (22). The Arid and Semi-arid Zone, in which hardly any crop production takes place, was not analyzed.
The Southeastern Wheat Zone was affected by flooding in October, which was caused by above-average rainfall (+40%). The temperature (-1.6°C) and radiation (-7%) were both below average. The biomass was positive (+7%). 96% of cropland in the AEZ was cultivated, and the VCIx was 1.15. The NDVI was mostly greater than the 5-year maximum. All indicators were favorable.
The Subhumid Subtropical Zone had average rainfall, but largely cooler temperature (-2.1°C) and slightly below average radiation (-3%). The biomass was generally average (+1%). The CALF was greatly increased by 134%, to 85%, and the VCIx was 1.15. The NDVI profile showed that the crop conditions were good, especially in October and November were above the 5-year maximum. The crop conditions in this zone were favorable.
The Southwestern Wheat Zone was slightly drier and cooler than normal. The rainfall (-17%), temperature (-1.2 °C) and radiation (-3%) were all below average, which led to a below-average estimate for biomass (-13%). Though the CALF was increased (+30%), the VCIx was still less than 1 (0.99). The NDVI was generally above average. The conditions were optimal for the harvest of the cereal crops.
The conditions in the Wet Temperate and Subtropical Zone were similar to the Southeastern Wheat Zone, with above-average rainfall (+20%), below-average temperature (-1.1°C) and radiation (-6%). The biomass was also above average (+3%). The cropland was 100% cultivated, but VCIx was 0.93. The NDVI profiles showed that the NDVI reached maximum levels from October to November, and then approached average levels. The crop conditions in this zone were also favorable.
Figure 3.1 Australia's crop condition, October 2022 – January 2023

(a) Phenology of major crops
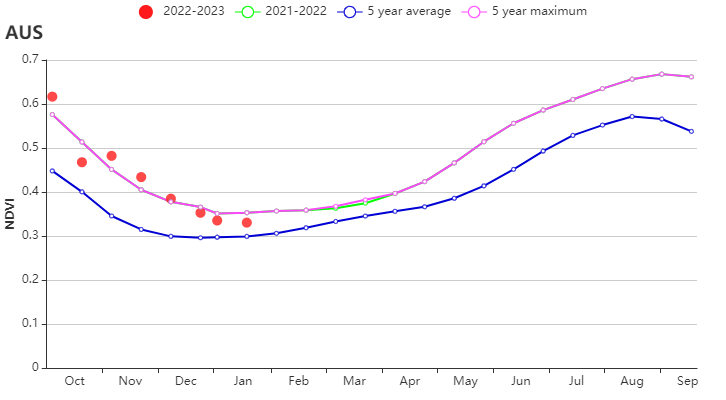
(b) Crop condition development graph based on NDVI
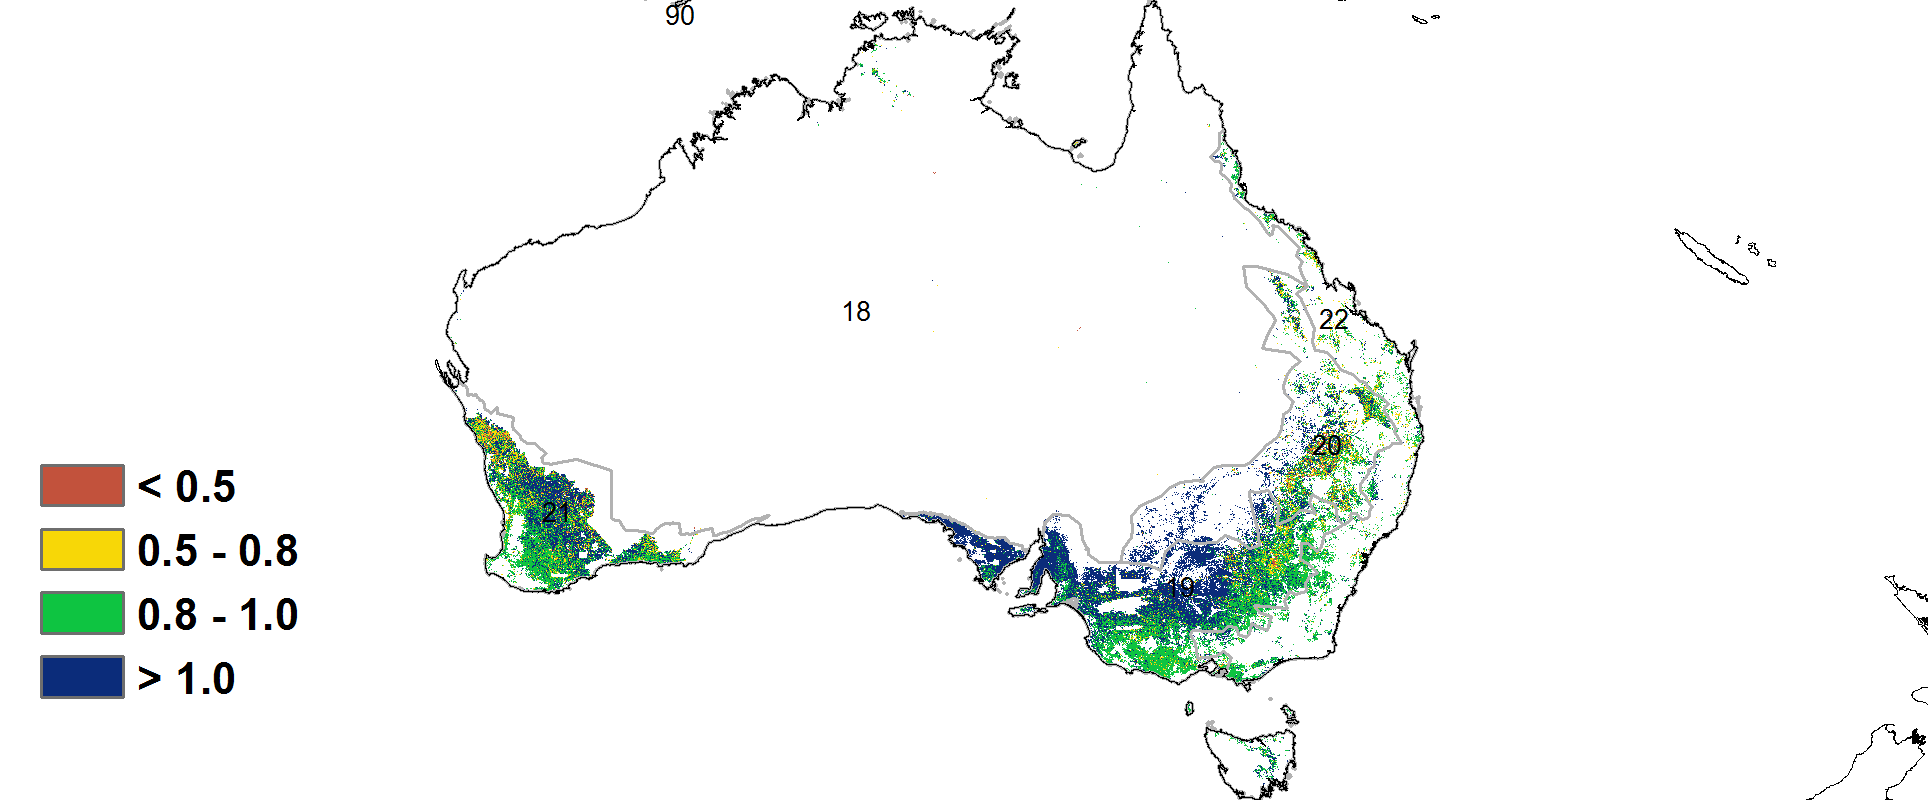
(c) Maximum VCI
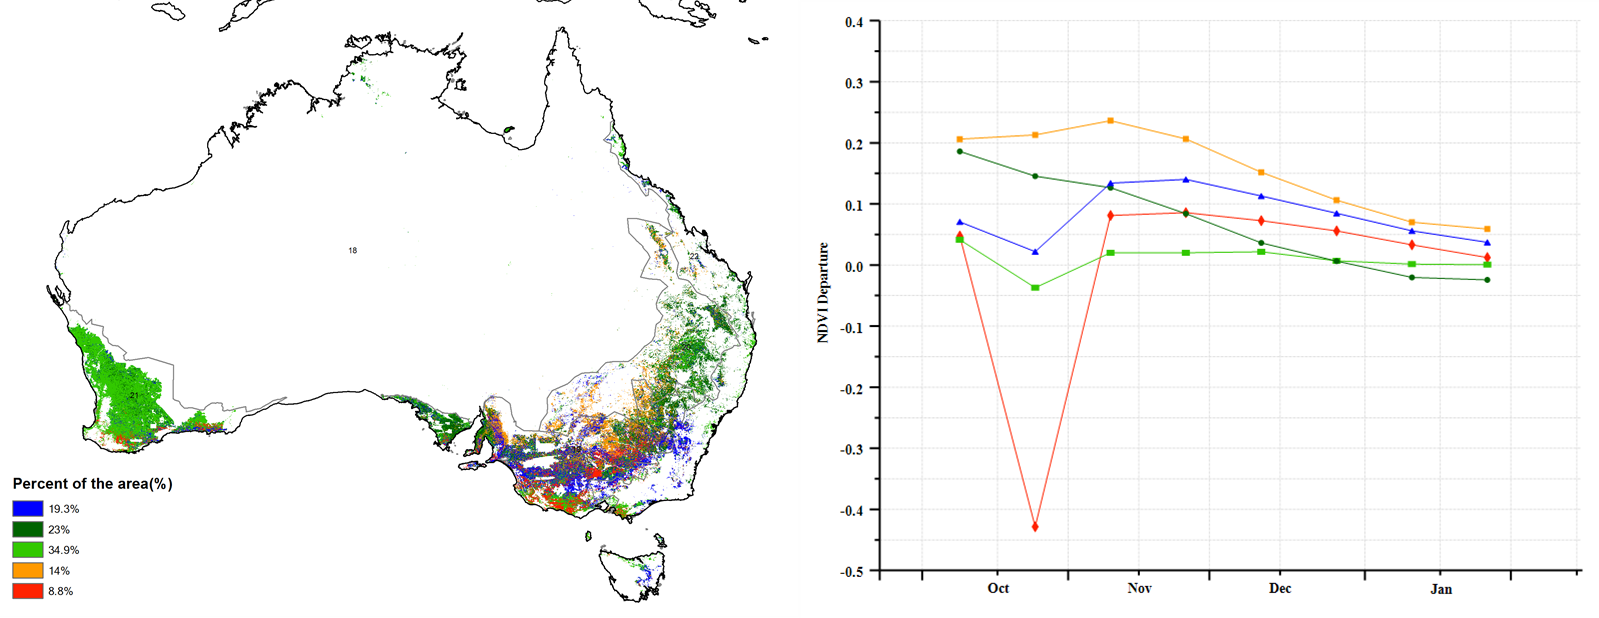
(d) Spatial NDVI patterns compared to 5YA (e) NDVI profiles
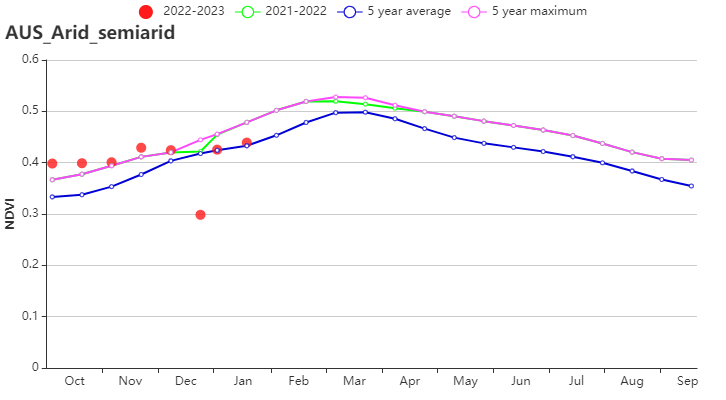
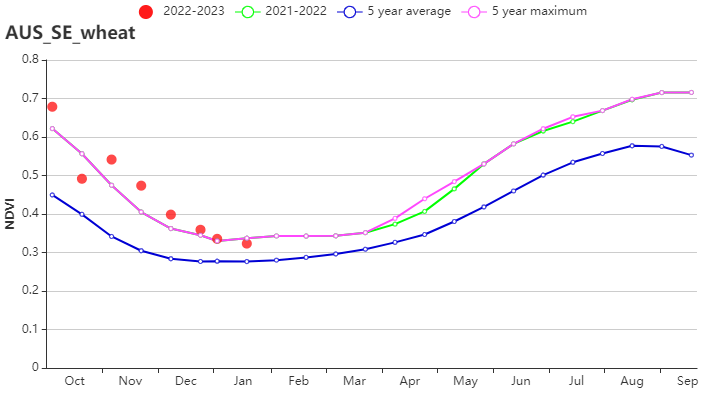
(f) Crop condition development graph based on NDVI (Arid and semiarid zone (left) and Southeastern wheat area (right))
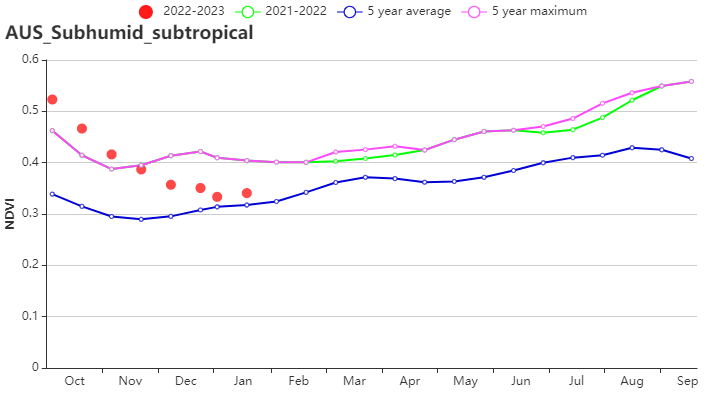
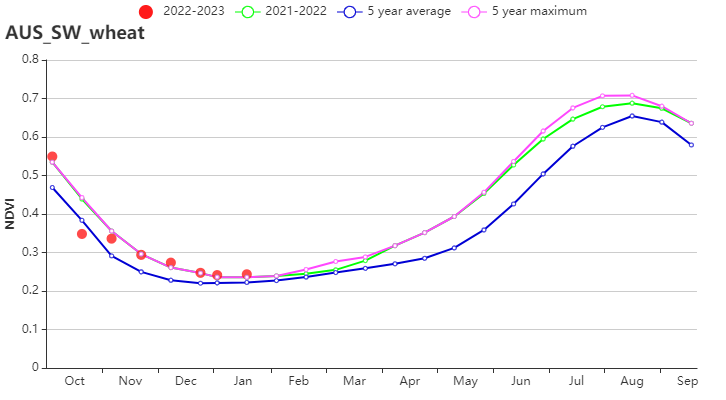
(g) Crop condition development graph based on NDVI (Subhumid subtropical zone (left) and Southwestern wheat area (right))
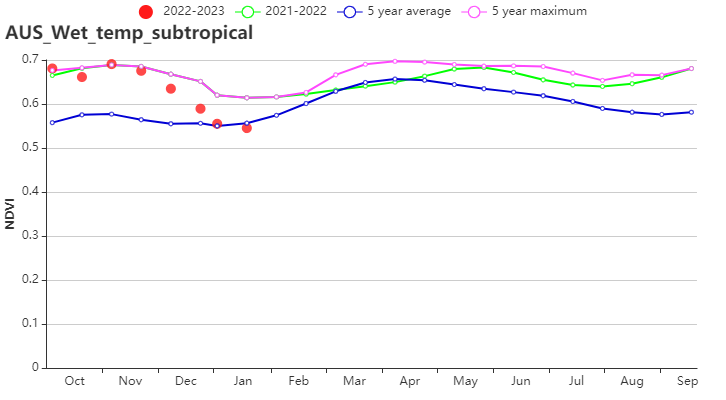
(h) Crop condition development graph based on NDVI (Wet temperate and subtropical zone)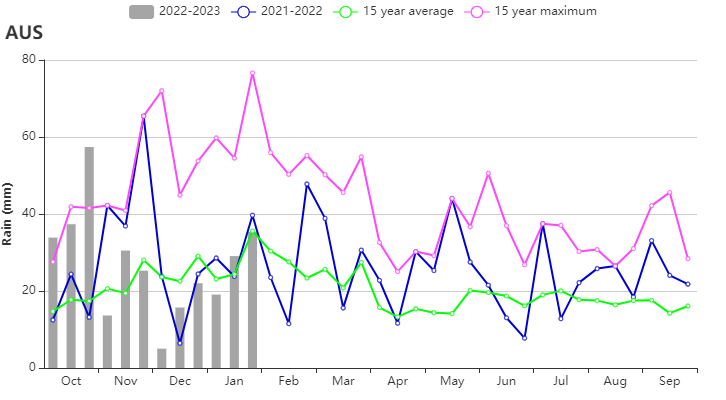
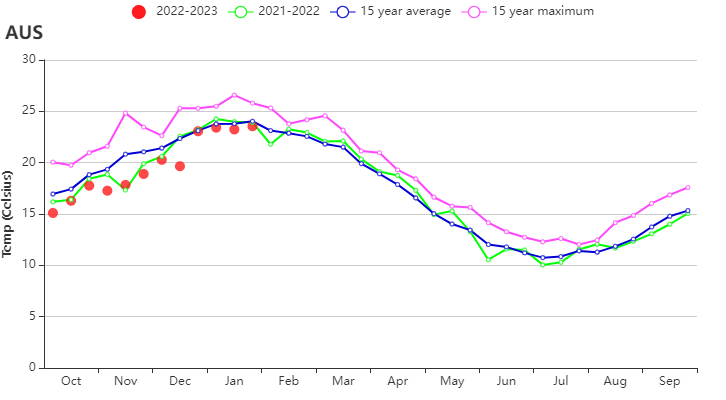
(i)Time series rainfall profile (left) and temperature profile (right)
Table 3.1 Australia’s agroclimatic indicators by sub-national regions, current season’s values and departure from 15YA, October 2022 – January 2023
Region | RAIN | TEMP | RADPAR | BIOMSS | |||||
Current (mm) | Departure (%) | Current (°C) | Departure (°C) | Current (MJ/m2) | Departure (%) | Current (gDM/m2) | Departure (%) | ||
Arid and semiarid zone | 719 | 24 | 26.8 | -0.3 | 1386 | -2 | 1014 | 6 | |
Southeastern wheat area | 283 | 40 | 18.5 | -1.6 | 1369 | -7 | 828 | 7 | |
Subhumid subtropical zone | 271 | 0 | 21.9 | -2.1 | 1457 | -3 | 919 | 1 | |
Southwestern wheat area | 88 | -17 | 18.4 | -1.2 | 1485 | -3 | 555 | -13 | |
Wet temperate and subtropical zone | 450 | 20 | 18.3 | -1.1 | 1326 | -6 | 950 | 3 | |
Table 3.2 Australia’s agronomic indicators by sub-national regions, current season’s values and departure from 5YA, October 2022 – January 2023
Region | Cropped arable land fraction | Maximum VCI | |
Current (%) | Departure (%) | Current | |
Arid and semiarid zone | 69 | 17 | 1.01 |
Southeastern wheat area | 96 | 48 | 1.15 |
Subhumid subtropical zone | 85 | 134 | 1.15 |
Southwestern wheat area | 77 | 30 | 0.99 |
Wet temperate and subtropical zone | 100 | 6 | 0.93 |