During the reporting period, the growing and harvesting of Aman rice, and the sowing of Boro rice and wheat were the main farming activities. For the whole nation, RAIN (-1%) was slightly below average. Both TEMP (+0.2℃) and RADPAR (+3%) were above average. After October, the fine weather facilitated the completion of rice harvest and the sowing of wheat and maize. BIOMSS (-1%) was slightly below average. The national NDVI development graph shows that overall crop conditions were near the 5-year average in October and early November and then returned to below the 5-year average from November to January. According to the spatial NDVI pattern, slightly poorer crop conditions were observed for most of the country's arable land area during the entire reporting period. Only 9.6% showed unfavorable conditions in early October scattered throughout the country. The low values might be an artifact caused by cloud cover. The maximum Vegetation Condition Index (VCIx) was 0.90, with most areas showing values higher than 0.8 except for the parts of the northeast, where rainfall was lower. CALF was close to average. Overall, the CropWatch indicators as well as the VCIx map indicate average crop conditions in Bangladesh as CPI (1.09) showed.
Regional analysis
Bangladesh can be divided into four agro-ecological zones (AEZ): The Coastal region, the Gangetic Plain, the Hills, and the Sylhet basin.
In the Coastal region, both RAIN and TEMP were above average (+3% and +0.7℃, respectively). RADPAR was also above average (+3%). BIOMSS was above average (+1%). The crop condition development graph based on NDVI shows that crop conditions trended slightly below the 5-year average. Average conditions were found in the middle and end of November due to the sufficient rainfall in early November. CALF was 93% (+1%) and VCIx was 0.85. CPI was 1.04. Overall, crop conditions were close to the average for this zone.
In the Gangetic Plain, the agroclimatic indicators show that the accumulated rainfall, temperature and radiation were all above average (RAIN +4%, TEMP +0.2℃, RADPAR +1%), which resulted in near-average biomass production potential (BIOMASS +1%). The crop condition development graph based on NDVI shows that crop conditions were close to the 5-year average before the end of November and then slightly below average. During the monitoring period, CALF (97%) was close to average, VCIx was 0.94, and CPI was 1.13. Favourable crop conditions were expected in this region.
For the Hills, both TEMP (+0.3℃)and RADPAR (+4%) were above average. But this region experienced the largest deficit in rainfall (-21%). BIOMASS was below average (-11%). During the monitoring period, the crop condition development graph based on NDVI shows that crop conditions were close to average in October and then slightly below. CALF was 98% and VCIx was 0.90, CPI was 1.08 for this region, indicating average crop conditions.
In the Sylhet basin, above-average rainfall (+8%) and cooler temperatures (-0.2℃) were recorded. RADPAR was above average (+2%). BIOMSS was estimated 4% higher than the 15YA. The crop condition development graph based on NDVI shows that crop conditions were above the 5-year average at the end of October and then decreased to below average from November to January. For the Sylhet basin, CALF was 90% (-2%) and VCIx was 0.87. CPI was 1.05. Based on the above information, crop conditions were close to the average for this zone.
Figure 3.5 Bangladesh’s crop condition, October 2022- January 2023
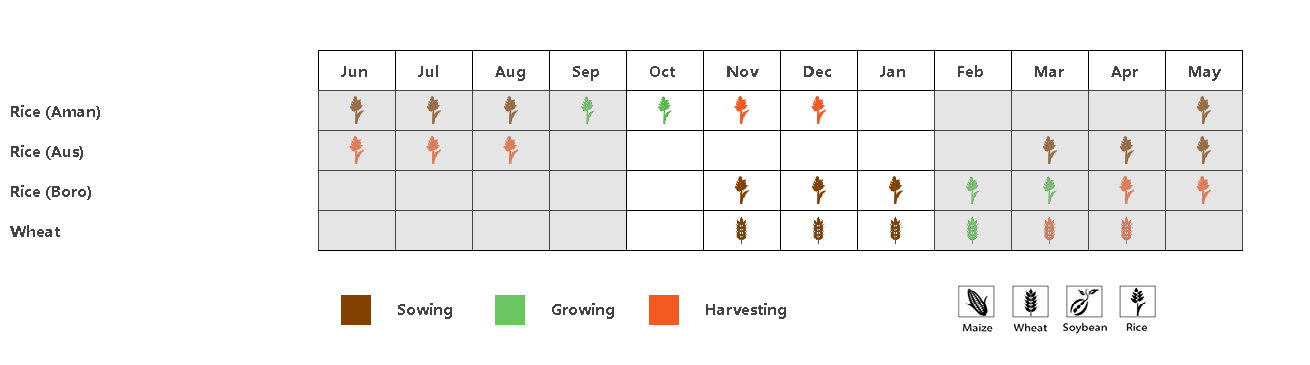
(a). Phenology of major crops

(b) Crop condition development graph based on NDVI
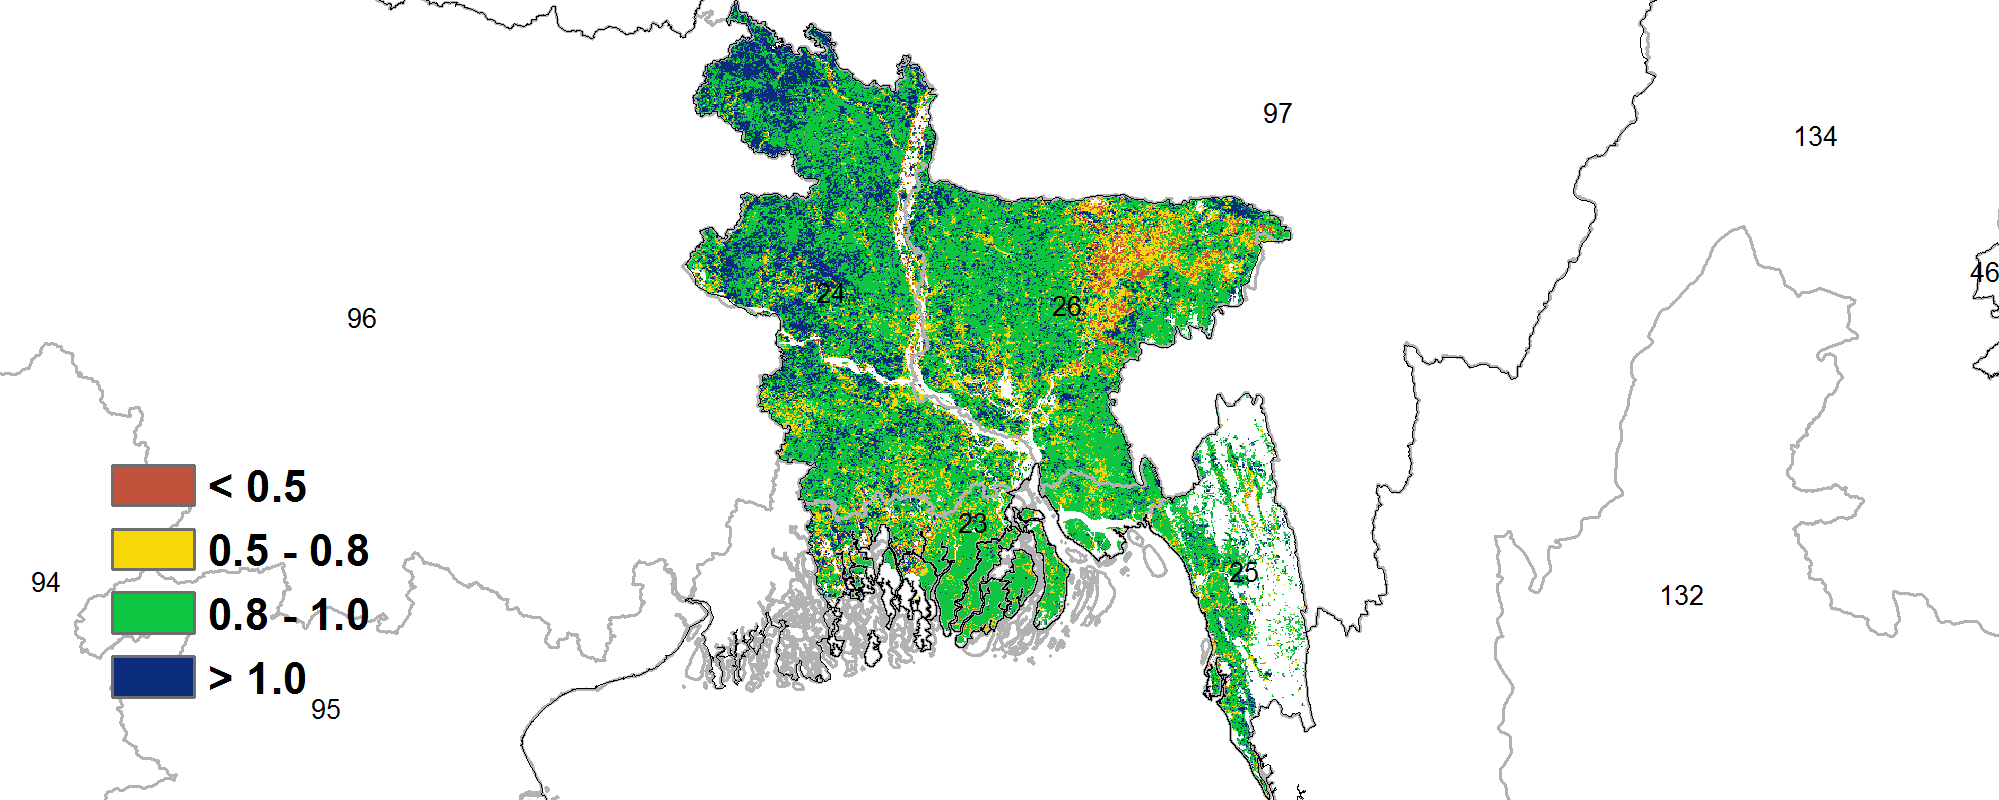
(c) Maximum VCI
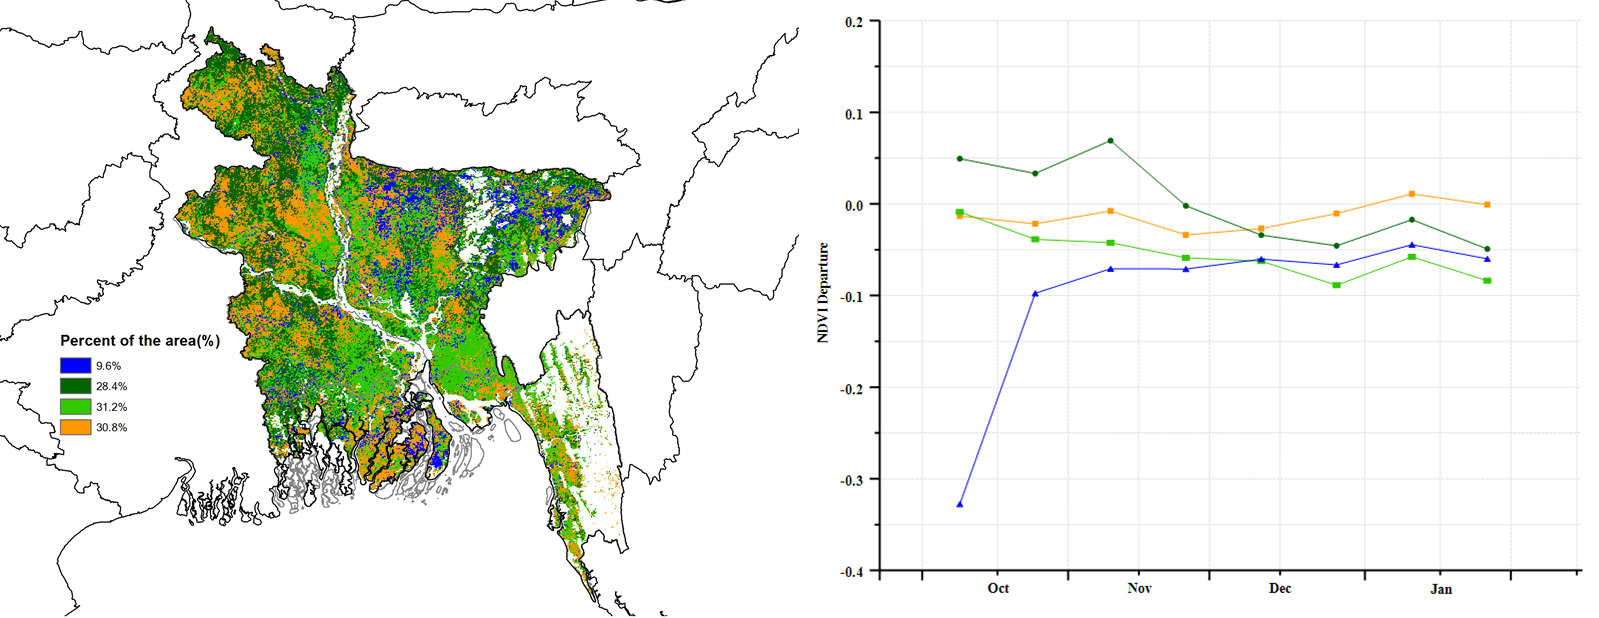
(d) Spatial NDVI patterns compared to 5YA (e) NDVI profiles
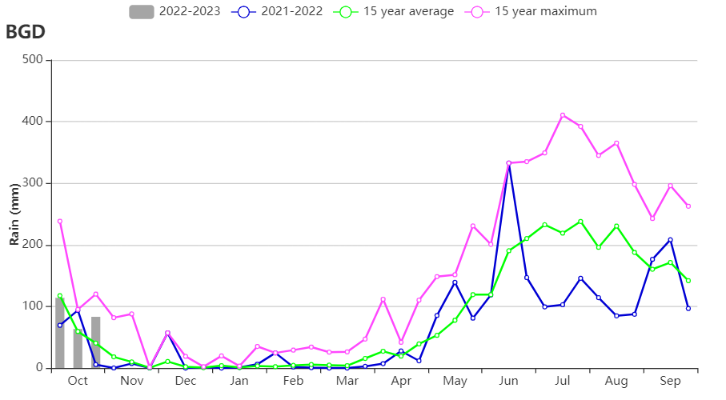
(f) Rainfall profiles
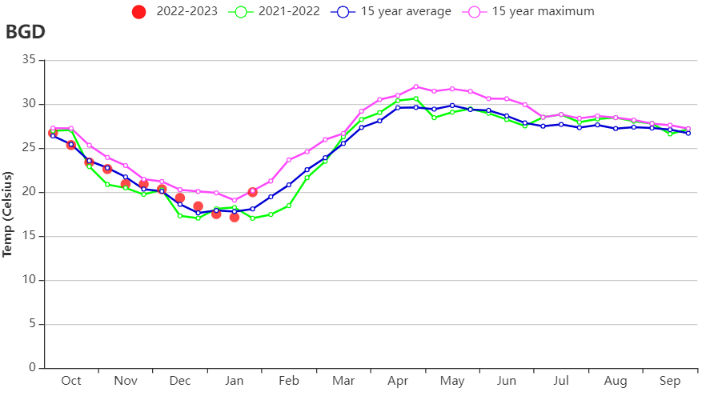
(g) Temperature profiles
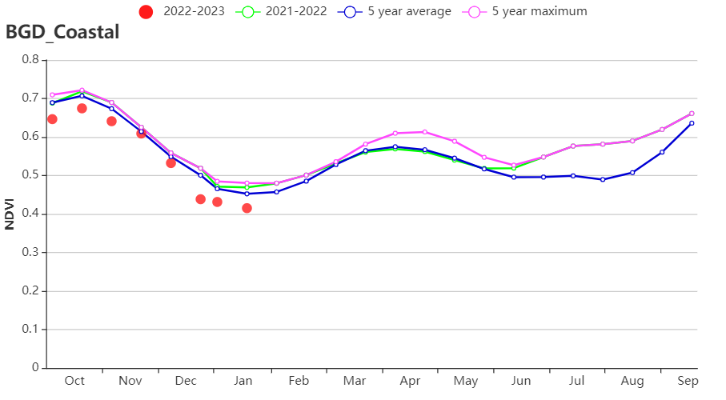
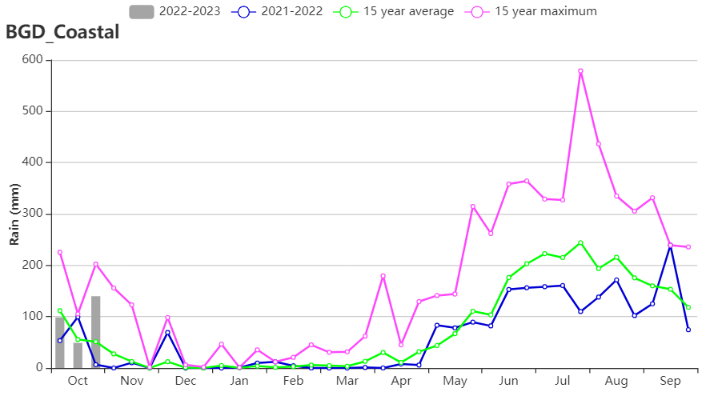
(h) Crop condition development graph based on NDVI (left) and rainfall profile (right) of Coastal region


(i) Crop condition development graph based on NDVI (left) and rainfall profile (right) of Gangetic plain

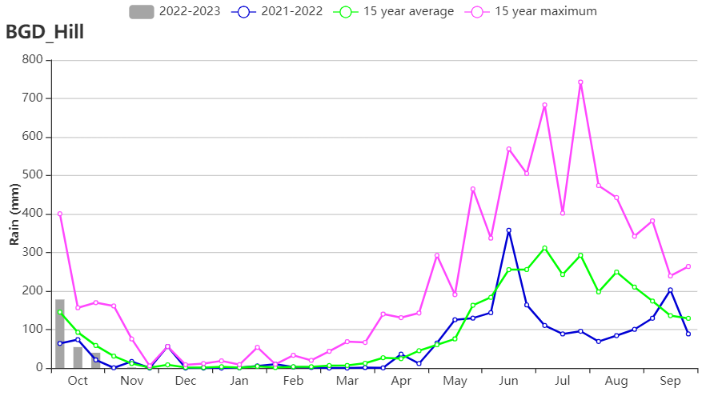
(j)Crop condition development graph based on NDVI (left) and rainfall profile (right) of Hills
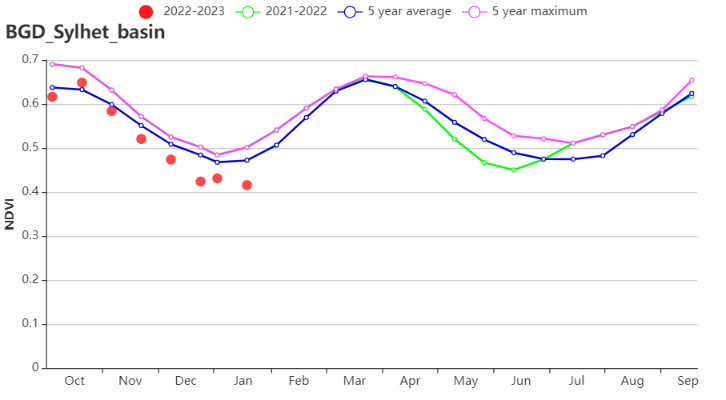
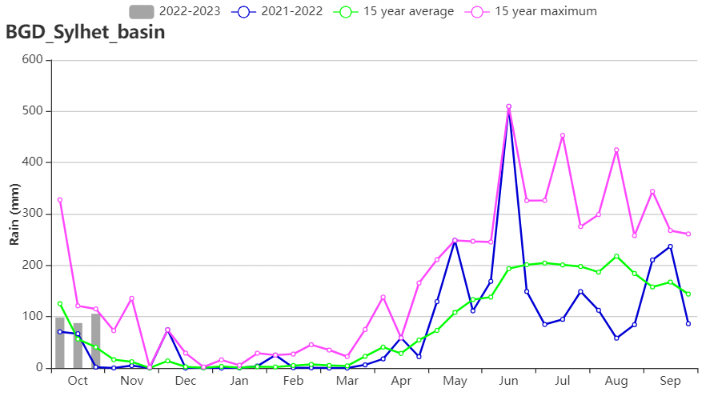
(k)Crop condition development graph based on NDVI (left) and rainfall profile (right) of Sylhet basin
Table 3.2 Bangladesh’s agroclimatic indicators by sub-national regions, current season’s values and departure from 15YA, October 2022- January 2023
Region | RAIN | TEMP | RADPAR | BIOMSS | |||||
Current (mm) | Departure (%) | Current (°C) | Departure (°C) | Current (MJ/m2) | Departure (%) | Current (gDM/m2) | Departure (%) | ||
Coastal region | 290 | 3 | 22.6 | 0.7 | 1054 | 3 | 641 | 1 | |
Gangetic plain | 217 | 4 | 21.0 | 0.2 | 984 | 2 | 545 | 1 | |
Hills | 283 | -21 | 21.0 | 0.3 | 1061 | 4 | 598 | -11 | |
Sylhet basin | 295 | 8 | 20.5 | -0.2 | 984 | 2 | 590 | 4 | |
Table 3.3 Bangladesh’s agronomic indicators by sub-national regions, current season’s values and departure from 5YA, October 2022- January 2023
Region | Cropped arable land fraction | Maximum VCI | |
Current (%) | Departure (%) | Current | |
Coastal region | 93 | 1 | 0.85 |
Gangetic plain | 97 | 0 | 0.94 |
Hills | 98 | 0 | 0.90 |
Sylhet basin | 90 | -2 | 0.87 |