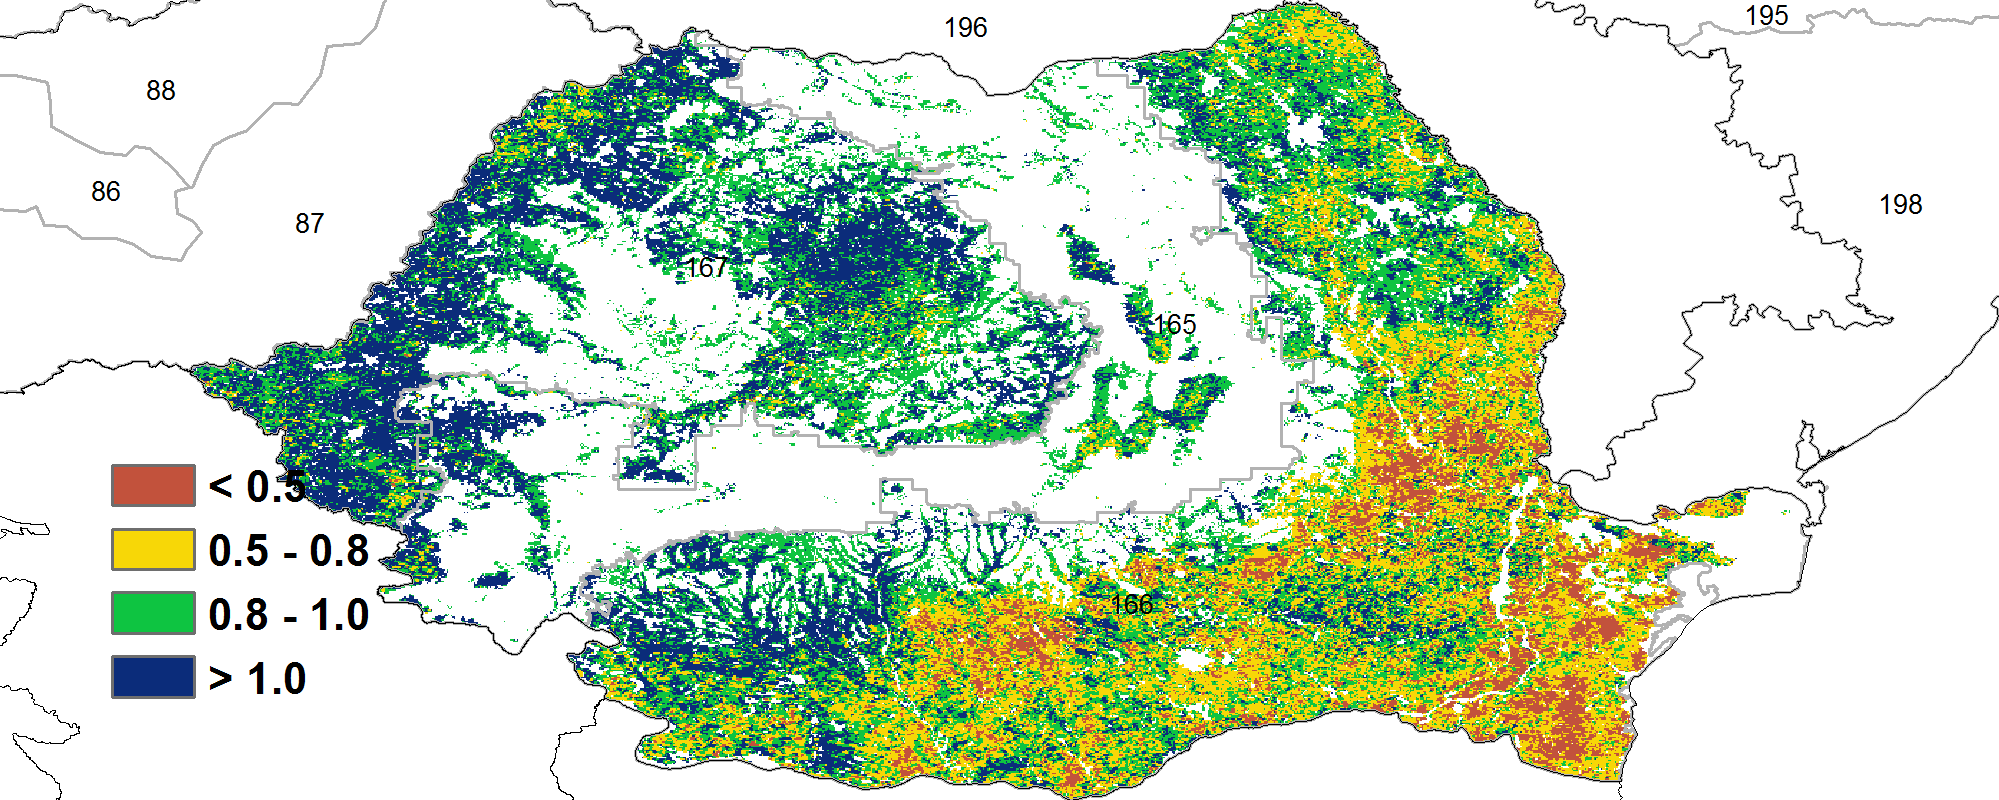
The reporting period includes the harvest of the 2022 maize and sugar beet crops and the sowing of the 2022-2023 winter wheat, which started in September. The agroclimatic indicators show that rainfall was 14% lower than average; TEMP was 2.5℃ higher than average. RADPAR was 2% higher than average and biomass was 1% lower than average. The nationwide NDVI profile shows that crop conditions were above average during most of the reporting period and above the 15 years maximum in early December. A rainfall deficit was observed in October. The moisture conditions started to improve in mid November, when rainfall surpassed the 15YA. According to the spatial pattern of NDVI in Romania, the west region and east region marked with blue and light green has a fluent and high crop condition ,which takes up most of Romania and for some areas marked with yellow and red, there is a sharp drop of NDVI in December, which may be results of snow cover. The CPI of Romania was above 1. All in all, conditions in Romania were close to average.
Regional analysis
More spatial detail is provided below for the three main agro-ecological zones: the Central mixed farming and pasture Carpathian hills, the Eastern and southern maize, wheat and sugar beet plains and the Western and central maize, wheat and sugar beet plateau.
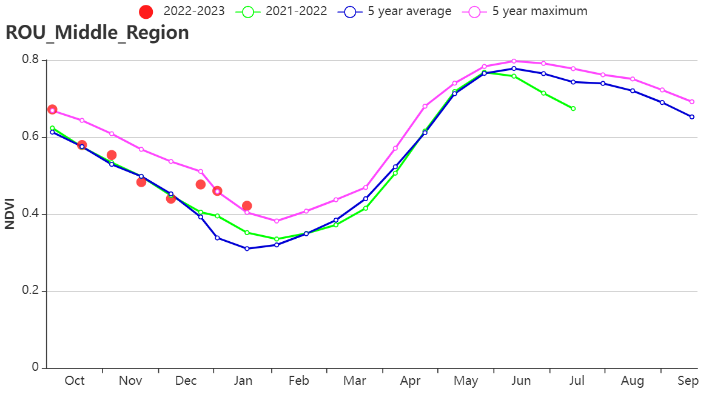
For the Central mixed farming and pasture Carpathian hills, compared to the 15YA, radiation increased by 1%, rainfall decreased by 4% while temperature increased 2.6℃ and BIOMSS increased by 15%. According to the NDVI development graph, crop conditions were around average until late December and rose to the 15 years maximum in January due to relatively warm weather. The regional average maximum VCI was at 1.00. Regional CALF was 100% and 4% higher than average. The NDVI spatial distribution shows that NDVI was fair throughout the reporting period (light green). The CPI of this region is 1.33. However, this zone occupies only a small fraction of cropland in Romania.
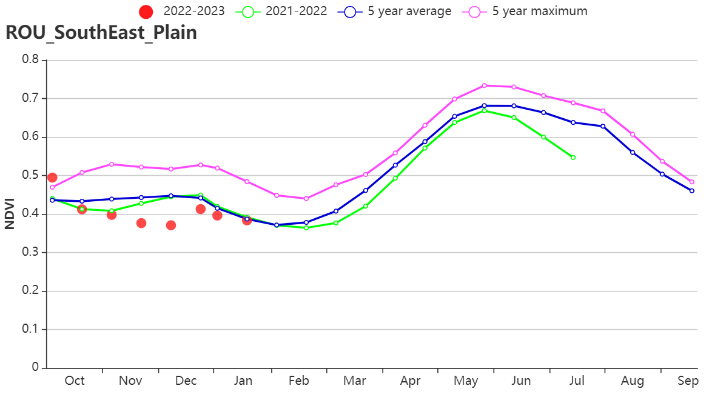
For the Eastern and Southern maize, wheat and sugar beet plains, rainfall decreased by 24%, temperature increased by 3.8℃, radiation increased by 2% and biomass decreased by 9% as compared to the 15YA. The NDVI development graph shows that crop conditions were below average starting in November. Regional CALF was only 81% and 5% lower than average. Maximum VCI value of this region was 0.80 and according to the distribution map, VCI values were below 0.80 in the southeast area of this sub-region (counties of Tulcea and Constanta), representing about 14.3% of the national cropland. The CPI of this region is 0.99. All in all, crop conditions can be assessed as slightly below average.
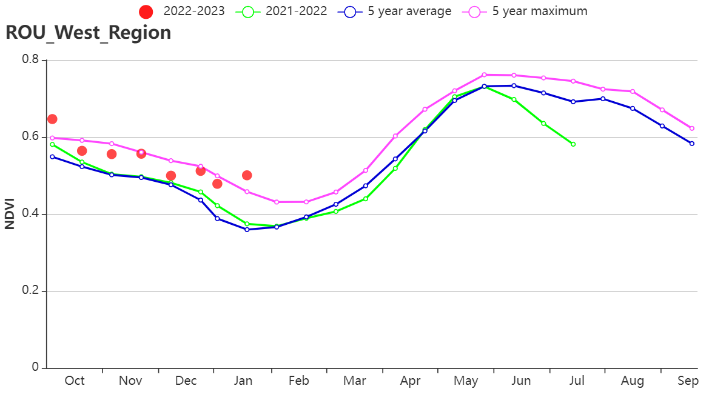
For the Western and central maize, wheat and sugar beet plateau, radiation was higher than average by 4%, temperature was 2.2℃ higher and rainfall was 4% lower and biomass increased by 8%. Spatial NDVI profiles show that crop conditions were above average throughout the reporting period. Regional CALF was 100%, 8% higher than average. Maximum VCI of this region was 1.04, and the spatial distribution was between 0.8 and 1.0 in most of the areas. The CPI of this region is 1.37. Crop condtions can be assessed as favorable.
Figure3.38 Romania’s crop condition, October 2022 - January 2023
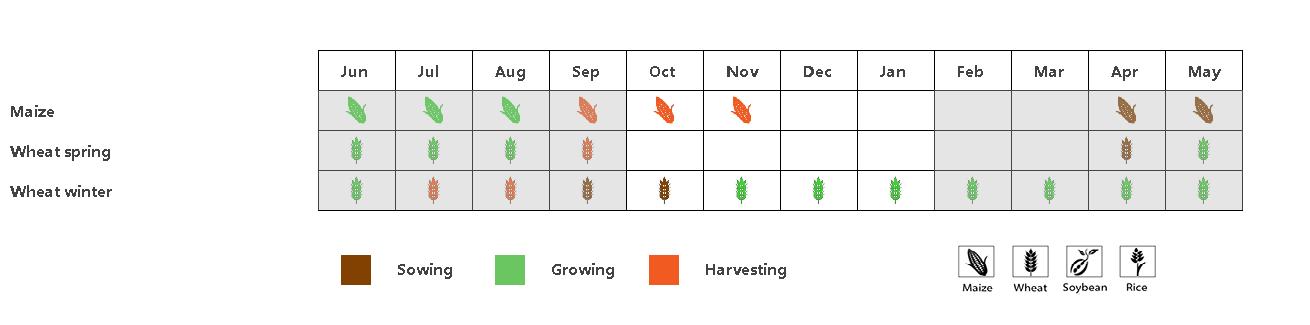
(a) Phenology of major crops
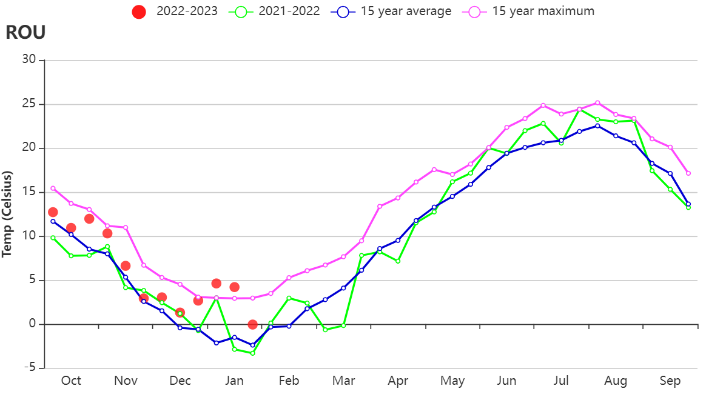
(b) Crop condition development graph based on NDVI (c) Maximum VCI
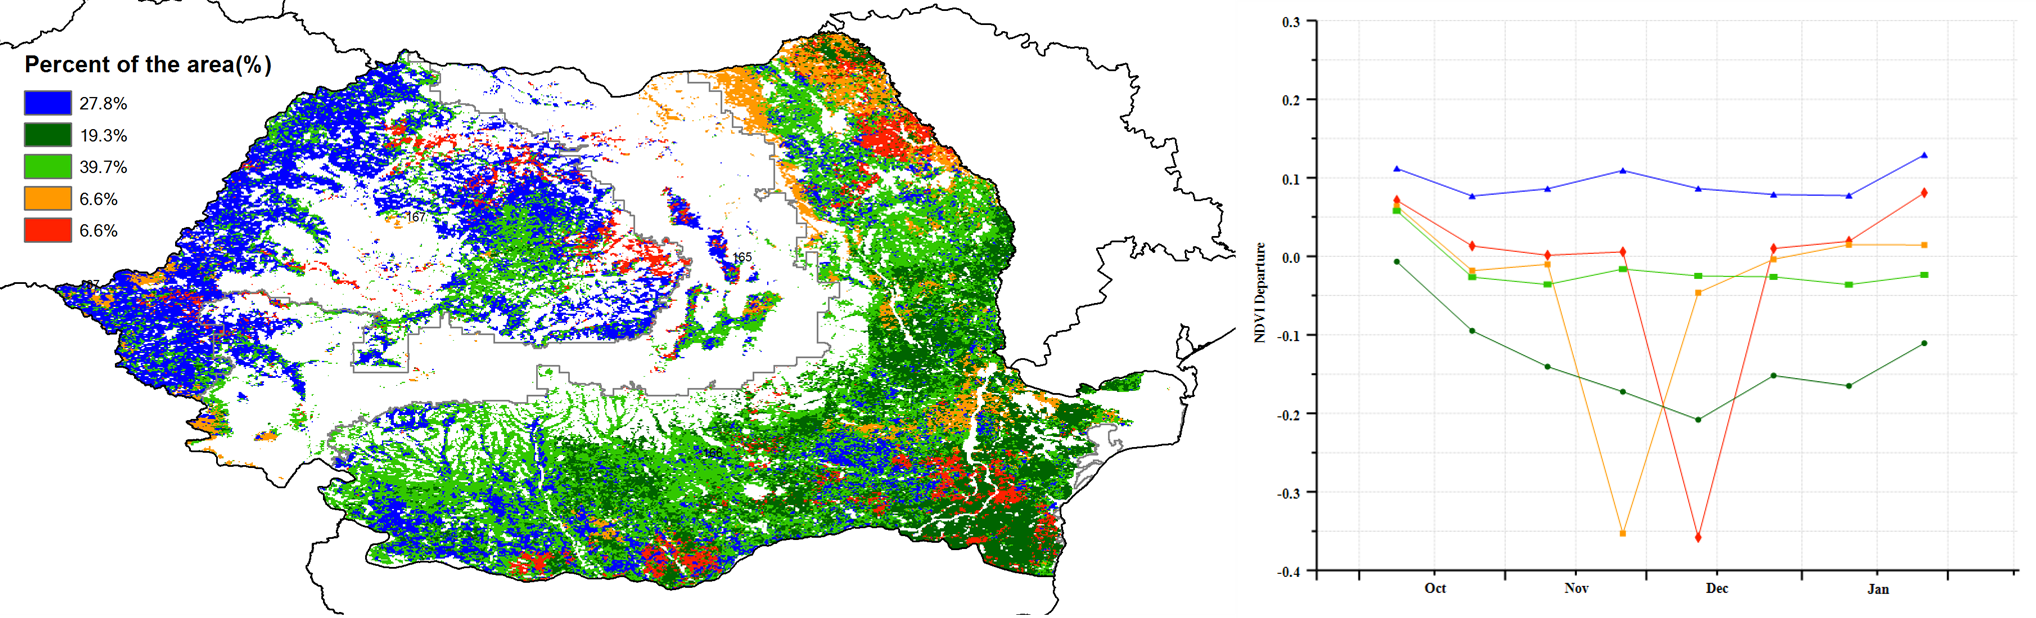
(d) Spatial NDVI patterns compared to 5YA (e) NDVI profiles
(f) Crop condition development graph based on NDVI (Central mixed farming and pasture Carpathian hills (left) and Eastern and southern maize, wheat and sugarbeet plains (right))
(g) Crop condition development graph based on NDVI (Western and central maize, wheat and sugar beet plateau)

(h) Rainfall index (i) Temperature index
Table 3.68 Romania's agroclimatic indicators by sub-national regions, current season’s values and departure from 15YA, October 2022-January 2023
| Region | RAIN | TEMP | RADPAR | BIOMSS | ||||
| Current(mm) | Departure from 15YA(%) | Current(°C) | Departure from 15YA(°C) | Current(MJ/m2) | Departure from 15YA(%) | Current(gDM/m2) | Departure from 15YA(%) | |
| Central mixed farming and pasture Carpathian hills | 251 | -4 | 4.6 | 2.6 | 380 | 1 | 466 | 15 |
| Eastern and southern maize wheat and sugarbeet plains | 183 | -24 | 6.7 | 2.8 | 391 | 2 | 418 | -9 |
| Western and central maize wheat and sugarbeet plateau | 240 | -4 | 5.5 | 2.2 | 380 | 4 | 477 | 8 |
Table 3.69 Romania's agronomic indicators by sub-national regions, current season’s values and departure from 5YA, October 2021-January 2022
| Region | CALF | Maximum VCI | |
| Current(%) | Departure from 5YA(%) | Current | |
| Central mixed farming and pasture Carpathian hills | 100 | 4 | 1.00 |
| Eastern and southern maize wheat and sugarbeet plains | 81 | 5 | 0.80 |
| Western and central maize wheat and sugarbeet plateau | 100 | 8 | 1.04 |