The monitoring period covers the transition from the rainy to the dry season in Cambodia. Rainy season early rice was in the harvesting period. Sowing of dry season early rice, dry season maize and soybean gradually started in November. Medium rice, late rice and floating rice gradually entered the harvesting stage in January.
During this monitoring period, the rainy season in Cambodia retreated relatively late and weather conditions were wetter than before. Compared to the 15YA average, rainfall (RAIN) in Cambodia was 22% higher, while temperature (TEMP) was 0.5℃ lower and radiation (RADPAR) was near average. The wetter weather favored the growth of medium and late rice, resulting in a potential biomass (BIOMASS) about 10% higher than average. The crop production index (CPI) was at 1.06. However, the excessive rainfall in October and November was not only unfavorable for the rainy season early rice and rainy season maize harvests, but also likely delayed the sowing of dry season rice, dry season maize and soybean, resulting in below average NDVI values in the NDVI time series curve. Meanwhile, the maximum VCI map shows that the VCIx value of crops in most areas was above 0.8, indicating normal growing conditions. However, there were also some areas where crops were growing poorly. The NDVI spatial clustering map also shows that 1) the condition of about 6% of the cultivated area (red colour) has been significantly below average since October, indicating that crop growth in these areas has been severely affected. These areas are mainly scattered in the north-west and south-east of the Tonle Sap lake. 2) Approximately 43.4% of the cultivated area (blue colour) had a crop NDVI that was close to average, indicating normal crop conditions. These areas are mainly located in the eastern shore of Tonle Sap Lake, the plain area of the lower Mekong Valley, and the southwestern shore area of Tonle Sap Lake. 3) The remaining cultivated areas (dark green, light green and orange colour) showed a similar NDVI pattern, all of which showed a significant decrease in October. However, these declines all recovered quickly to slightly below average, suggesting that crop condition in these areas may be slightly below average. And these sharp declines in NDVI were probably caused by cloud cover.
In summary, a combination of several agro-climatic indicators showed that crop growth in Cambodia was slightly below average during this monitoring period.
Regional analysis
Based on cropping systems, climatic zones and topographic conditions, four sub-national regions are described below: The Tonle Sap Lake area, a seasonally inundated freshwater lake with inflow and outflow from the Mekong River, the Mekong valley between Tonle Sap and Vietnam border, Northern plain and northeast, and the Southwest Hilly region along the Gulf of Thailand coast.
According to agro-climatic indicators, rainfall in the Tonle-sap region (agro-ecological subzone 117) was 34% higher than average, while temperature decreased by about 0.7°C, radiation was near average, and potential biomass was 13% higher. The crop condition index (CPI) was at 1.03. Due to the influence of cloud cover on satellite imagery, the synthetic NDVI in this area was well below average in early October and then recovered. However, it was still slightly below average, indicating that overall crop growth in this area was slightly below average.
The Mekong Valley region (agro-ecological subzone 118) is the main agricultural area in Cambodia. Rainfall in this region was significantly higher by 24% (RAIN), temperature was lower by 0.3°C (TEMP), radiation (RADPAR) was around average and potential biomass (BIOMASS) was higher by 12%. As shown in the NDVI spatial clustering map, most areas in this region (orange, light green and dark green colour) were affected by cloud and rain cover in October, resulting in a significantly below average crop NDVI. Subsequently, NDVI levels gradually recovered but were still slightly below average, possibly due to the delay in planting medium and late rice. In summary, crop growth in the region was slightly below average though the crop production index (CPI) was at 1.06.
For the Northern Plain and Northeast region (agro-ecological subzone 119), the region had 9% higher rainfall (RAIN), 0.4°C lower temperature (TEMP), average radiation (RADPAR) and 7% higher potential biomass (BIOMASS). The crop condition index (CPI) was at 1.08. The NDVI time series curve of the crop in this zone was always slightly below average until January, indicating slightly below average crop growth in this zone.
In the Southwest Hilly region (agro-ecological subzone 120), rainfall was 35% above average (RAIN), temperature was about 0.7°C lower (TEMP), radiation was near average (RADPAR) and potential biomass was about 12% higher (BIOMASS). Although the VCIx index of the region was as high as 0.91 and the crop production index was at 1.17, the NDVI time series curve of the crop remained slightly below average until January, indicating that crop growth in this zone was also slightly subpar.
Figure 3.27 Cambodia's crop condition, October 2022 - January 2023
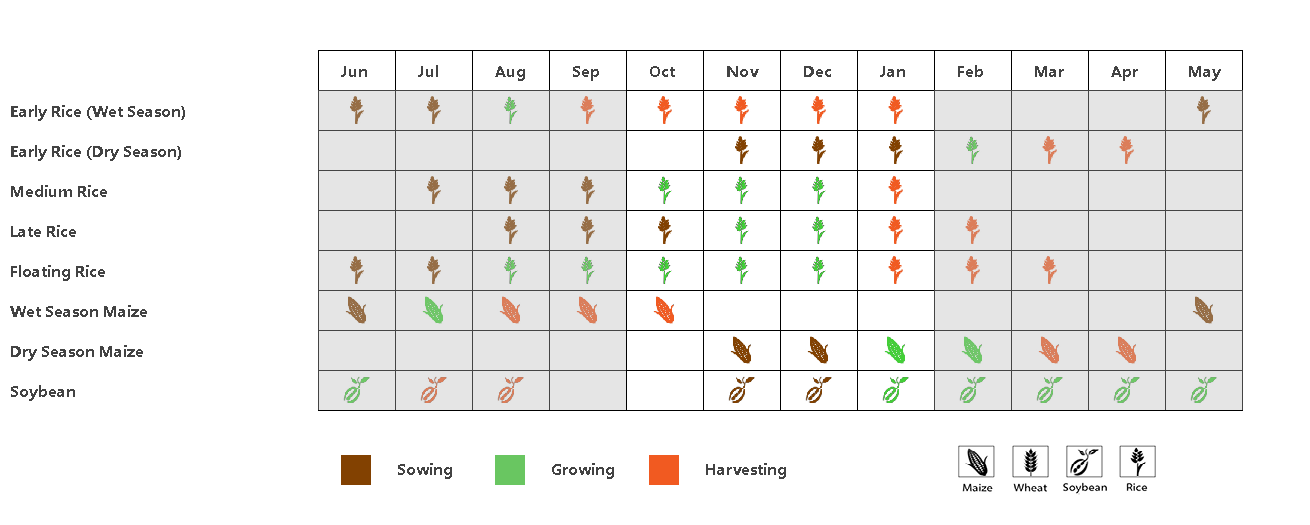
(a) Phenology of major crops
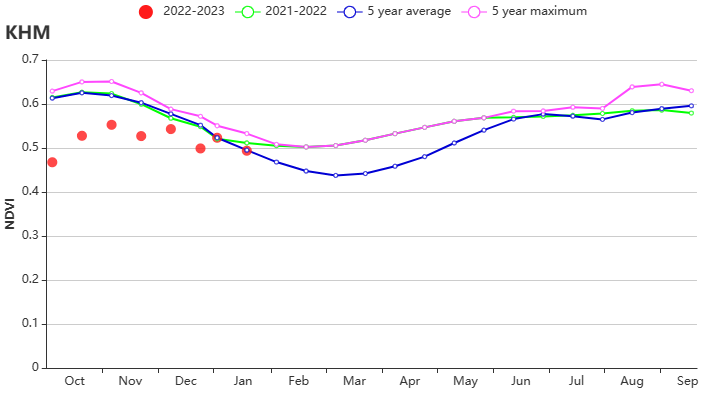
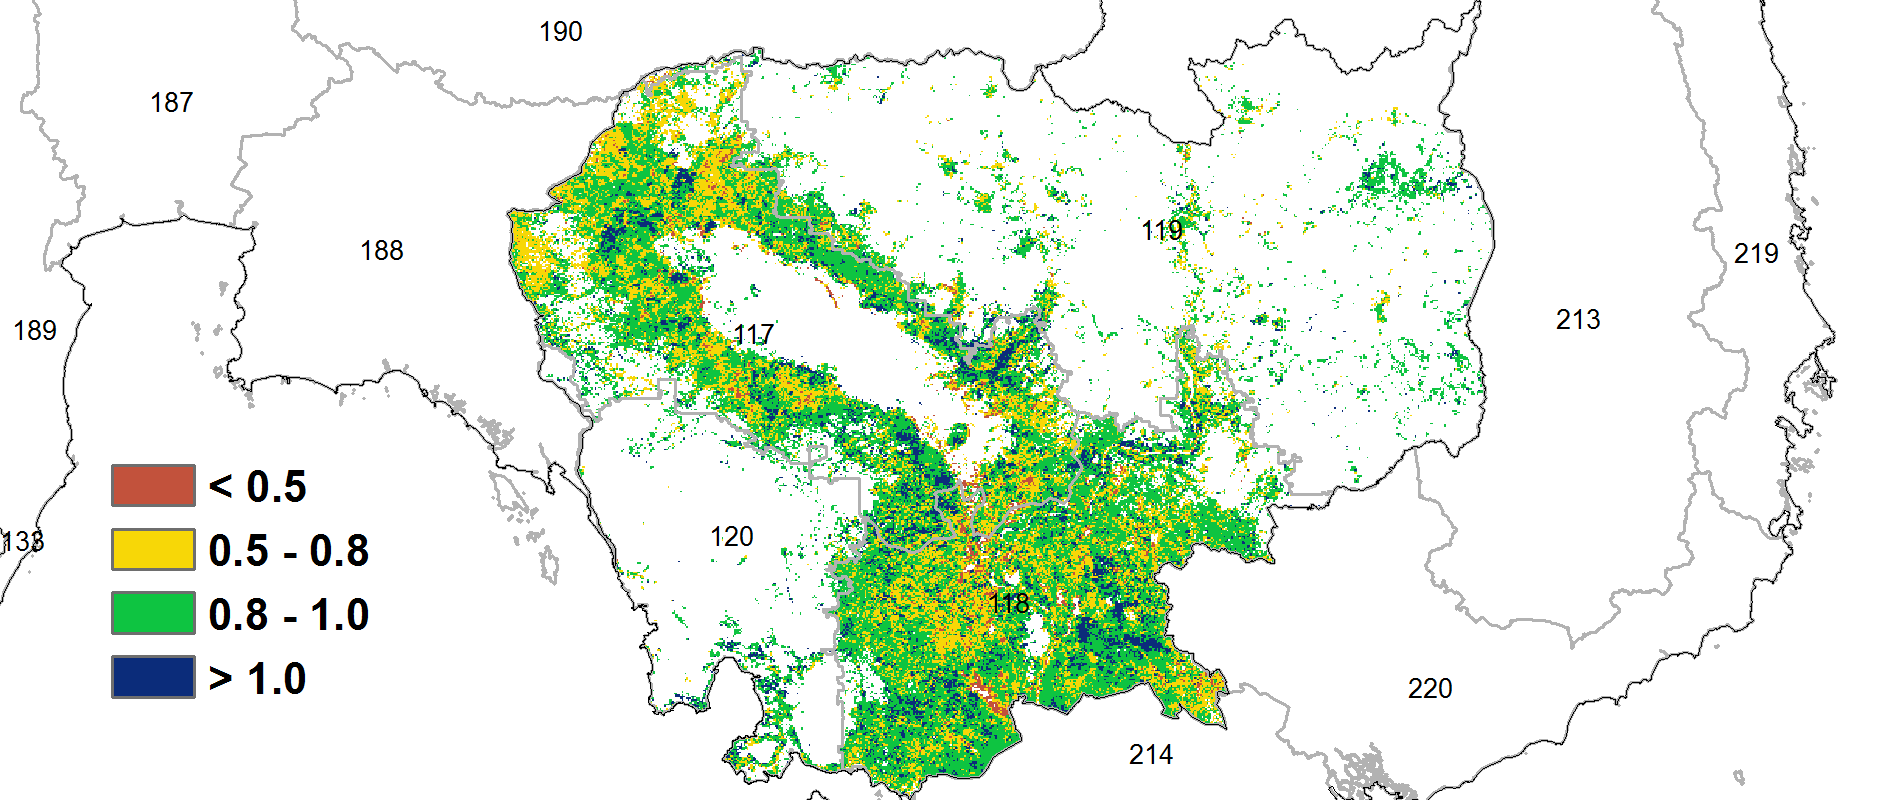
(b) Crop condition development graph based on NDVI (c) Maximum VCI
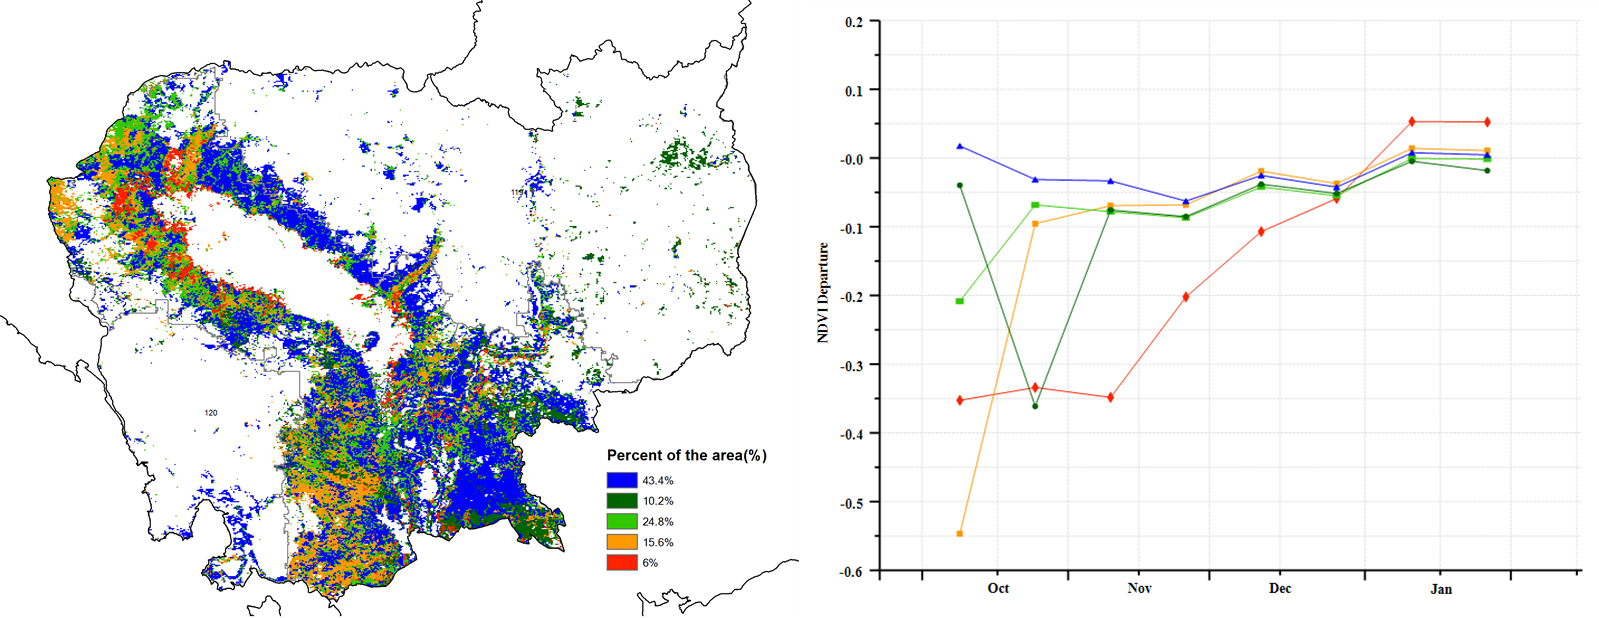
(d) Spatial NDVI patterns compared to 5YA (e) NDVI profile
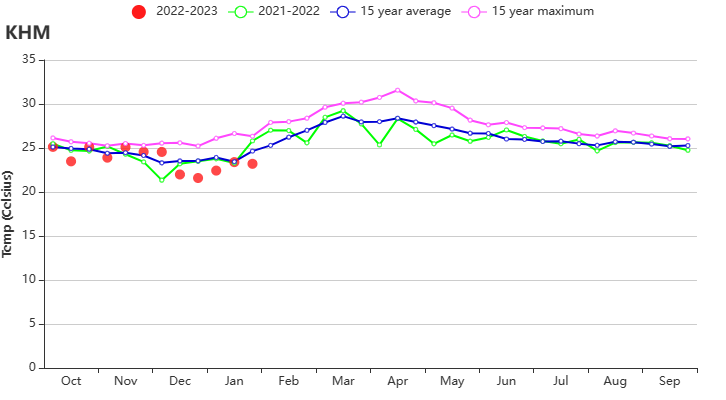
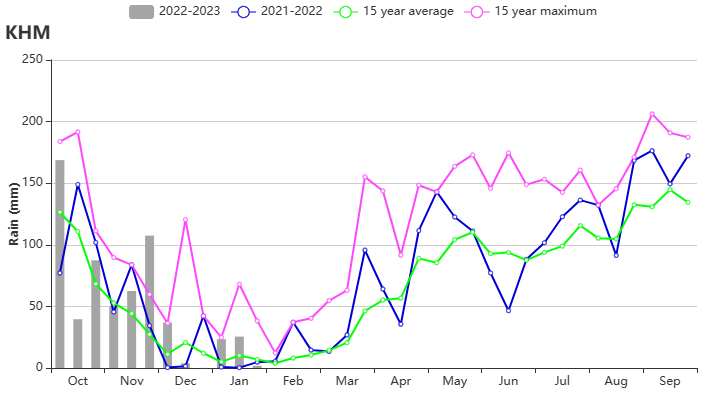
(f) Time series temperature profile (left) and rainfall profile (right)
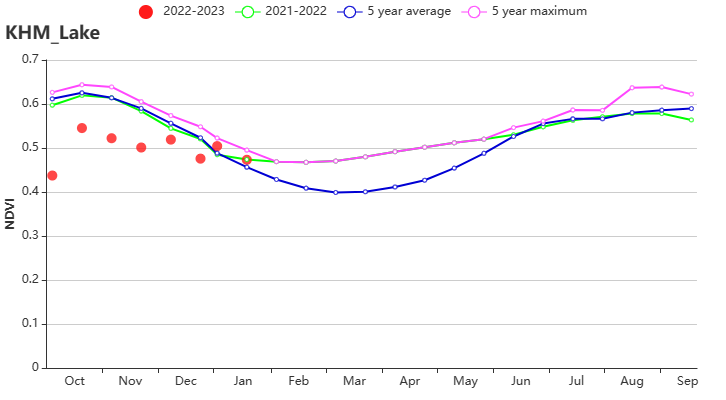
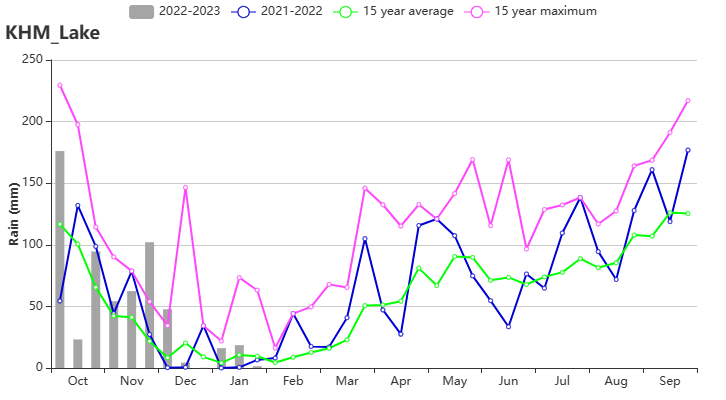
(g) Crop condition development graph based on NDVI (left) and time series rainfall profile (right) in Tonle Sap Lake region
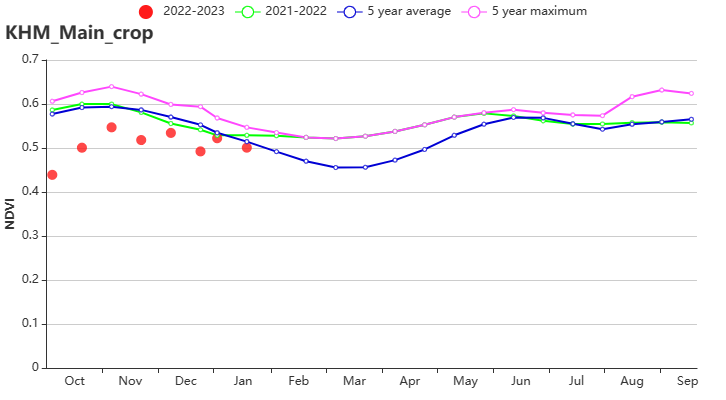
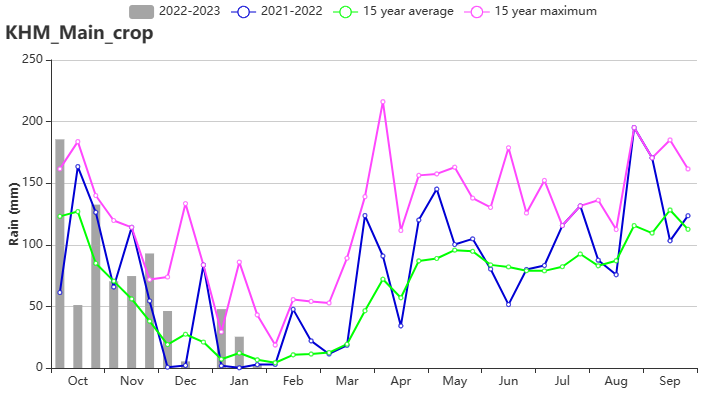
(h) Crop condition development graph based on NDVI (left) and time series rainfall profile (right) in Mekong valley region
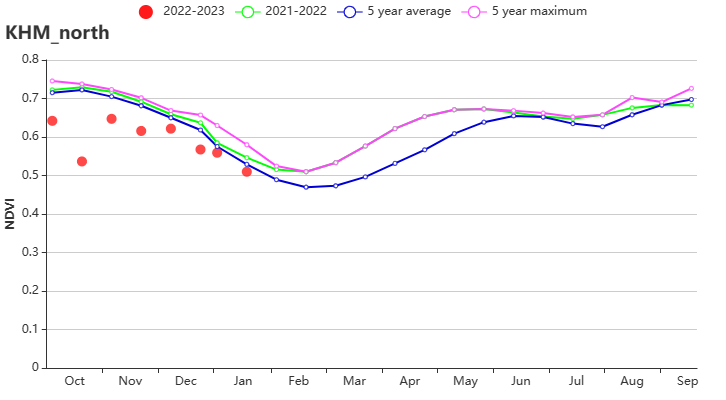
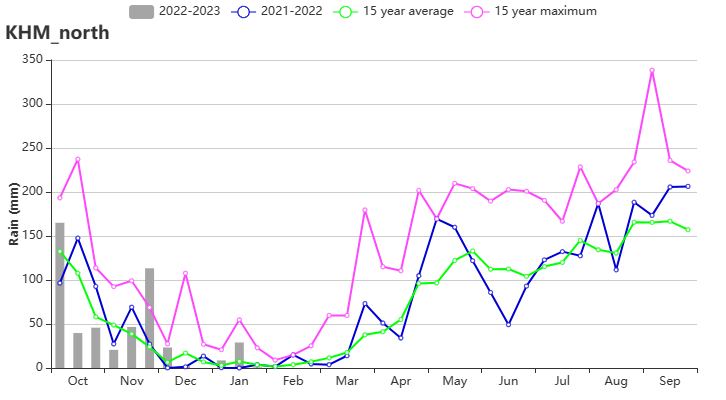
(i) Crop condition development graph based on NDVI (left) and time series rainfall profile (right) in Northern plain and northeast region
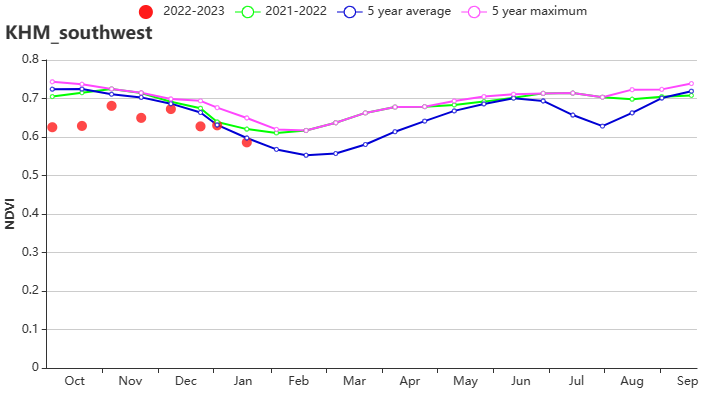
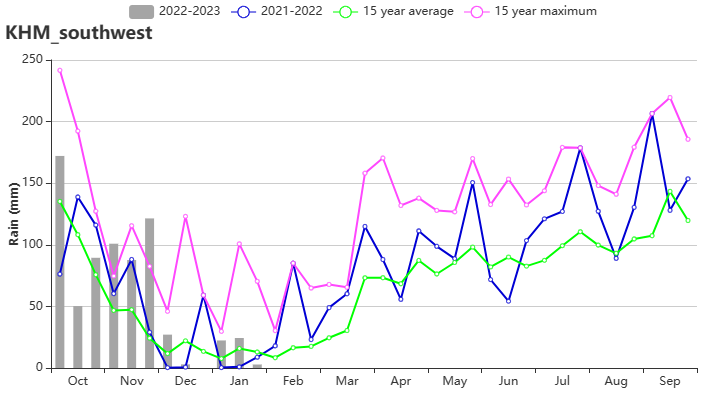
(j) Crop condition development graph based on NDVI (left) and time series rainfall profile (right) in Southwest hilly region
Table 3.46 Cambodia's agro-climatic indicators by sub-national regions, current season's values, and departure from 15YA, October 2022 - January 2023
| Region | RAIN | TEMP | RADPAR | BIOMSS | ||||
| Current(mm) | Departure from 15YA(%) | Current(°C) | Departure from 15YA(°C) | Current(MJ/m2) | Departure from 15YA(%) | Current(gDM/m2) | Departure from 15YA(%) | |
| Tonle-sap | 601 | 34 | 23.4 | -0.7 | 1062 | 0 | 1042 | 13 |
| Mekong valley between Tonle-sap and Vietnam border | 735 | 24 | 24.6 | -0.3 | 1091 | 0 | 1222 | 12 |
| Northern plain and northeast | 495 | 9 | 23.6 | -0.4 | 1062 | 0 | 951 | 7 |
| Southwest Hilly region | 701 | 35 | 22.3 | -0.7 | 1068 | -1 | 1142 | 12 |
Table 3.47 Cambodia's agronomic indicators by sub-national regions, current season's values, and departure from 5YA, October 2022 - January 2023
| Region | CALF | Maximum VCI | |
| Current(%) | Departure from 5YA(%) | Current | |
| Tonle-sap | 98 | -1 | 0.84 |
| Mekong valley between Tonle-sap and Vietnam border | 96 | -1 | 0.85 |
| Northern plain and northeast | 99 | 0 | 0.87 |
| Southwest Hilly region | 100 | 0 | 0.91 |
