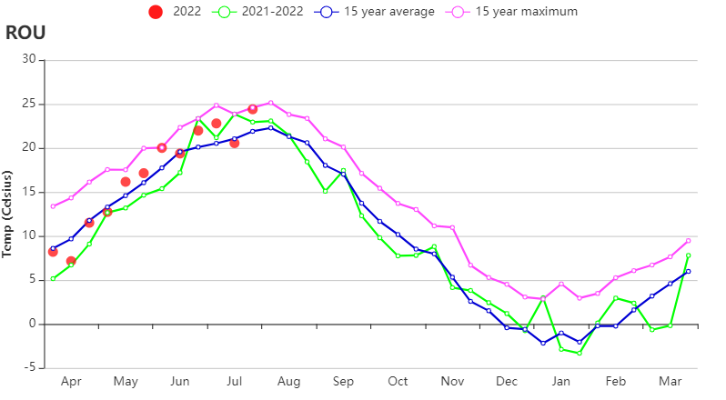
During this reporting period, maize and spring wheat were sown, while winter wheat was harvested in July. At the national level, rainfall was 52% below average, average temperature was 0.6℃ higher and radiation was slightly above average (+3%). The significant decrease in rainfall and the rise of temperature caused a large biomass decrease (-24%). The CALF of Romania remained unchanged (100%) and the maximum VCI was only 0.82. The rainfall time series shows that precipitation was far below average in May, early June and July, below 20 mm, impacting the growth of maize and wheat. In contrast to the lower rainfall, the temperature was above average for most of the reporting period and even reached the 15 years maximum in late July. The VHI map shows that drought conditions were serious in the eastern region. According to the NDVI development curve, crop conditions were below average from April to June. Only 6% (green line) of Romain cropland experienced a change from a negative to a positive departure from the average NDVI trend during the reporting period. The proportion of irrigated cropland in Romania is only 4%. Crop conditions are assessed as unfavorable, especially for the summer crops.
监测期内,罗马尼亚玉米与春小麦进入播种期,7月份冬小麦开始收割。全国范围内,降水相比平均水平偏低52%,温度偏高0.6℃,光合有效辐射略偏高3%。降水的严重不足与升温共同导致潜在生物量偏低24%。罗马尼亚耕地种植比例维持在100%,最佳植被状况指数仅为0.82。降水在五月至七月均大幅低于平均水平,下降幅度超过20毫米,这对小麦和玉米的生长造成不利影响。与降水变化相反,平均温度在监测期内的大部分时间高于平均水平,在七月下旬升至15年最高点。VHI分布图显示罗马尼亚东部地区的旱情严重,NDVI时间序列显示在4月至6月作物长势均低于平均水平,仅6%的区域在监测期内出现长势好转。罗马尼亚耕地灌溉比例仅4%,偏差的作物长势对产量将造成不利影响。
Regional analyses
区域分析
More details are provided below for three main agro‐ecological zones: the Central mixed farming and pasture Carpathian hills (160), the Eastern and southern maize, wheat and sugar beet plains (161) and the Western and central maize, wheat and sugar beet plateau (162).
该国的三个主要农业生态区为西部地区、中部地区以及南部和东部平原地区三个区域。
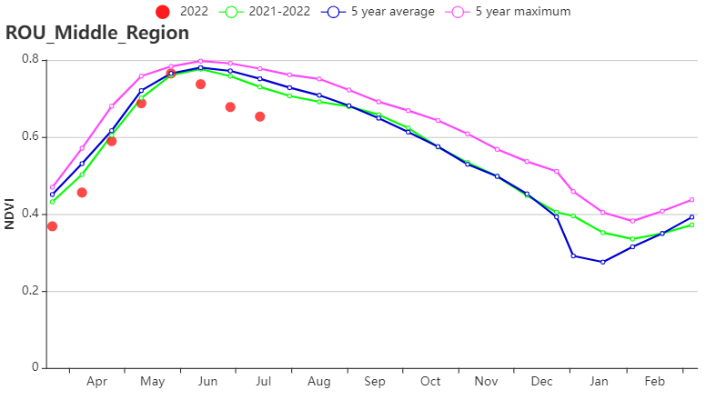
For the Central mixed farming and pasture Carpathian hills, compared to the 15YA, rainfall decreased by 53%, temperature was up by 0.8℃, radiation was above average (RADPAR +5%) and BIOMSS decreased by 23%. According to the NDVI development, crop conditions were below average during the reporting period. The regional average VCI maximum was 0.90. APSI was 1.03. This region occupies only a small part of cropland in Romania, thus the below-average vegetation conditions have little impact on Romania's crop production.
中部地区的降水相比平均偏低53%,平均温度偏高0.8℃,光合有效辐射偏高5%,潜在生物量偏低23%。NDVI时间过程线显示作物长势在监测期内均低于平均水平。区域VCIx均值为0.90,生产形势指数为1.03。该分区仅占罗马尼亚耕地一小部分,该区域的减产对全国影响较小。
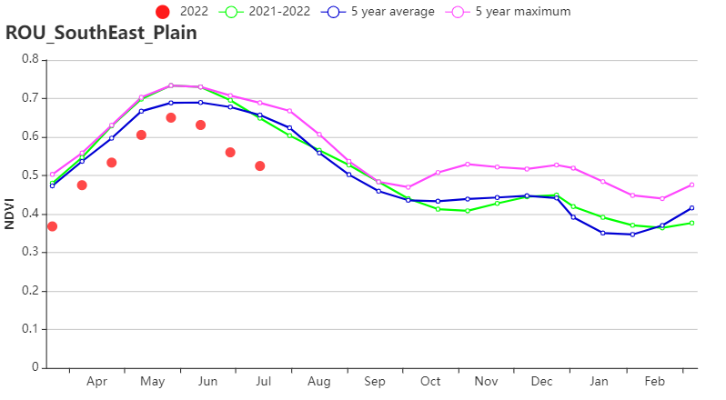
For the Eastern and Southern maize, wheat and sugar beet plains, rainfall decreased by 53%, the temperature was 1.0ºC higher than average and radiation remained average. This resulted in a reduced estimate of biomass (-24%). The NDVI development graph shows that crop conditions dropped to below average during the reporting period. The VCIx value of this region was only 0.80. According to the distribution map, the yellow and blue NDVI profile line region in the southeast (counties of Tulcea and Constanta) dropped largely in June and July, meanwhile, the maximum VCI values in this area were below 0.5. APSI was 0.99. All indicators show that the crop condition in this region was unfavorable.
南部和东部平原地区的降水相比平均偏低53%,平均温度偏高1.0℃,光合有效辐射处于平均水平。降水的大幅降低导致潜在生物量偏低24%。NDVI过程线显示作物长势在监测期内低于平均水平。最佳植被状况指数仅为0.80。NDVI空间分布图显示,东南部的部分区域(图尔恰与康斯坦萨地区)在六月和七月出现大幅度下降,该区域VCIx最大值低于0.5,农业生产形势指数为0.99。全部指数显示区域作物长势较差。
For the Western and central maize, wheat and sugar beet plateau, rainfall was lower than average by 51%. Temperature was also higher than average by 0.1℃, radiation was also higher (RADPAR +5%) and biomass decreased by 26%. Maximum VCI of this region was 0.85. It ranged considerably in this region (0.5 to 1.0). APSI was 1.04. The spatial NDVI pattern shows that NDVI was also decreasing in the central region (blue line), which indicates that crop conditions were unfavorable.
西部地区的降水相比平均偏低51%,温度偏高0.1℃,光合有效辐射偏高5%,潜在生物量偏低26%。最佳植被状况指数为0.85,且空间分布变化较大(0.5-1.0),农业生产形势指数为1.04。NDVI在中部地区较低,显示该区域的作物长势较弱。
Figure 3.37 Romania's crop condition, April–July 2022
图3.37 2022年4月-7月罗马尼亚作物长势
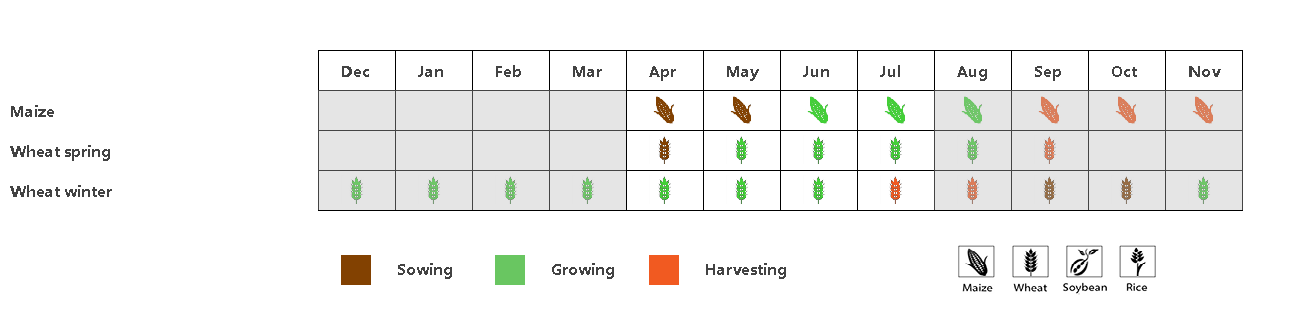
(a). Phenology of major crops
(a). 主要作物物候历

(b) Crop condition development graph based on NDVI
(b) 基于NDVI的作物生长过程线

(c) Maximum VCI
(c) 最佳植被状况指数

(d) Spatial NDVI patterns compared to 5YA
(d) NDVI距平空间聚类图(与5年平均相比) (e) NDVI距平聚类过程线
(f) Crop condition development graph based on NDVI (Central mixed farming and pasture Carpathian hills (left) and Eastern and southern maize, wheat and sugar beet plains (right))
(f)基于 NDVI 的作物生长过程线(中部地区(左)、南部和东部平原地区(右))

(g) Crop condition development graph based on NDVI (Western and central maize, wheat and sugar beet plateau)
(g)基于 NDVI 的作物生长过程线(西部地区)

(h) Time series rainfall profile
(i) Time series temperature profile
Table 3.65 Romania's agroclimatic indicators by sub-national regions, current season's values and departure from 15YA, April–July 2022
表3.65 罗马尼亚农业生态分区2022年4月-7月与过去15年(15YA)同期农业气象指标
| 区域 | 累计降水 | 平均气温 | 光合有效辐射 | 潜在生物量 | ||||
| 当前值(mm) | 距平(%) | 当前值(℃) | 距平(℃) | 当前值(MJ/m2) | 距平(%) | 当前值(gDM/m2) | 距平(%) | |
| 中部地区 | 203 | -53 | 14.9 | 0.8 | 1361 | 5 | 685 | -23 |
| 南部和东部平原地区 | 157 | -53 | 18.2 | 1.0 | 1345 | 2 | 665 | -24 |
| 西部地区 | 179 | -51 | 15.9 | 0.1 | 1395 | 5 | 649 | -26 |
Table 3.66 Romania's agronomic indicators by sub-national regions, current season's values and departure from 5YA, April – July 2022
表3.66 罗马尼亚农业生态分区2022年4月-7月与近5年(5YA)同期农情指标
| 区域 | 耕地种植比例 | 最佳植被指数 | |
| 当前值(%) | 距平(%) | 当前值 | |
| 中部地区 | 100 | 0 | 0.9 |
| 南部和东部平原地区 | 100 | 0 | 0.8 |
| 西部地区 | 100 | 0 | 0.85 |