During the reporting period, winter wheat was harvested from early to mid-June, while summer maize was planted in late June. The crop conditions in the Loess region were close to the 5YA.
The CropWatch Agroclimatic Indicators (CWAIs) in the Loess Region show that the weather conditions were generally normal, precipitation was below average by 8%, the temperature increased by 0.8℃, and radiation was above the 15YA by 6%. Due to the overall low precipitation, potential biomass dropped by 3% compared to the 15YA. During the monitoring period, the precipitation exceeded the 15-year maximum in late April and mid-July, resulting in flooding in some areas of Gansu and Shanxi, while the precipitation remained below average from early May to early July. Temperatures fluctuated from April to May, and were slightly above average from June to early July, then dropped to below average in late-July.
As can be seen from the regional NDVI development graph, the crop conditions were generally close to the 5YA during the monitoring period, except for June, which was significantly lower than the average level due to the extreme high temperature weather. NDVI clusters and profiles show that crop conditions in most regions were close to normal. Approximately 20.2% of the region was above average from late April to mid-June, mainly in Shanxi and Shaanxi provinces. In addition, about 12.9% of the area was below average from June to early July, mainly in central Gansu and northwestern Henan. The Maximum VCI map shows high VCIx values in most cropped areas of the region with an average value of 0.89 but the VCIx was below 0.5 in central Gansu. CALF was at 96% which is 1% above the 5YA. The APSI index of the region is greater than 1, so the agricultural production situation is improving. In conclusion, the agricultural conditions in the Loess region were close to average, and the production situation in central Gansu Province still depends on subsequent agro-climatic conditions.
Figure 4.11 Crop condition China Loess region, April - July 2022
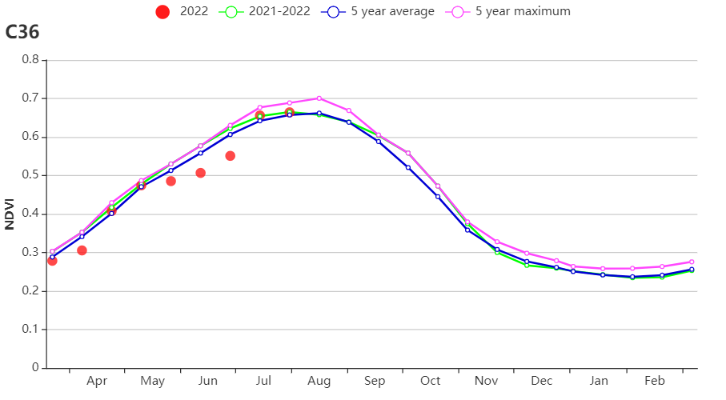
Figure.a Crop condition development graph based on NDVI
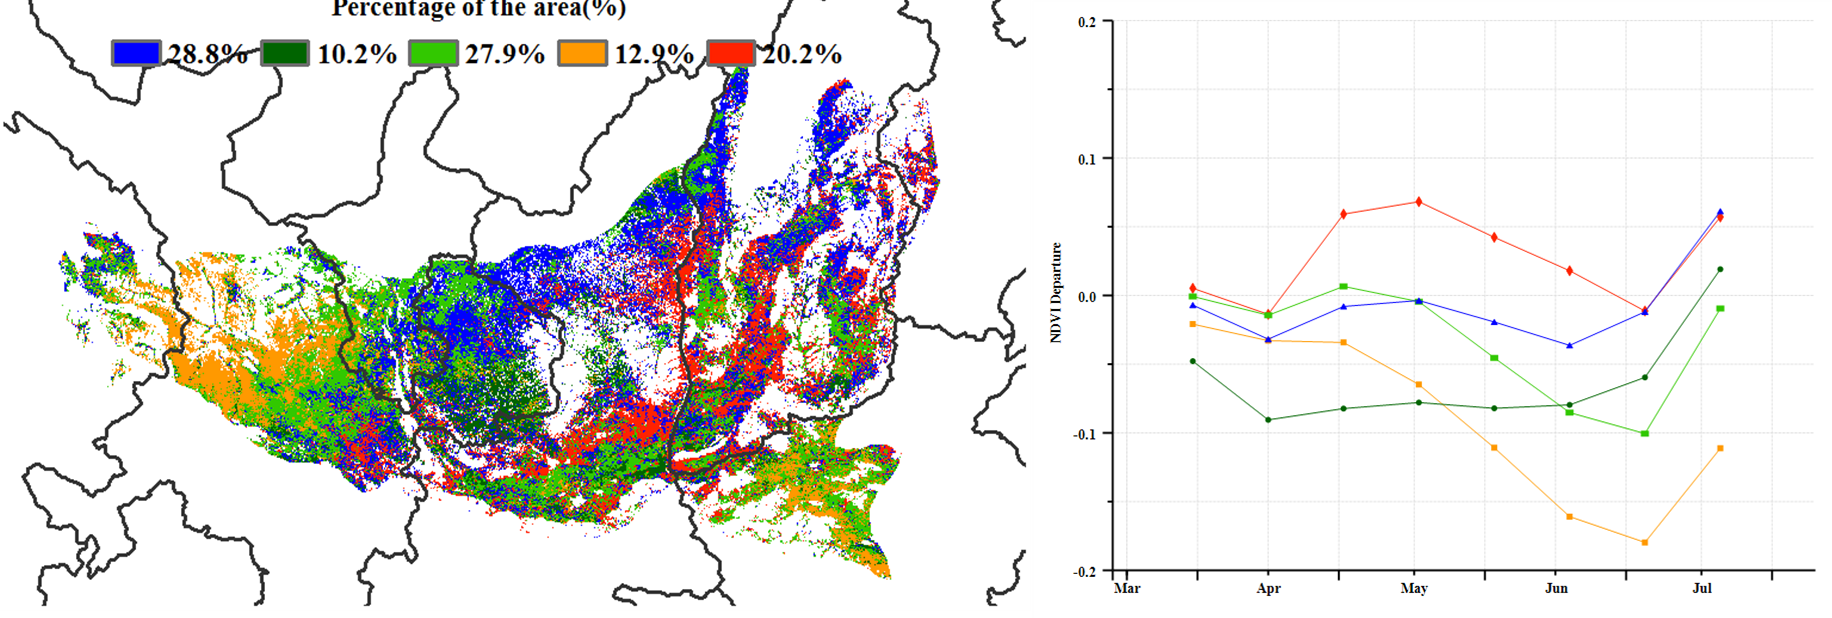
Figure.b Spatial distribution of NDVI profiles

Figure.c Time series rainfall profile

Figure.d Time series temperature profile
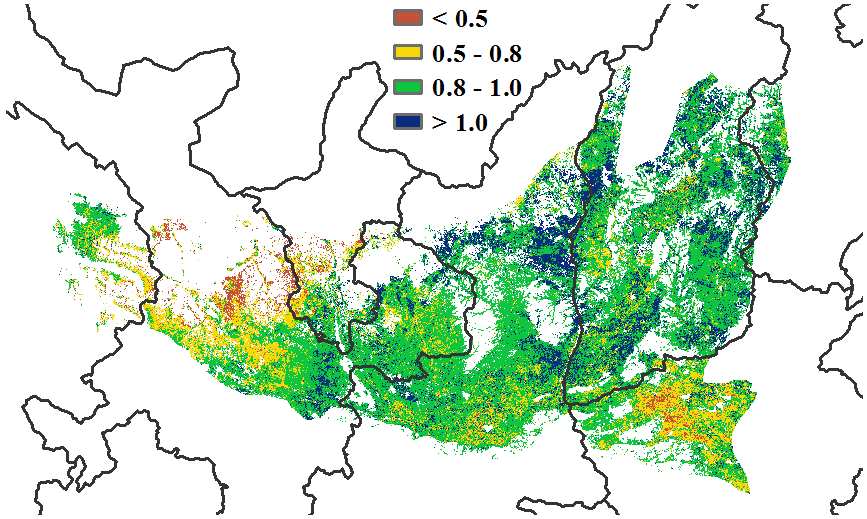
Figure.e Maximum VCI
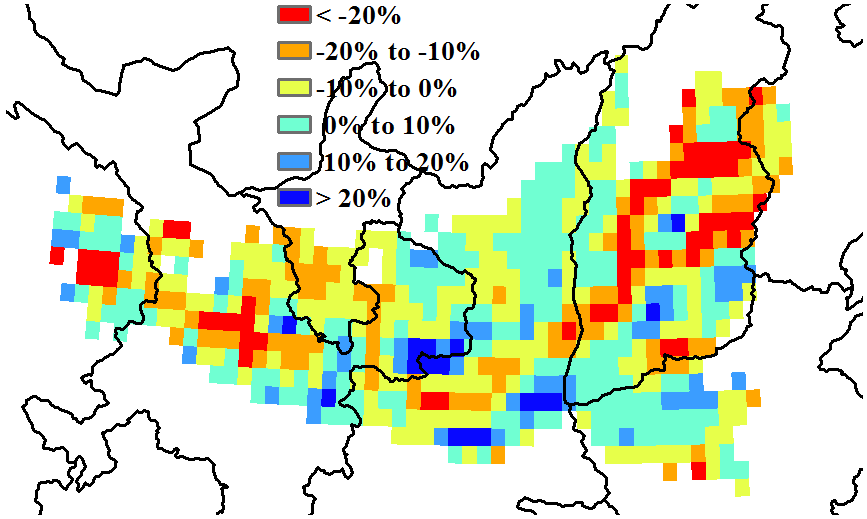
Figure.f Potential biomass departure from 5YA
| code | name | RAIN Current (mm) | RAIN 15YA Departure (%) | TEMP Current (°C) | TEMP 15YA Departure (°C) | RADPAR Current (MJ/m2 | RADPAR 15YA Departure (%) | BIOMSS Current (gDM/m2) | BIOMSS 15YA Departure (%) | CALF | CALF departure | VCI |
| C36 | Loess region | 261 | -8 | 17.9 | 0.8 | 1443 | 6 | 766 | -3 | 96 | 1 | 0.89 |