The reporting period covers the planting of spring wheat and summer, which ended in late May. Winter wheat harvest started in July. The nationwide rainfall reached 338 mm, which was 6% above 15YA average. Solar radiation (RADPAR -1%) and temperature (-1.0°C) were slightly below the 15YA, the potential biomass slightly decreased by -1%. Only about 0.4% of the crop land is irrigated and rainfall is a key factor controlling crop growth. Agronomic conditions were shown as favorable: very good values for VCIx (0.93) and cropped arable land fraction (CALF 100%) were observed.
The NDVI development graph was generally below the 5-year average from April to early May, but recovered to average levels in June. The spatial pattern showed large variability. On about 63.4% of the cropped area, crop conditions were close to or above the 5-year average. About 36.6% of cropped areas were 0.1 NDVI units below the average, mostly scattered in the north-east and along the northern-western border. Average national VCIx exceeded 0.93, indicating fair crop prospects in most crop areas. The agricultural production situation index was above 1.0 (CPI, 1.15), indicating a good prospect.
Overall, solar radiation deficit due to snow cover and rainy weather in the previous season have not constrained crop growth, and agronomic conditions were satisfactory during the current monitoring period, which indicate good winter wheat production and summer crop development.
Regional analysis
Based on cropping system, climatic zones and topographic conditions, regional analyses are provided for three agro-ecological zones (AEZ), including Northern Belarus (028, Vitebsk, northern area of Grodno, Minsk and Mogilev), Central Belarus (027, Grodno, Minsk and Mogilev and Southern Belarus (029) which includes the southern halves of Brest and Gomel regions.
Northern Belarus recorded a minor decrease of radiation (-1%) and temperature (-1.0°C) but significant increase of rainfall (+22%). Therefore, BIOMSS was expected to increase by 9%. The VCIx had reached 0.95, CALF had reached 100%, with an CPI of 1.18. The NDVI development curve was close to average in April, early May and June. Overall conditions were generally favorable.
Central Belarus experienced a minor decrease in solar radiation (-1%) and temperature (-0.9°C) as well as rainfall (-2%). Potential biomass slightly decreased by about 4%. High CALF (100%), VCIx (0.92) and CPI (1.14) were also recorded. Similar to Northern Belarus, the NDVI growth curve remained close to the long-term average trend from April to June.
Precipitation in Southern Belarus had dropped by 21%, while temperature and radiation were slightly lower by 1.0°C and 2%, respectively. Potential biomass was estimated to have a large decrease (-16%). The CALF and the VCIx were 100% and 0.92 respectively, with an CPI of 1.13. The average NDVI development curve suggests that from April to June, crop conditions were generally close to average for most of the time, but the impact of water deficit might have depressed NDVI development in July.
In summary, although Northern and Central Belarus experienced different agroclimatic conditions in the current season, agronomic situation for both regions were generally favorable. But for Southern Belarus, the rainfall deficit may have caused a water shortage and adversely impacted crop production.
Figure 3.10 Belarus’s crop condition, April – July 2022.

(a). Phenology of major crops
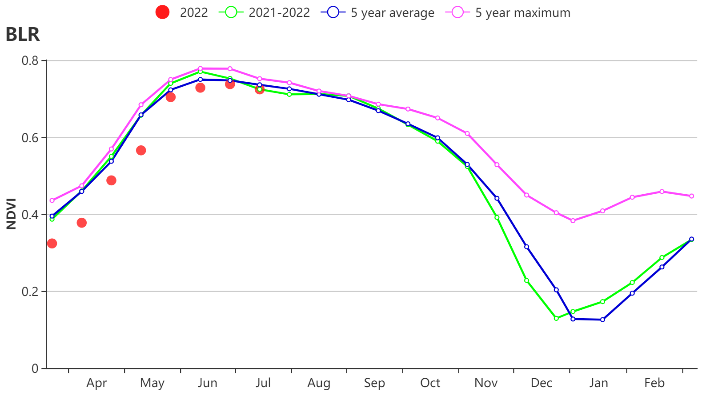
(b) Crop condition development graph based on NDVI
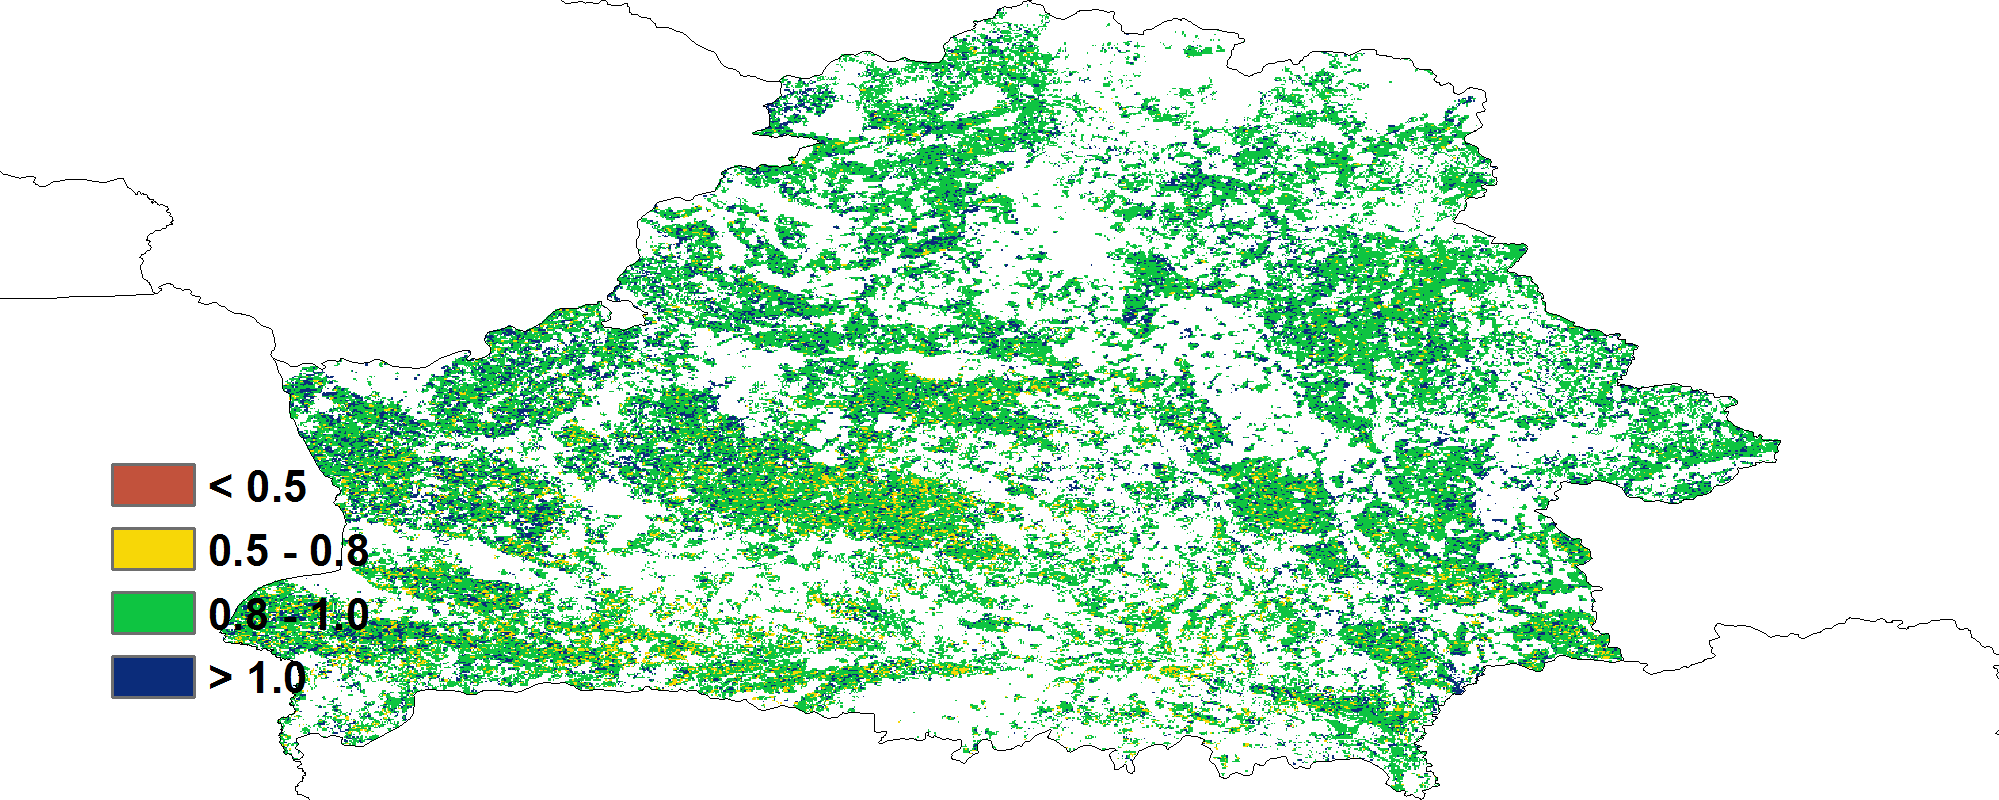
(c) Maximum VCI
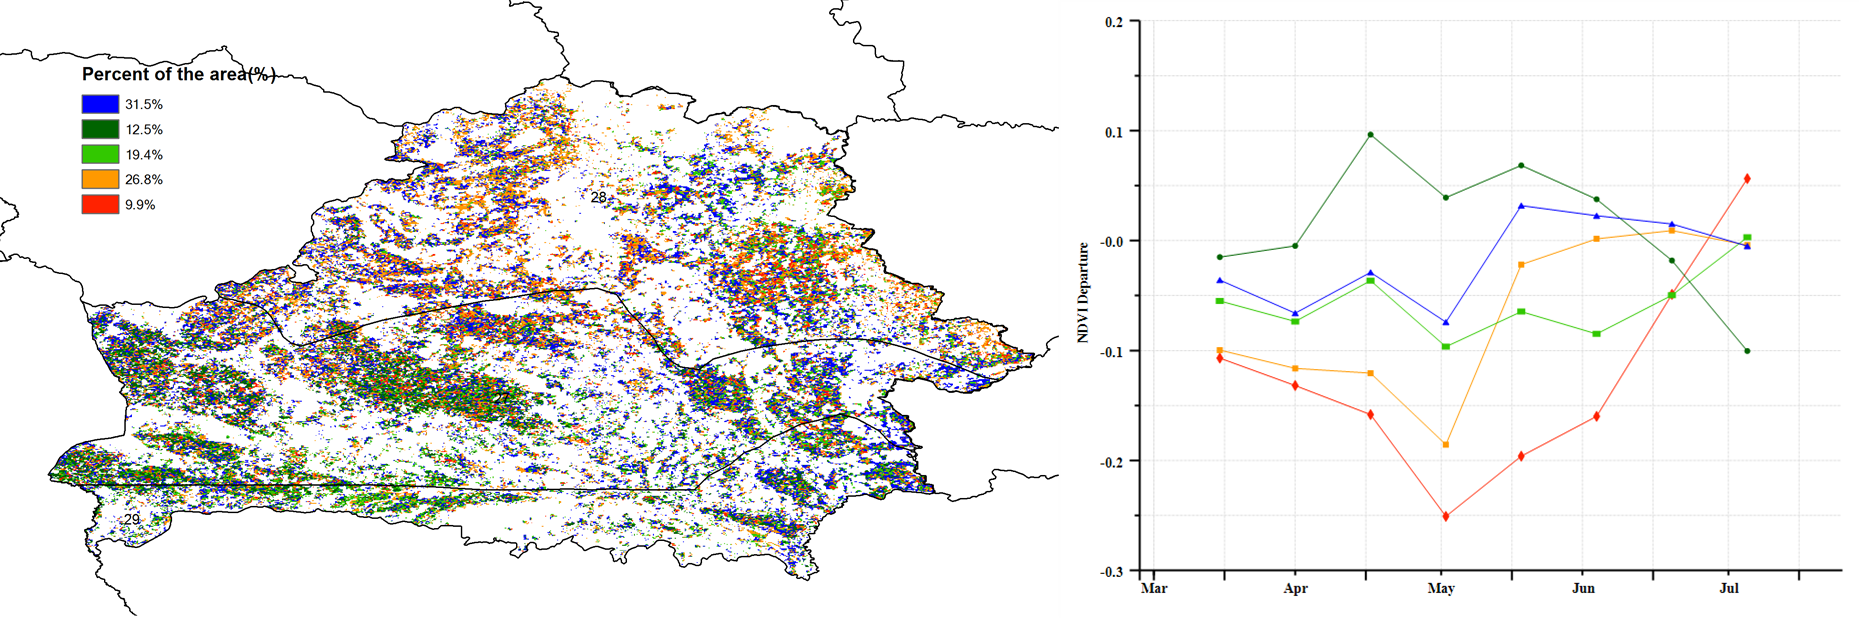
(d) Spatial NDVI patterns compared to 5YA (e) NDVI profiles
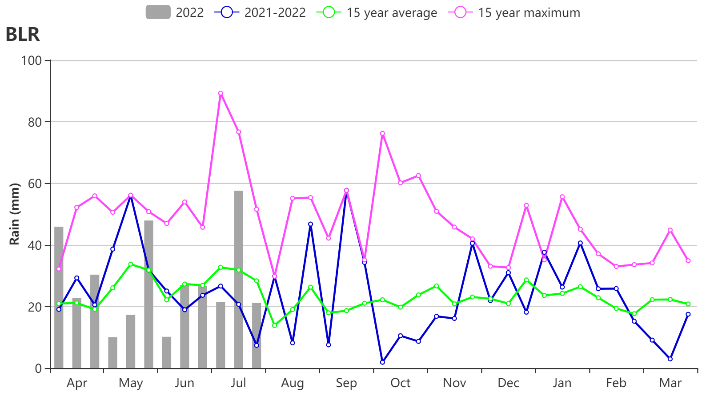
(f) Rainfall time series

(g) Temperature time series
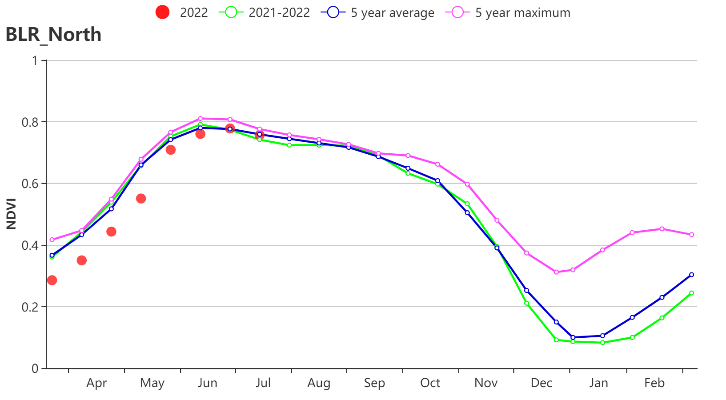
(h) Crop condition development graph based on NDVI (Northern Belarus)
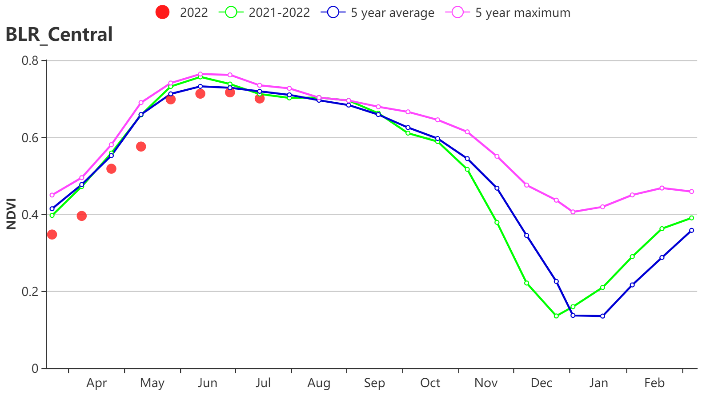
(i) Crop condition development graph based on NDVI (Central Belarus)
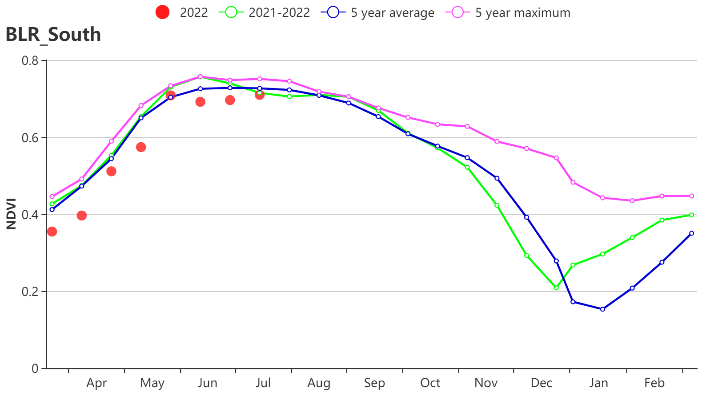
(j) Crop condition development graph based on NDVI (South-west Belarus)
Table 3.11 Belarus's agroclimatic indicators by sub-national regions, current season's values and departure from 15YA, April – July 2022.
Region | RAIN | TEMP | RADPAR | BIOMSS | |||||
Current (mm) | Departure (%) | Current (°C) | Departure (°C) | Current (MJ/m2) | Departure (%) | Current (gDM/m2) | Departure (%) | ||
Center | 312 | -2 | 13.6 | -0.9 | 1109 | -1 | 807 | -4 | |
North | 403 | 22 | 12.3 | -1.0 | 1090 | -1 | 919 | 9 | |
South-west | 237 | -21 | 14.3 | -1.0 | 1126 | -2 | 693 | -16 | |
Table 3.12 Belarus's agronomic indicators by sub-national regions, current season's values and departure from 5YA, April – July 2022
Region | Cropped arable land fraction | Maximum VCI | |
Current (%) | Departure (%) | Current | |
Center | 100 | 0 | 0.92 |
North | 100 | 0 | 0.95 |
South-west | 100 | 0 | 0.92 |