After a brief overview of the agro-climatic and agronomic conditions in China over the reporting period (section 4.1), Chapter 4 then presents China's crop prospects (section 4.2), describes the situation by region, focusing on the seven most productive agro-ecological regions of the east and south: Northeast China, Inner Mongolia, Huanghuaihai, Loess region, Lower Yangtze, Southwest China, and Southern China (section 4.3). Section 4.4 describes trade prospects of major cereals and soybean. Additional information on the agro-climatic indicators for agriculturally important Chinese provinces is listed in table A.11 in Annex A.
4.1 Overview
Most of the summer crops, such as semi-late rice, maize and soybean, were in the field during the reporting period. This period also covers the harvest of early rice and winter wheat. The sowing of late rice was completed in July. The agro-climatic conditions were overall at average, with rainfall slightly below average (-4%), temperature (+0.2°C) and RADPAR (+3%) slightly above average. There are significant regional differences among agro-climatic indicators, showing a spatial pattern of persistent high temperature in the south and above average precipitation in the northeast.
According to the time series rainfall profile, above-average rainfall was observed nationwide in late April, late May, from early June to middle June, and early July. Three of the main agricultural regions of China recorded above-average rainfall, with the largest positive departure occurring in Northeast China (+35%), while three of the main agricultural regions of China recorded below-average rainfall, with the largest negative departure occurring in Southwest China (-9%). At the country level, rainfall anomalies fluctuated largely over time and space. As can be seen from the spatial distribution of rainfall profiles, 63.5% of the cropped areas (marked in light green) recorded near average precipitation. 10.1% of the cropped areas, mainly located in the eastern part of Southern China and southern part of Lower Yangtze region, received significantly above-average rainfall (more than +90 mm/dekad) during middle June and early July, which might cause difficult conditions for the harvest of early rice. The remaining 26.5% of cropped areas experienced the largest negative departure of rainfall (almost -60 mm/dekad) during middle July, occurred mainly in the province of Anhui, Jiangsu, Zhejiang, Jiangxi, Guizhou, and some parts of Sichuan, Yunnan, Guangxi and Fujian.
Five of the main agricultural regions in China recorded above-average temperatures, with the largest positive departure occurring in Huanghuaihai (+0.9°C), while only two region recorded below-average temperature (-0.1°C in Southern China, -0.3°C in Northeast). Temperatures fluctuated during the monitoring period as follows: 33.8% of the cultivated regions, marked in light green, had relatively small temperature fluctuations, with the largest positive temperature anomalies by approximately +2.0℃ in early April. 33.8% of the cropped areas in Southern China, southern part of Southwest China and Lower Yangtze region had negative temperature anomalies by more than -3.0℃ in middle May. The remaining 32.4% of the cultivated regions, marked in dark green, had positive temperature anomalies in early April and from early June to early July. Northeast China was the only region in which RADPAR was below average (-1%), whereas the largest positive departure was recorded for the Loess region (+6%).
As for BIOMSS, the situation was quite different among all the main producing regions, with the departures between -3% (Huanghuaihai, Loess region and Lower Yangtze region) and +10% (Northeast China). CALF increased slightly in the Loess region (+1%) and was near average in other main agricultural regions as compared to the 5YA.
The maximum vegetation condition index (VCIx) reached a high value of 0.92 at the national scale, indicating an overall favorable condition in China. The VCIx values were higher than 0.9 in almost all the main producing regions of China, with values between 0.90 and 0.95, except for the Loess region (0.89).
Table 4.1 CropWatch agro-climatic and agronomic indicators for China, April to July 2022, departure from 5YA and 15YA
| Region | RAIN Departure from 15YA(%) | TEMP Departure from 15YA(℃) | RADPAR Departure from 15YA(%) | BIOMSS Departure from 15YA(%) | CALF Departure from 5YA(%) | Maximum VCI Current |
| Huang Huaihai | 1 | 0.9 | 3 | -3 | 0 | 0.90 |
| Inner Mongolia | 4 | 0.3 | 0 | 0 | 0 | 0.90 |
| Loess region | -8 | 0.8 | 6 | -3 | 1 | 0.89 |
| Lower Yangtze region | -6 | 0.2 | 5 | -3 | 0 | 0.91 |
| North East China | 35 | -0.3 | -1 | 10 | 0 | 0.95 |
| Southern China | 0 | -0.1 | 3 | -2 | 0 | 0.93 |
| South-West China | -9 | 0.2 | 4 | -1 | 0 | 0.94 |
Figure 4.1 China crop calendar
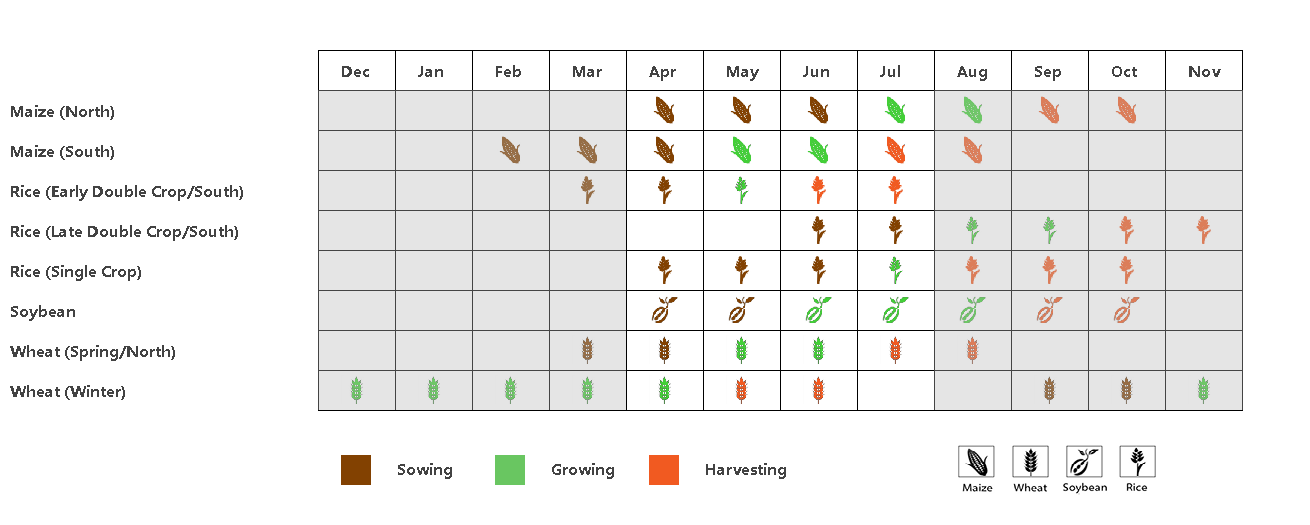
Figure 4.2 China spatial distribution of rainfall profiles, April-July 2022
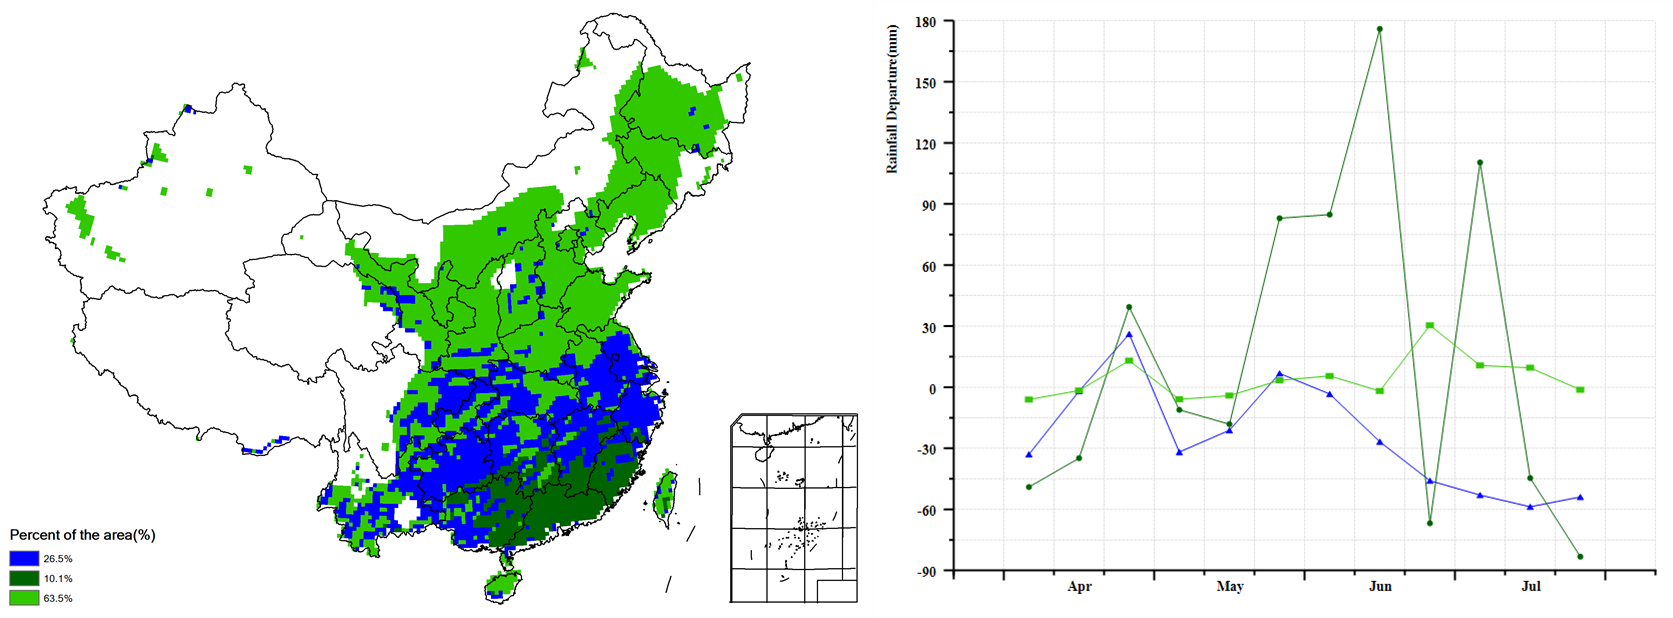
Figure 4.3 China spatial distribution of temperature profiles, April-July 2022
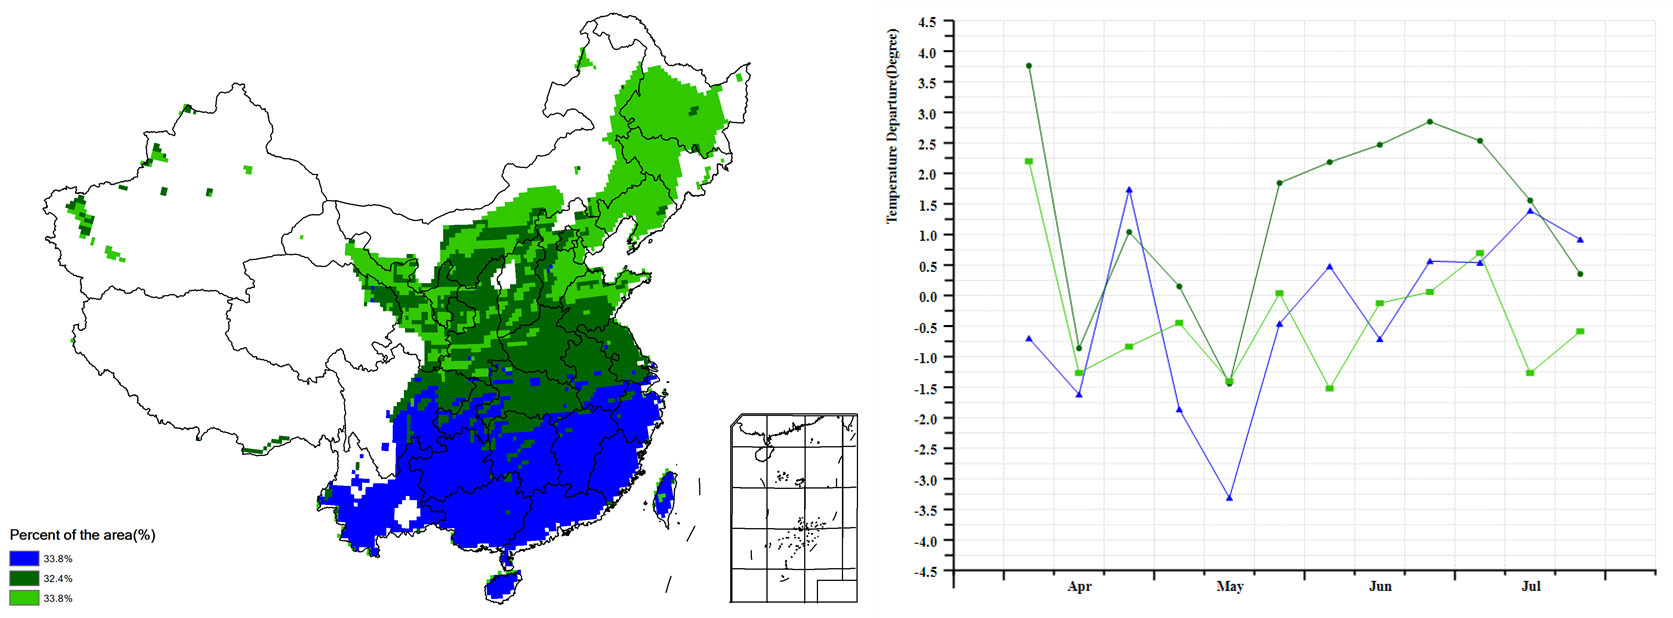
Figure 4.4 China cropped and uncropped arable land, by pixel, April-July 2022

Figure 4.5 China biomass departure map from 15YA, by pixel, April-July 2022
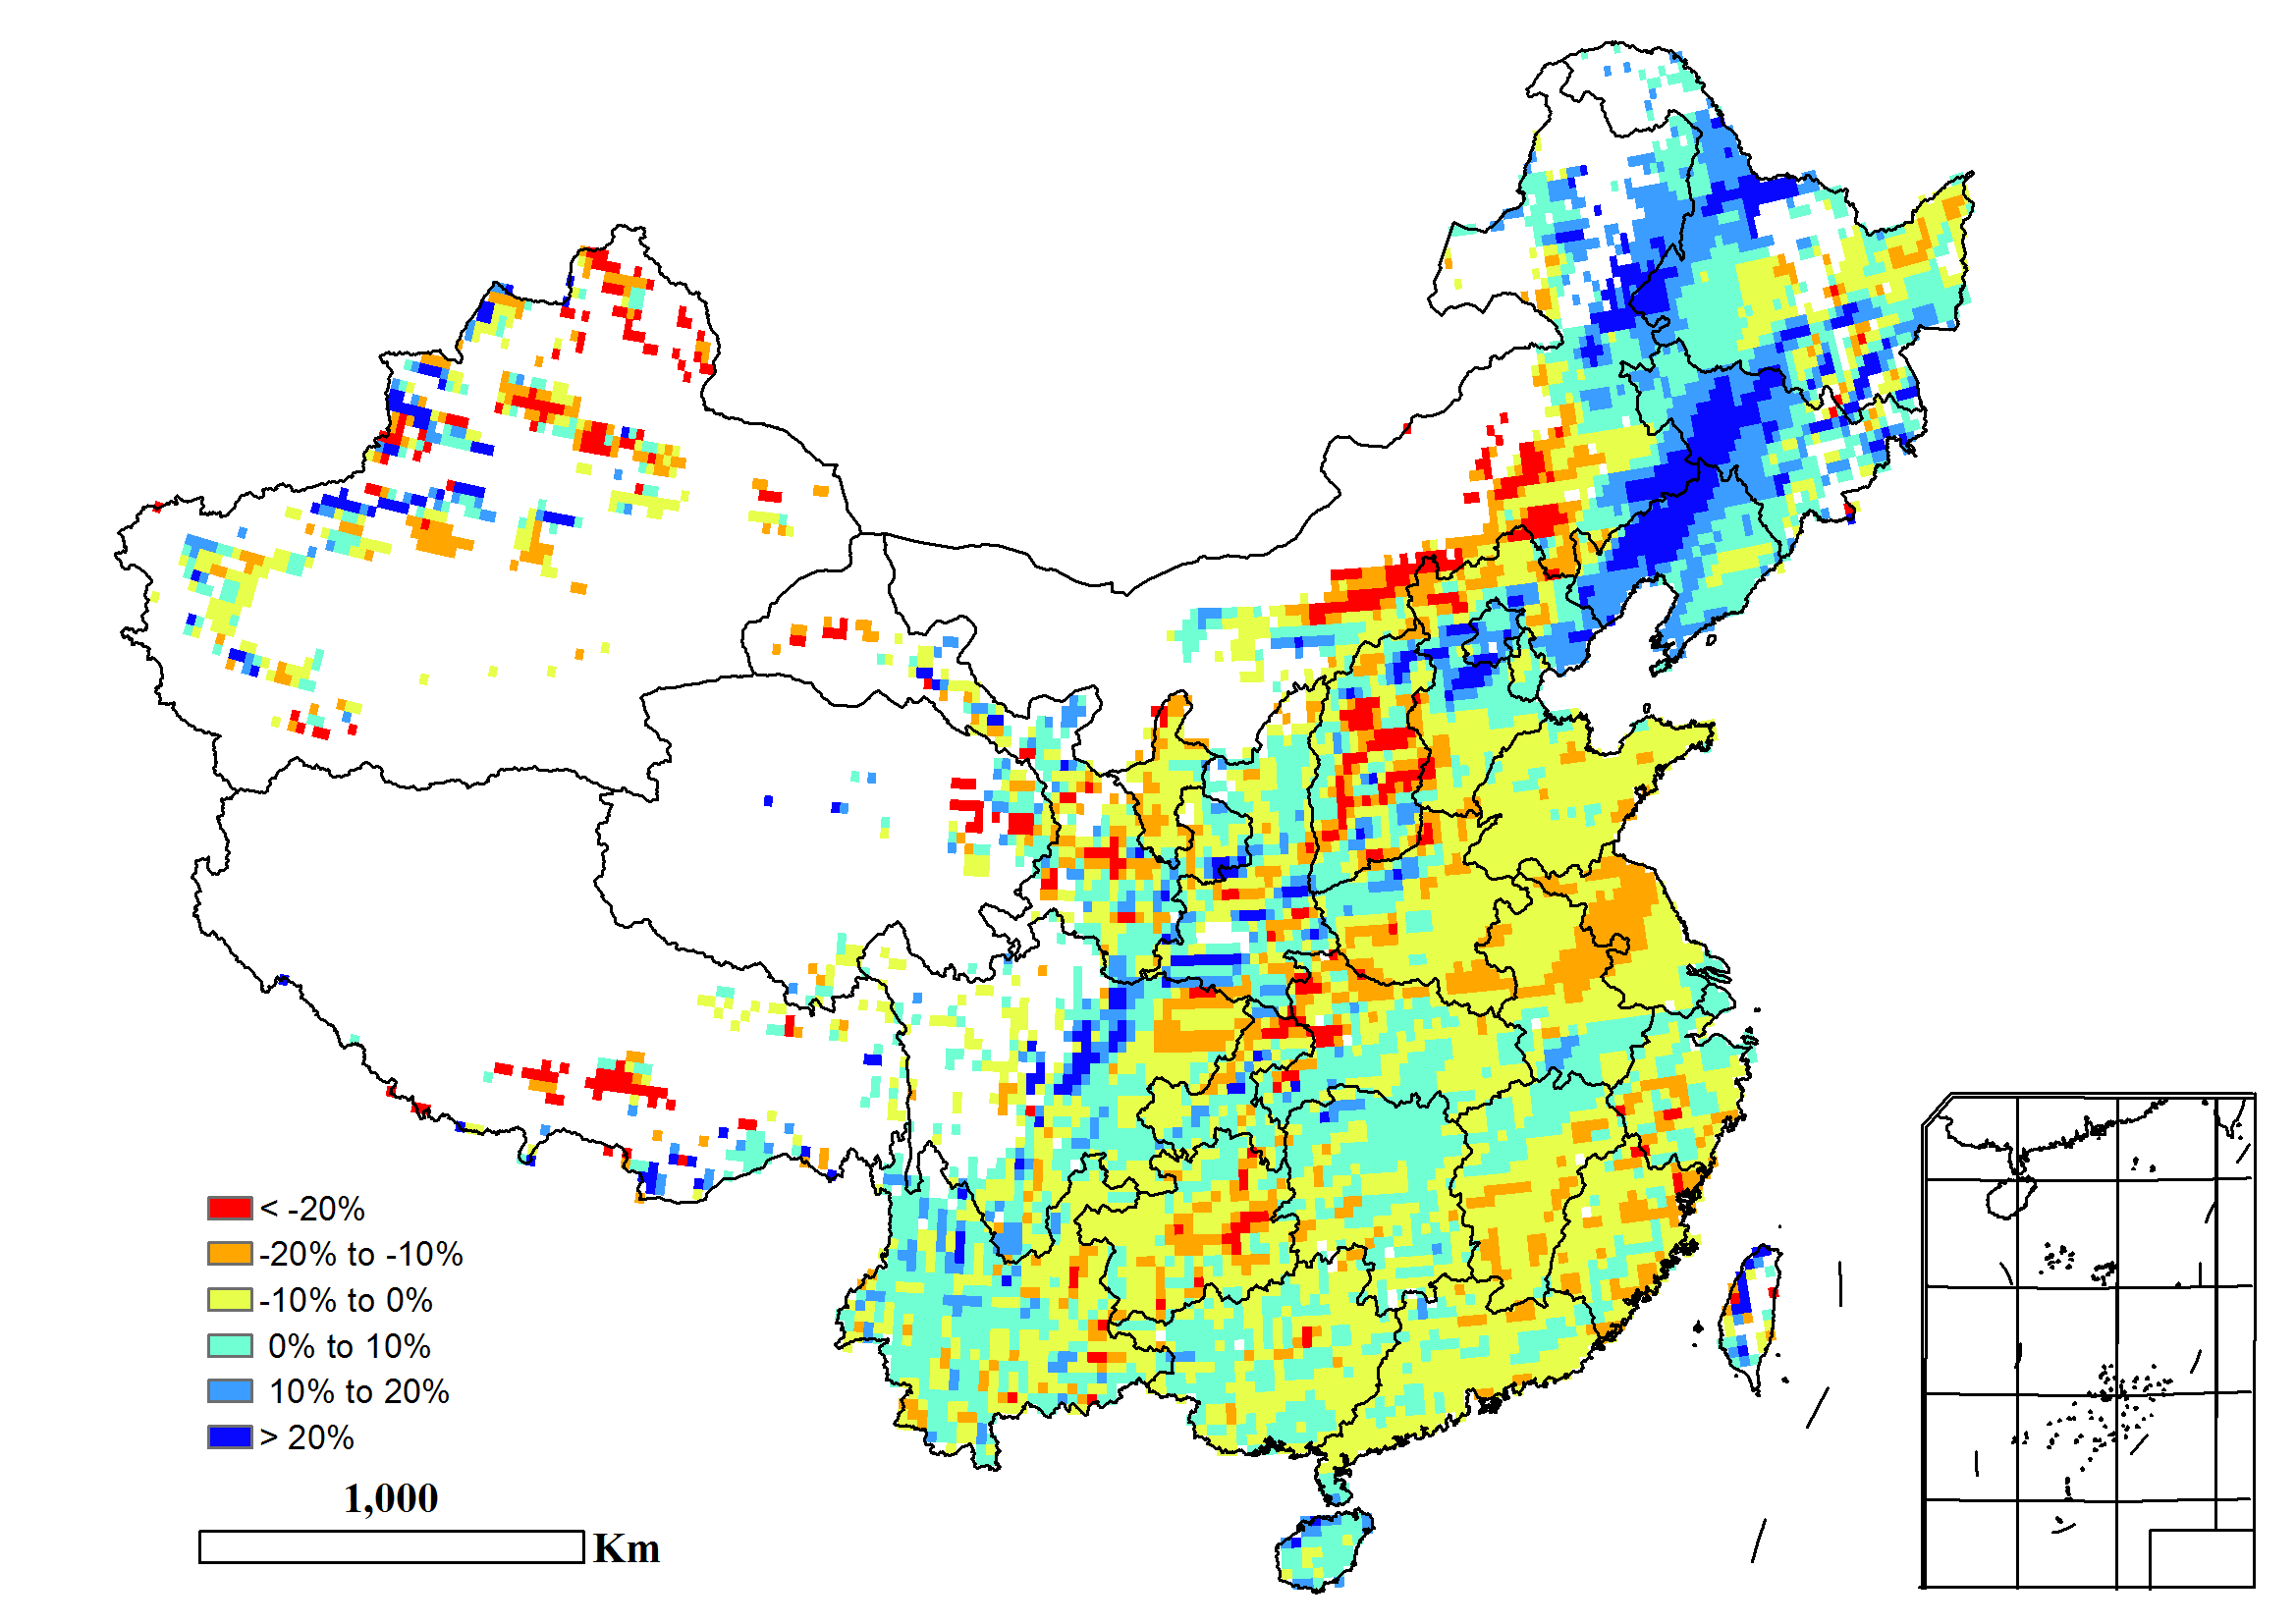
Figure 4.6 China maximum Vegetation Condition Index (VCIx), by pixel, April-July 2022
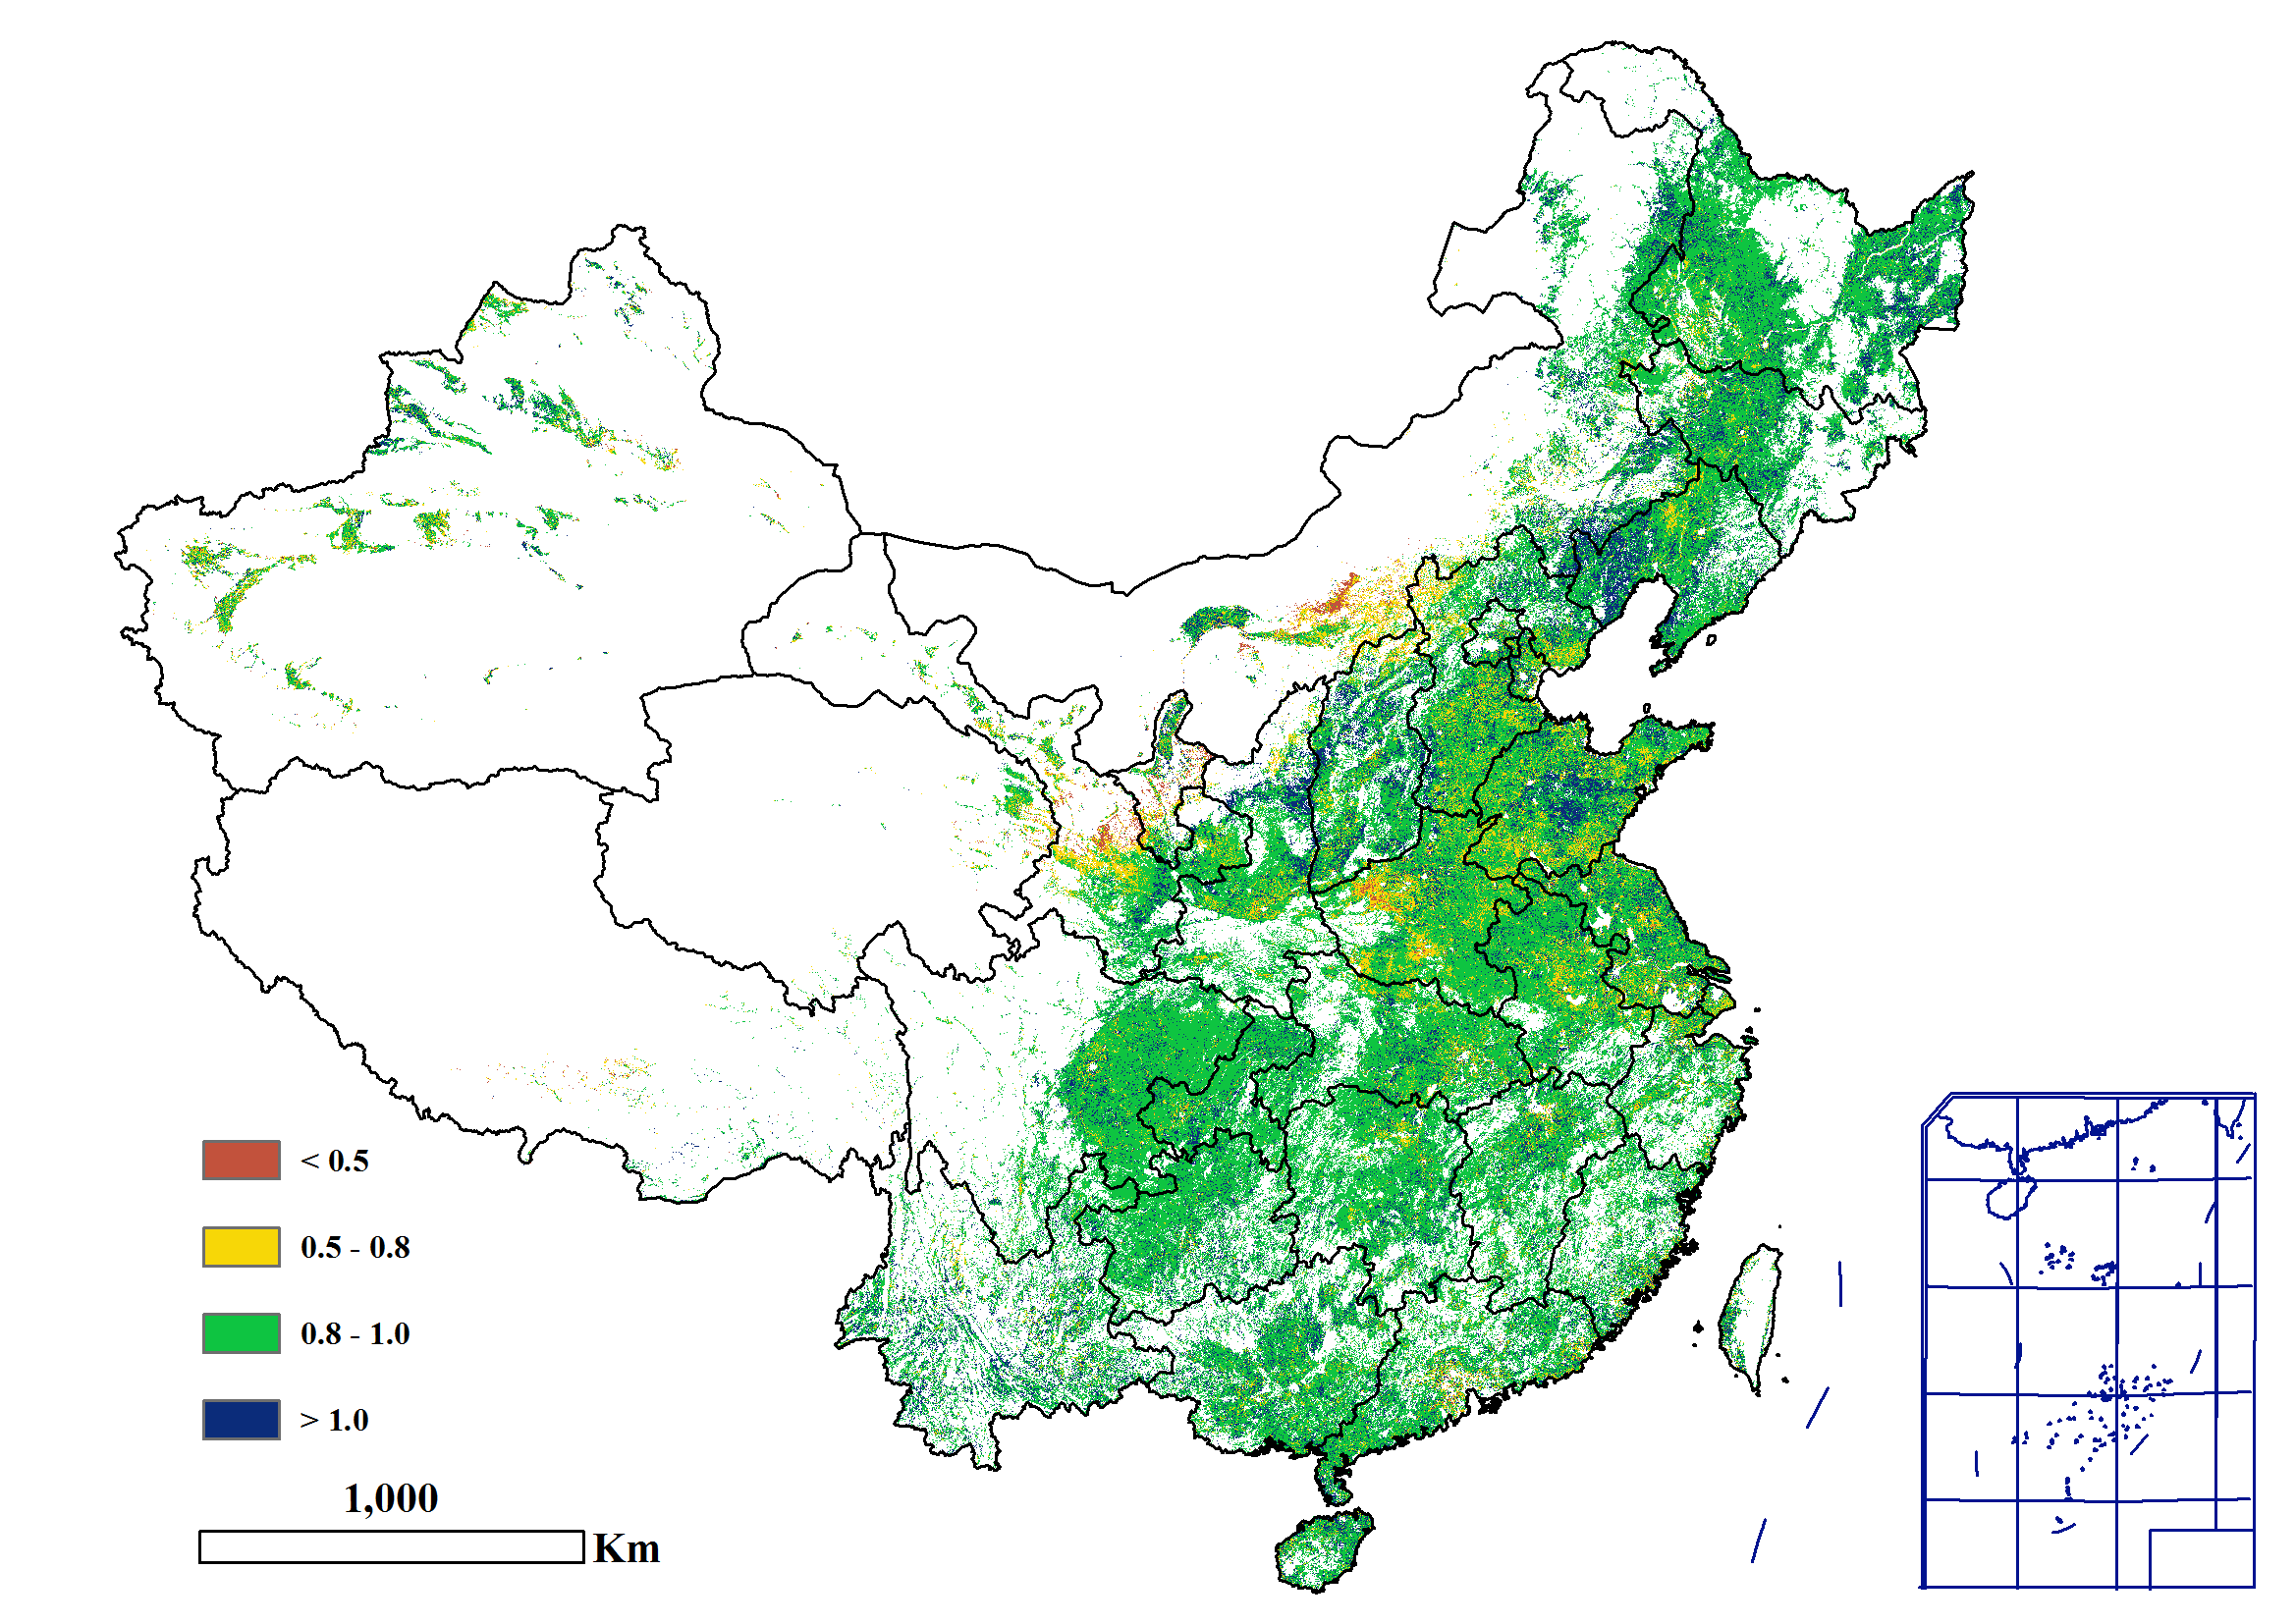
Figure 4.7 Time series rainfall profile for China
