The South and Southeast Asia MPZ includes India, Bangladesh, Cambodia, Myanmar, Nepal, Thailand and Vietnam. Harvest of wheat and dry season rice was mostly completed in April. Planting of the main rice crop started at the onset of the monsoon rains in June and July.
According to the CropWatch agroclimatic indicators, RAIN was below the 15YA (RAIN -11%), the temperature was above the 15YA (TEMP +0.3℃) and the PADPAR was above the 15YA (RADPAR +4%), whereas BIOMSS was unchanged. CALF was reduced by 4% compared with the 5YA, reaching 76% and VCIx of the MPZ was 0.82.
According to the spatial distribution of rainfall profiles, the precipitation for 22.2% of the MPZ showed higher positive departures in July, mainly located in western India, Sri Lanka, central Nepal, southern, eastern and central Thailand, southern and eastern Cambodia and southern Vietnam. The precipitation for 21.6% of the MPZ gradually rose in late June and reached the highest values in mid-July, mainly located in southwestern, central and eastern India, southern Thailand, central Cambodia, central Laos and Vietnam. The precipitation for 6.6% of the MPZ was generally below the average with a particularly low amounts in July, mainly located in northeastern India, southern Nepal, southeastern Bangladesh and southwestern Myanmar. The precipitation for 2.7% of the MPZ showed the strongest positive anomaly in mid-May and mid-June, located in eastern Bangladesh and eastern India. This strong anomaly had caused severe flooding in those regions. The spatial distribution of temperature profiles shows that the temperature for 30.2% of the MPZ dropped in April and May, then stayed near average after June. It was located in Thailand, Laos, Vietnam, Cambodia, eastern and southern India. In contrast, on 3.2% of the MPZ (Bhutan and northern India) temperatures always stayed at above average levels. The temperature for 21.9% of the MPZ (western India) was fluctuating above or below the average in May and June.
The BIOMSS departure map reveals that the potential biomass in western India and central Thailand was 20% higher than the average level, while the potential biomass in northern, southern, eastern and central India and central Myanmar was estimated to be below average. The Maximum VCI map shows that the index was higher than 1.0 in western and southern India, central Myanmar and eastern Thailand, which indicates that crop condition is better than 5-year maximum. The index was lower than 0.5 in central and northern India, which is related to the cropland fallow or delayed of seeding .From the VHI Minimum map, it can be seen that periods of severe drought occurred in central, northern and eastern India, eastern Bangladesh, southern Myanmar, most of Cambodia and scattered areas in Vietnam, Thailand, Nepal, Sri Lanka and Laos. The CALF map indicates that parts of central Myanmar as well as of India were not yet planted at the end of this monitoring period.
In summary, the crop conditions of summer crops in this MPZ were close to normal.
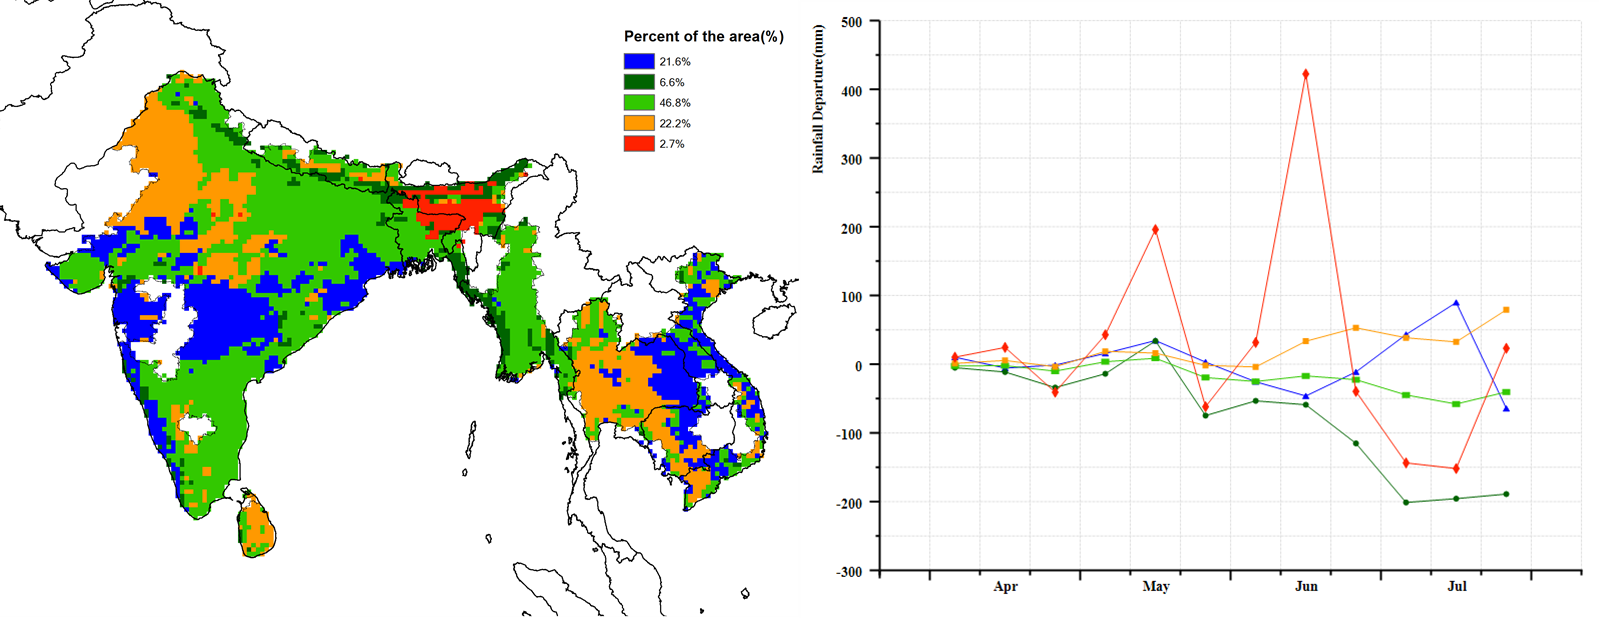
a.Spatial distribution of rainfall profiles b.Profiles of rainfall departure from average (mm)
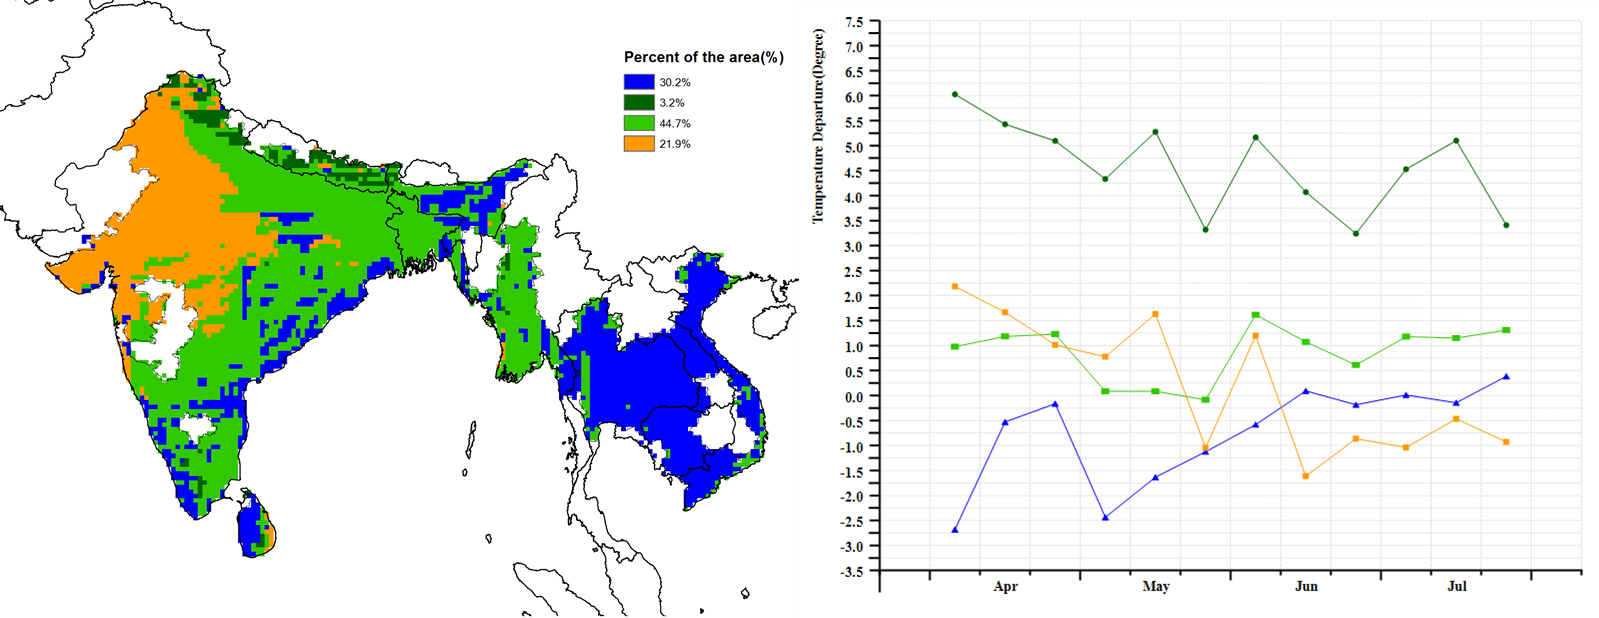
c. Spatial distribution of temperature profiles d.Profiles of temperature departure from average (mm)
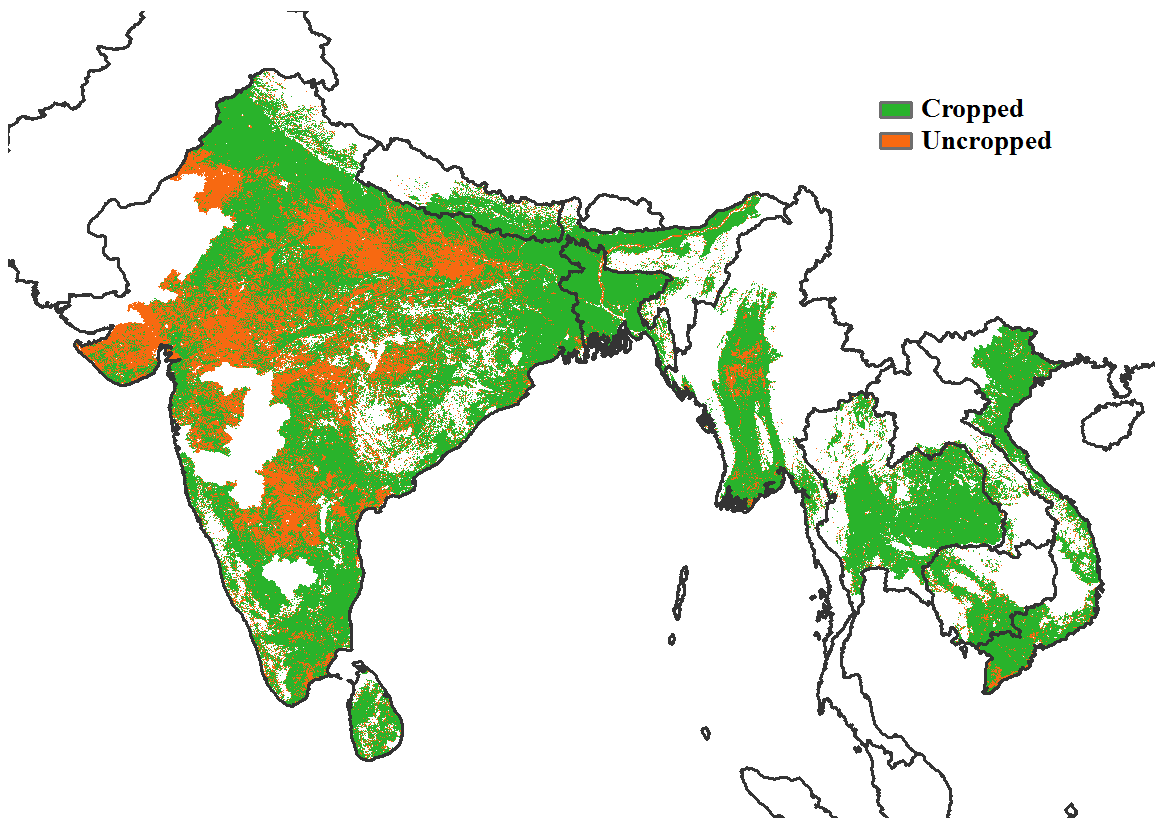
e. Cropped and uncropped arable land
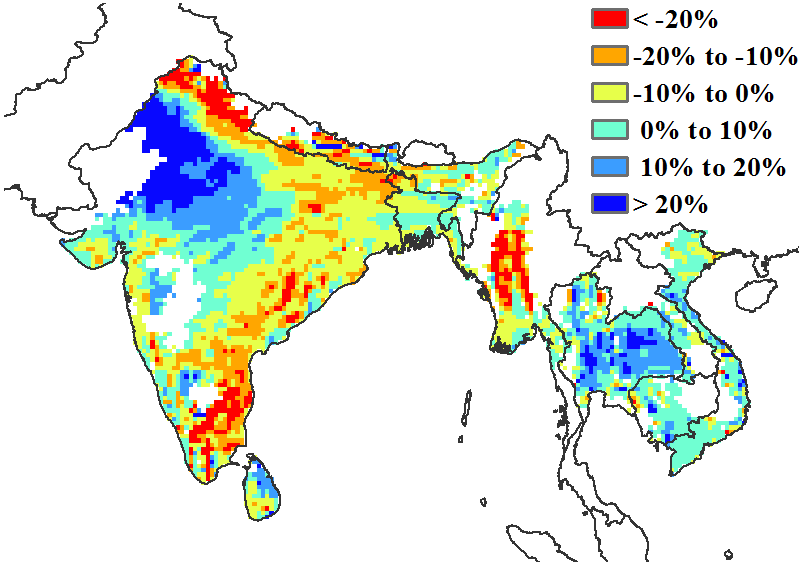
f. Potential biomass departure from 5YA
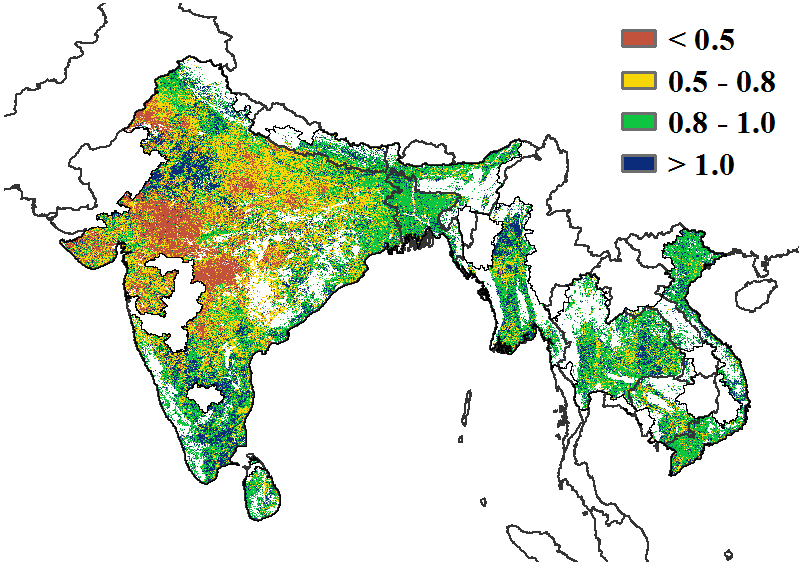
g. Maximum VCI

h.VHI Minimum