During this monitoring period, wheat reached maturity by the end of April and was harvested in May and June, while maize matured by the end of May and was harvested from June to July. The cumulative rainfall was 22% below the 15-year average (15YA). The rainfall index graph shows that the rain was higher than the 15YA during first dekad in April, second and third dekads in June and first dekad in July. The average temperature was higher than the 15YA by 0.9 ℃. The temperature index graph fluctuated around the 15YA during the monitoring period. RADPAR and BIOMSS were below the 15YA by 2.4% and 1%, respectively. The nationwide NDVI development graph indicates that the crop conditions were below the 5-year average (5YA) during the monitoring period. NDVI was far below average at the start of this monitoring period. Morocco had experienced a rainfall deficit during the entire winter cereal production period which started in November. The NDVI spatial pattern shows that only 19.2% of the cultivated area fluctuated around the 5YA; the rest (80.8%) were below the 5YA. The CALF was below the 5YA by 11%, and the VCIx value reached 0.59, confirming unfavorable crop conditions.
Regional analysis
CropWatch delineates three agro-ecological zones (AEZs) relevant for crop production in Morocco: the Sub-humid northern highlands, the Warm semiarid zone, and the Warm sub-humid zone. In the three zones, rainfall was below the 15YA by 20%, 35%, and 12%, while the temperature was above the 15YA by 0.7℃, 1.0℃, and 0.7℃, respectively. RADPAR was below the 15YA by 3%, 2%, and 3%, in the three zones respectively. BIOMSS was below the 15YA in the first and second zones by 3% and 2% respectively while it was at the 15YA in the third zone. The NDVI-based crop condition development graphs show similar conditions for the three zones following the national crop development NDVI graph. The CALF was 13%, 19%, and 7% below the 5YA, and the VCIx was 0.72, 0.47, and 0.70 for the three zones, respectively, confirming unfavorable crop conditions.
Figure 3.27 Morocco's crop condition, April-July 2022
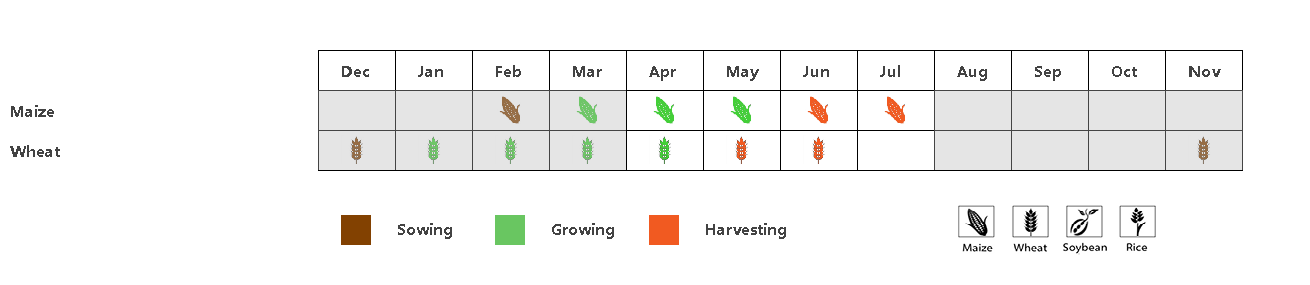
(a) Phenology of major crops
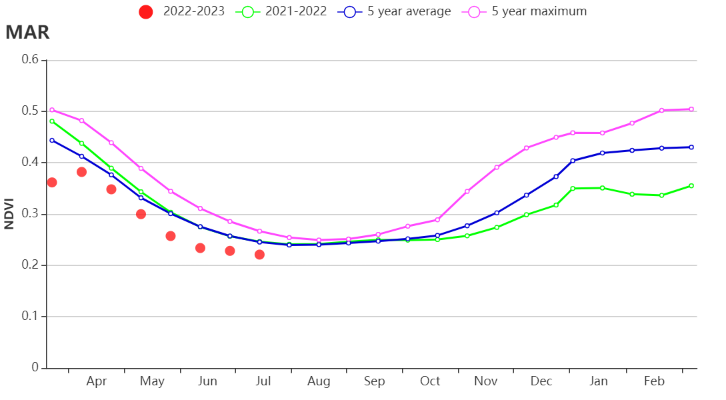
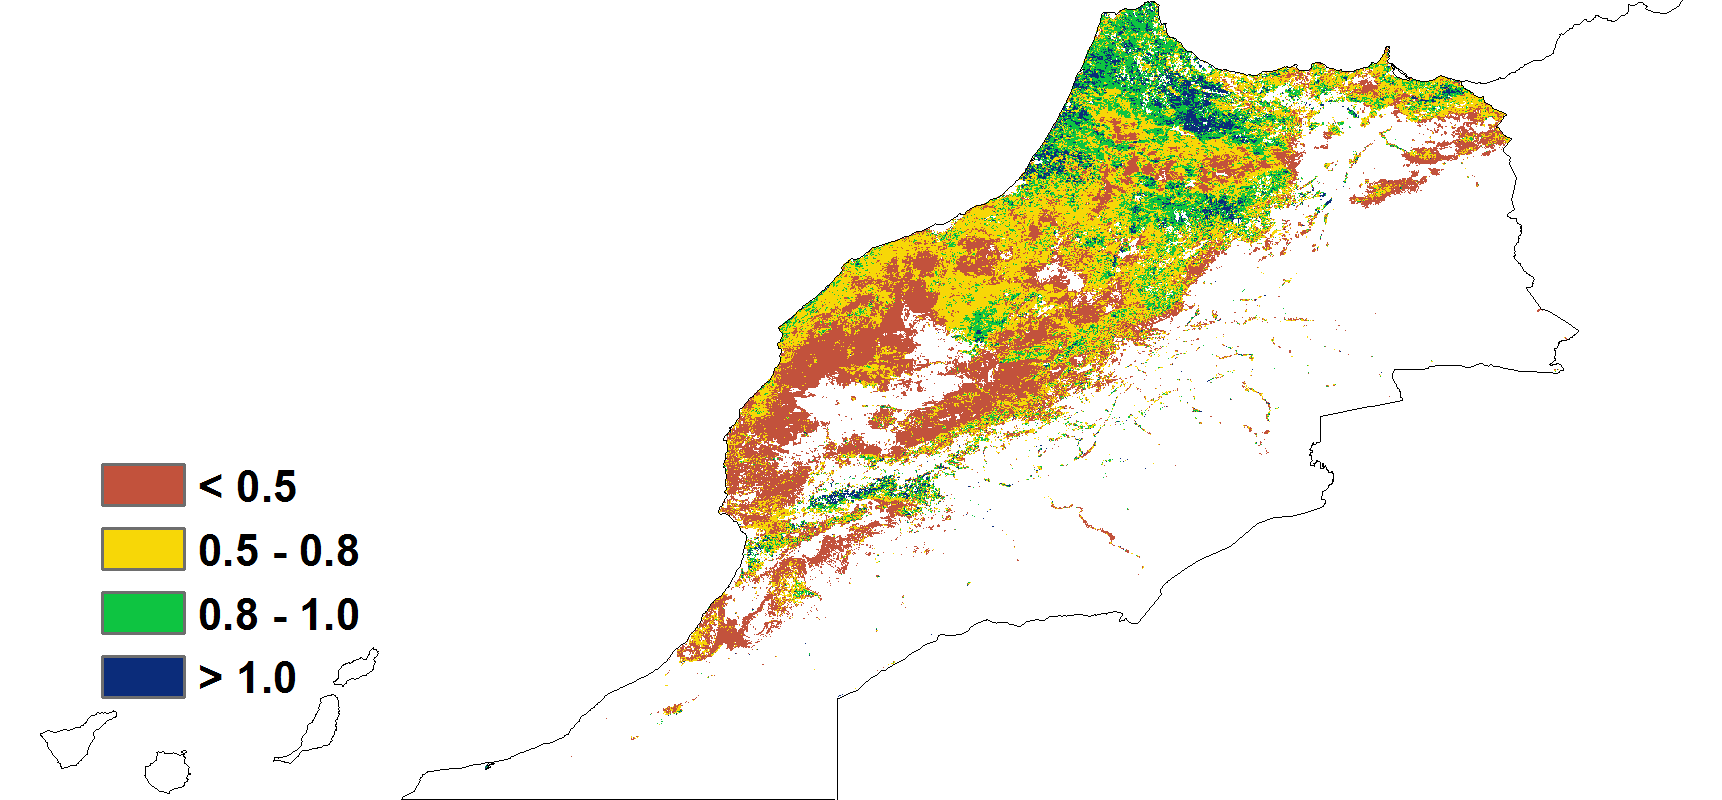
(b) Crop condition development graph based on NDVI(c) Maximum VCI
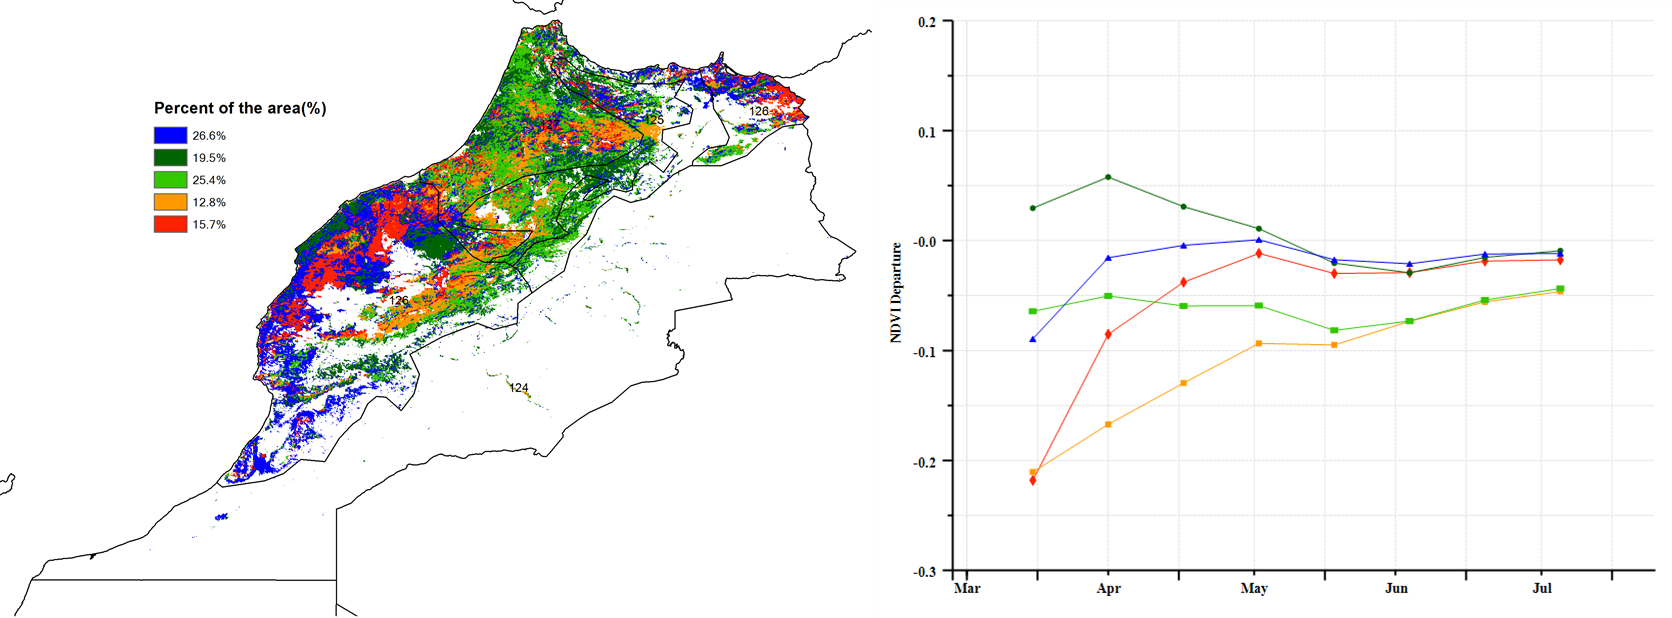
(d) Spatial NDVI patterns compared to 5YA(e) NDVI profiles
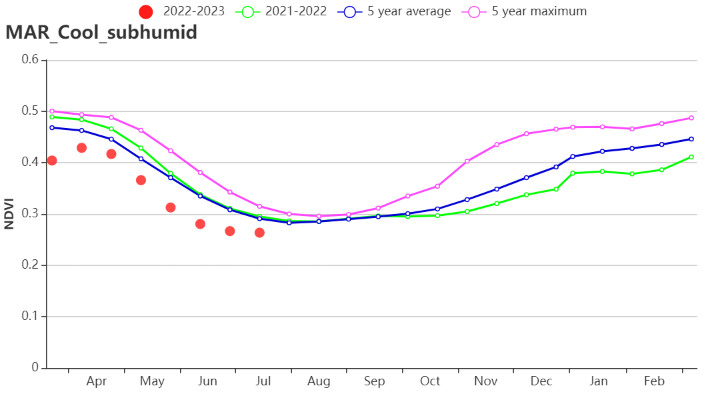
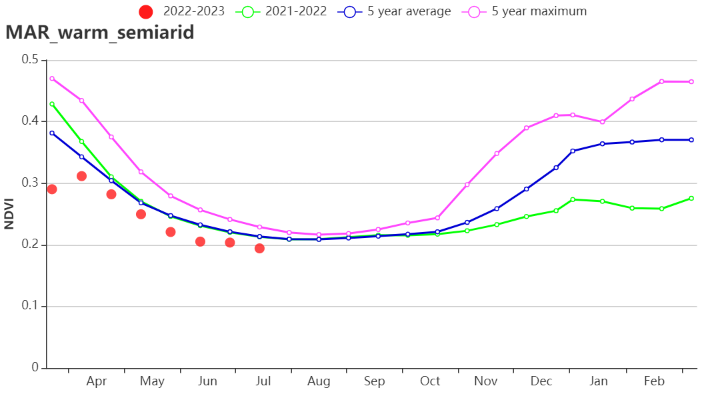
(f) Crop condition development graph based on NDVI (Sub-humid northern highlands) and (g). Warm semiarid zones )
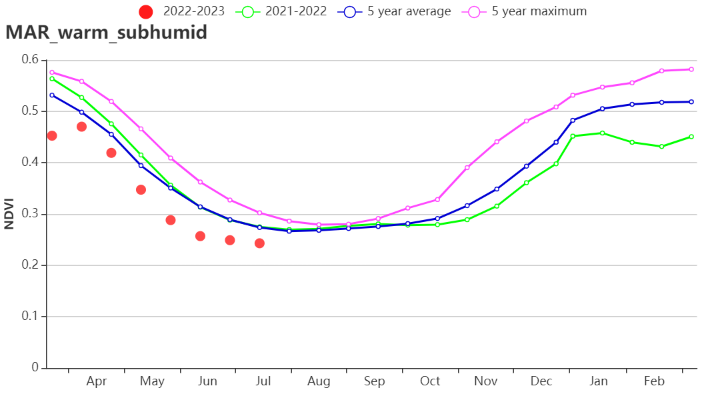
(h) . Crop condition development graph based on NDVI, Warm subhumid zones.
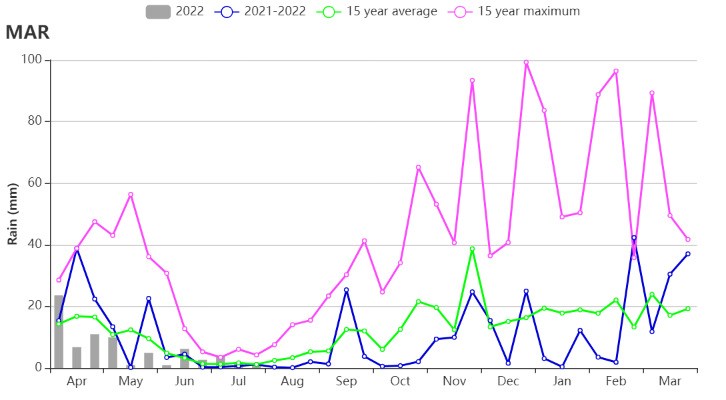
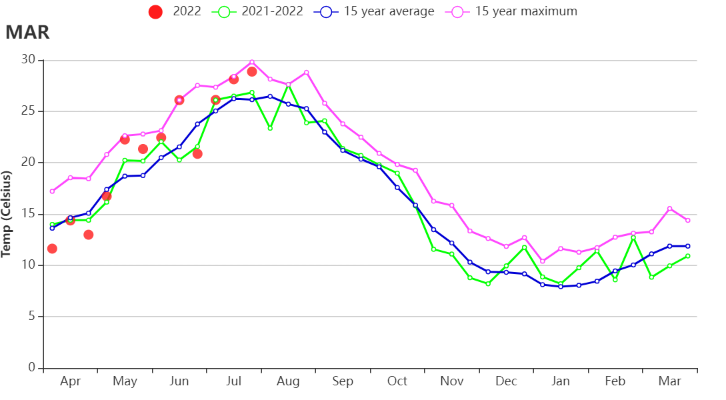
(i) Time series profile of rainfall (j)Time series profile of temperature
Table 3.45 Morocco's agroclimatic indicators by sub-national regions, current season's values, and departure from 15YA, April-July 2022
RAIN | TEMP | RADPAR | BIOMSS | |||||
Region | Current (mm) | Departure from 15YA (%) | Current (°C) | Departure from 15YA (°C) | Current (MJ/m2) | Departure from 15YA (%) | Current (gDM/m2) | Departure from 15YA (%) |
Sub-humid northern highlands | 108 | -20 | 20 | 0.7 | 1529 | -3 | 638 | -3 |
Warm semiarid zones | 40 | -35 | 21 | 1.0 | 1590 | -2 | 554 | -2 |
Warm sub-humid zones | 104 | -12 | 20 | 0.7 | 1527 | -3 | 636 | 0 |
Table 3.46 Morocco's agronomic indicators by sub-national regions, current season's values, and departure from 5YA, April-July 2022
CALF | Maximum VCI | ||
Region | Current (%) | Departure from 5YA (%) | Current |
Sub-humid northern highlands | 53 | -13 | 0.72 |
Warm semiarid zones | 18 | -19 | 0.47 |
Warm sub-humid zones | 63 | -7 | 0.70 |