Maize, soybean, and spring wheat had been sown in April and May and were reaching the grain-filling period in the 2nd half of July. Harvest of winter wheat started in July. Overall, crop conditions were above average.
According to the CropWatch agroclimatic indicators, Canada experienced cooler and cloudier conditions. Due to the low temperatures in May, the sowing of summer crops was delayed. Therefore, the NDVI development curve shows a slight lag in April and May, but improved to average levels in June. The proportion of irrigated cropland in Canada is only 5% and rainfall is an important factor controlling crop production. The temperature (TEMP -0.7°C) and radiation (RADPAR -3%) were below the 15-year average while the rainfall (RAIN +9%) was above average, which led to average potential biomass (BIOMSS +1%). The temperature profile depicts that those low temperatures occurred mostly in May. The temperatures surpassed the 15-year maximum after June. The rainfall profile shows that the precipitation was above average in late June, when reached the 15-year maximum value.
As shown in the NDVI cluster map, the crop conditions were below average at the beginning and recovered to average after May on 26.5% of the cropped area, concentrated in the Northern Prairies (including the north of Saskatchewan and the middle of Manitoba). Crop conditions on 9.6% of total cropped land were predominantly below average and 20% were below average after April. On 26.7% of total cropped land, crop conditions fluctuated around the average level. In the remaining parts, crop conditions were below average at the beginning and subsequently fluctuated around average levels. The national maximum VCI value was 0.93, and the CALF was slightly above the recent 5-year average (CALF +1%).
The overall conditions of winter wheat, which is predominantly grown in the Saint Lawrence basin are assessed as average and above, and the prospects for the summer crops, including spring wheat, maize, and soybean are favorable.
Regional analysis
The Prairies (area identified as 53 in the crop condition clusters map) and Saint Lawrence basin (49) are the major agricultural regions in Canada.
The rainfall in the Prairies, the main food production area in Canada, was significantly above average (RAIN 421 mm +19%), while the temperature and radiation were below average (TEMP –1.2°C; RADPAR -5%). The major crops in this region are winter wheat and spring wheat. According to the NDVI development graph and NDVI profile, crop conditions were below average before June. The negative departures were due to the lower temperature and wet soil conditions during the planting period of the summer crops. Crop conditions in the Prairies were favorable.
The conditions in the Saint Lawrence basin differed from the Prairies as rainfall was below average (RAIN-5%) and the temperature and radiation were close to average (TEMP +0.0°C; RADPAR +1%). Altogether, these agroclimatic conditions led to average potential biomass (BIOMSS +1%). According to the NDVI development graph, crop conditions were close to the average level in the recent 5 years. Overall, crop conditions were close to the average for this region.
Figure 3.12 Canada's crop condition, April-July 2022
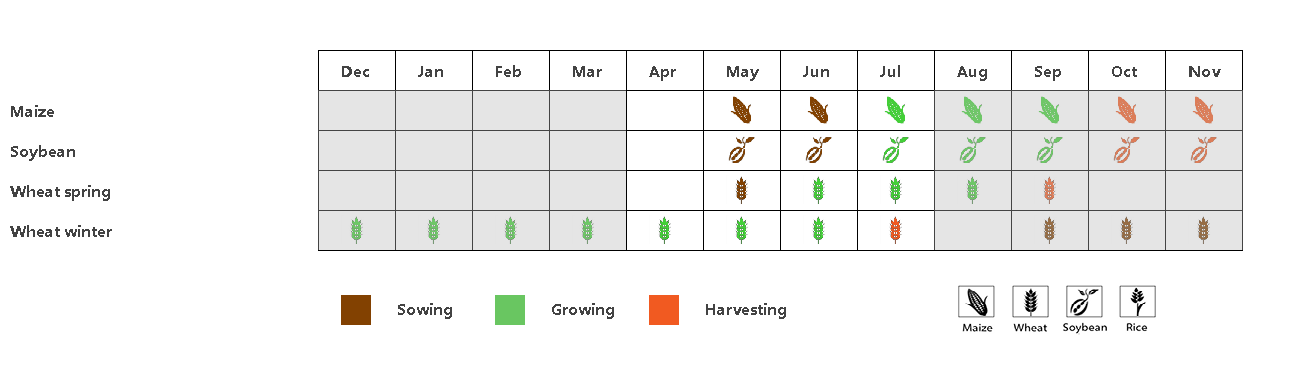
(a). Phenology of major crops

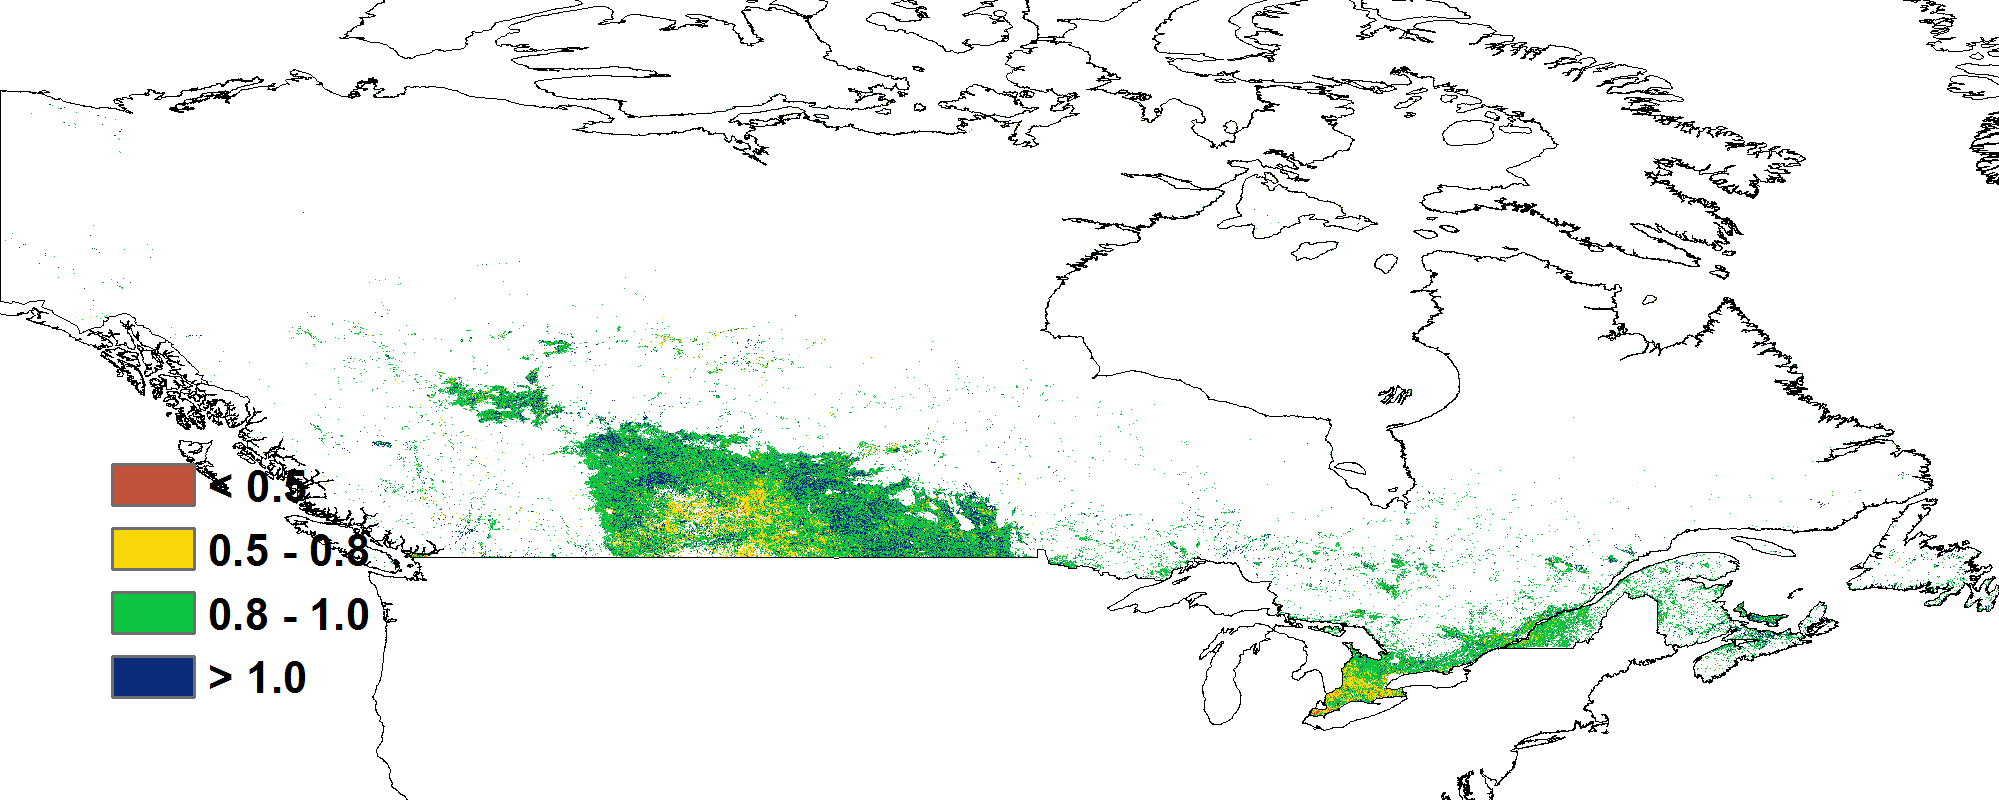
(b) Crop condition development graph based on NDVI (c) Maximum VCI

(d) Spatial NDVI patterns compared to 5YA (e) NDVI profiles
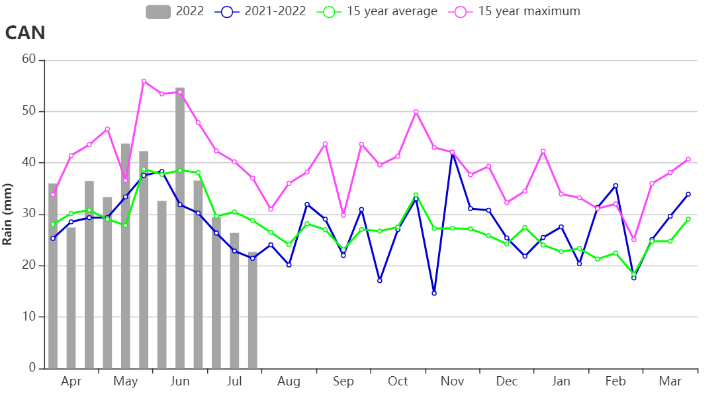
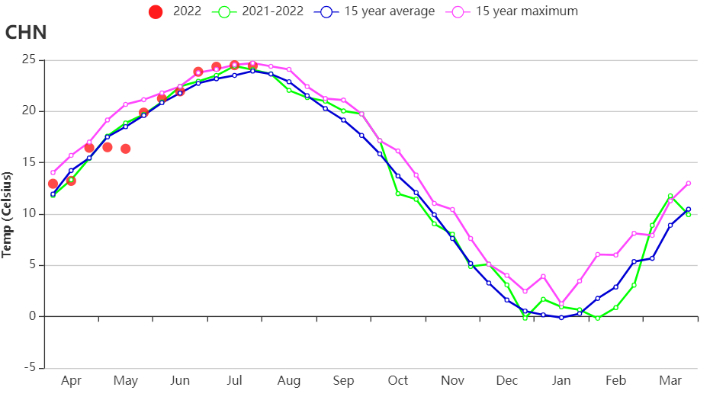
(f) Rainfall time series (g) Temperature time series
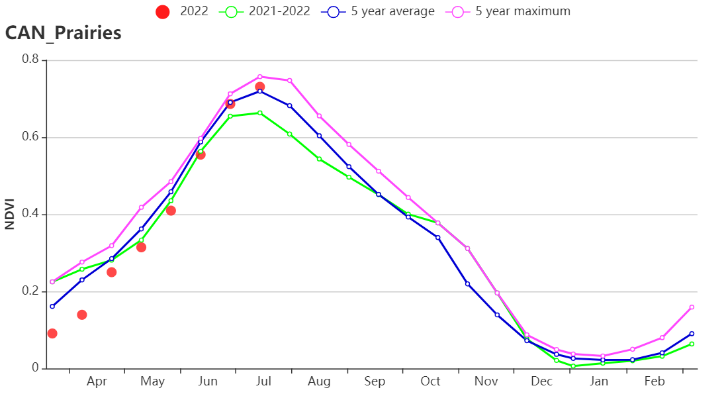
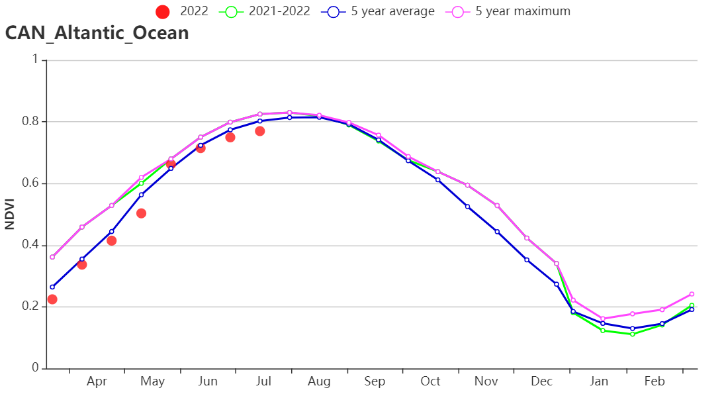
(h) Crop condition development graph based on NDVI (Canadian Prairies region (left) and Saint Lawrence basin region (right))
Table 3.15. Canada's agroclimatic indicators by sub-national regions, current season's values and departure from 15YA, April-July 2022
| RAIN | TEMP | RADAR | BIOMSS | |||||
| Region | Current (mm) | Departure from 15YA (%) | Current (°C) | Departure from 15YA (°C) | Current (MJ/m2) | Departure from 15YA (%) | Current (gDM/m2) | Departure from 15YA (%) |
| Saint Lawrence basin | 423 | -5 | 11.2 | 0.0 | 1123 | 1 | 874 | 1 |
| Prairies | 421 | 19 | 10.4 | -1.2 | 1185 | -5 | 831 | 2 |
Table 3.16. Canada agronomic indicators by sub-national regions, current season's values and departure, April-July 2022
| CALF | Maximum VCI | ||
| Region | Current(%) | Departure from 5YA (%) | Current |
| Saint Lawrence basin | 100 | 0 | 0.92 |
| Prairies | 98 | 1 | 0.93 |