This reporting period covers the sowing and growing stages of maize, and the growth and harvest of wheat. Among the CropWatch agro-climatic indicators, RAIN (+14%) and RADPAR (+2%) were above average, while TEMP (-0.3°C) was slightly below average. The combination of the factors resulted in an above-average BIOMSS (+3%) compared to the 15YA. As we can see from the time series of rainfall profile, the precipitation was above the 15-year average from early May to late June. From the time series temperature profile, the temperature was only higher than the 15YA in early and middle April, early May, and late July. The lower temperature was favorable for pastures. The nationwide crop conditions were around average throughout the whole monitoring period. The spatial NDVI clustering profile shows that 13.4% of the cropped areas (marked in dark green) enjoyed near to substantially above-average crop conditions during the whole monitoring period (especially the positive NDVI departure by almost 0.2 in early May). Light green marked regions (17.1% of the cropped areas) had slightly below-average crop conditions throughout the whole monitoring period, mainly distributed in some parts of Jala-Abad, Naryn and Osh. Orange marked regions (15.7% of the cropped areas) had below-average crop conditions at the beginning of the monitoring period and recovered to near average from middle April on, mainly distributed in southern Jala-Abad and northern Osh. The remaining regions had approximately near average crop conditions during the whole monitoring period. The spatial pattern of maximum Vegetation Condition Index (VCIx) was in accord with the spatial distribution of the NDVI profiles. CALF increased by 1% and the nationwide VCIx average was 0.91. Crop conditions in Kyrgyzstan can be assessed as favorable. Above-average wheat yields should be expected. Maize harvest will start in September.
Figure 3.25 Kyrgyzstan's crop condition, April - July 2022
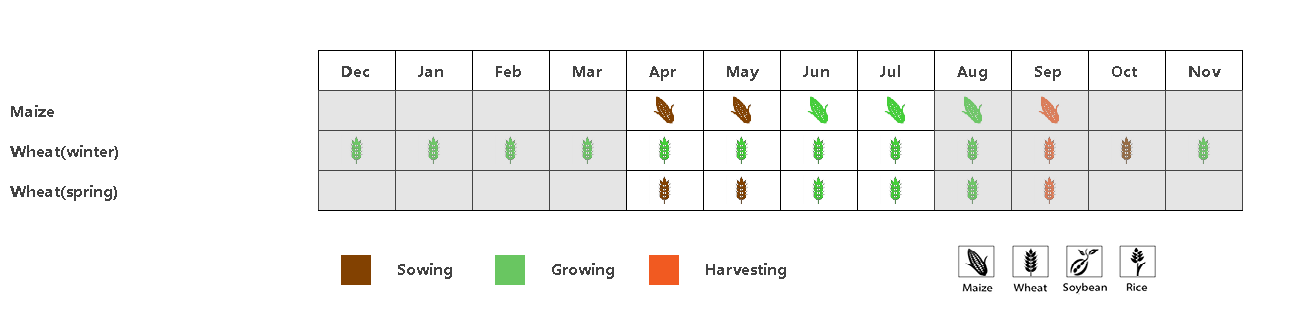
(a). Phenology of major crops
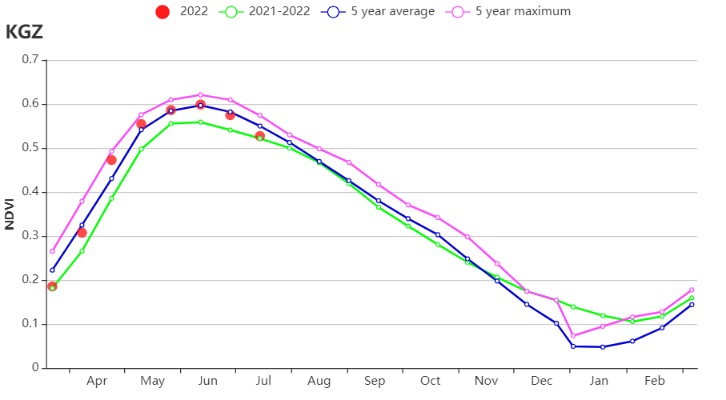
(b) Crop condition development graph based on NDVI
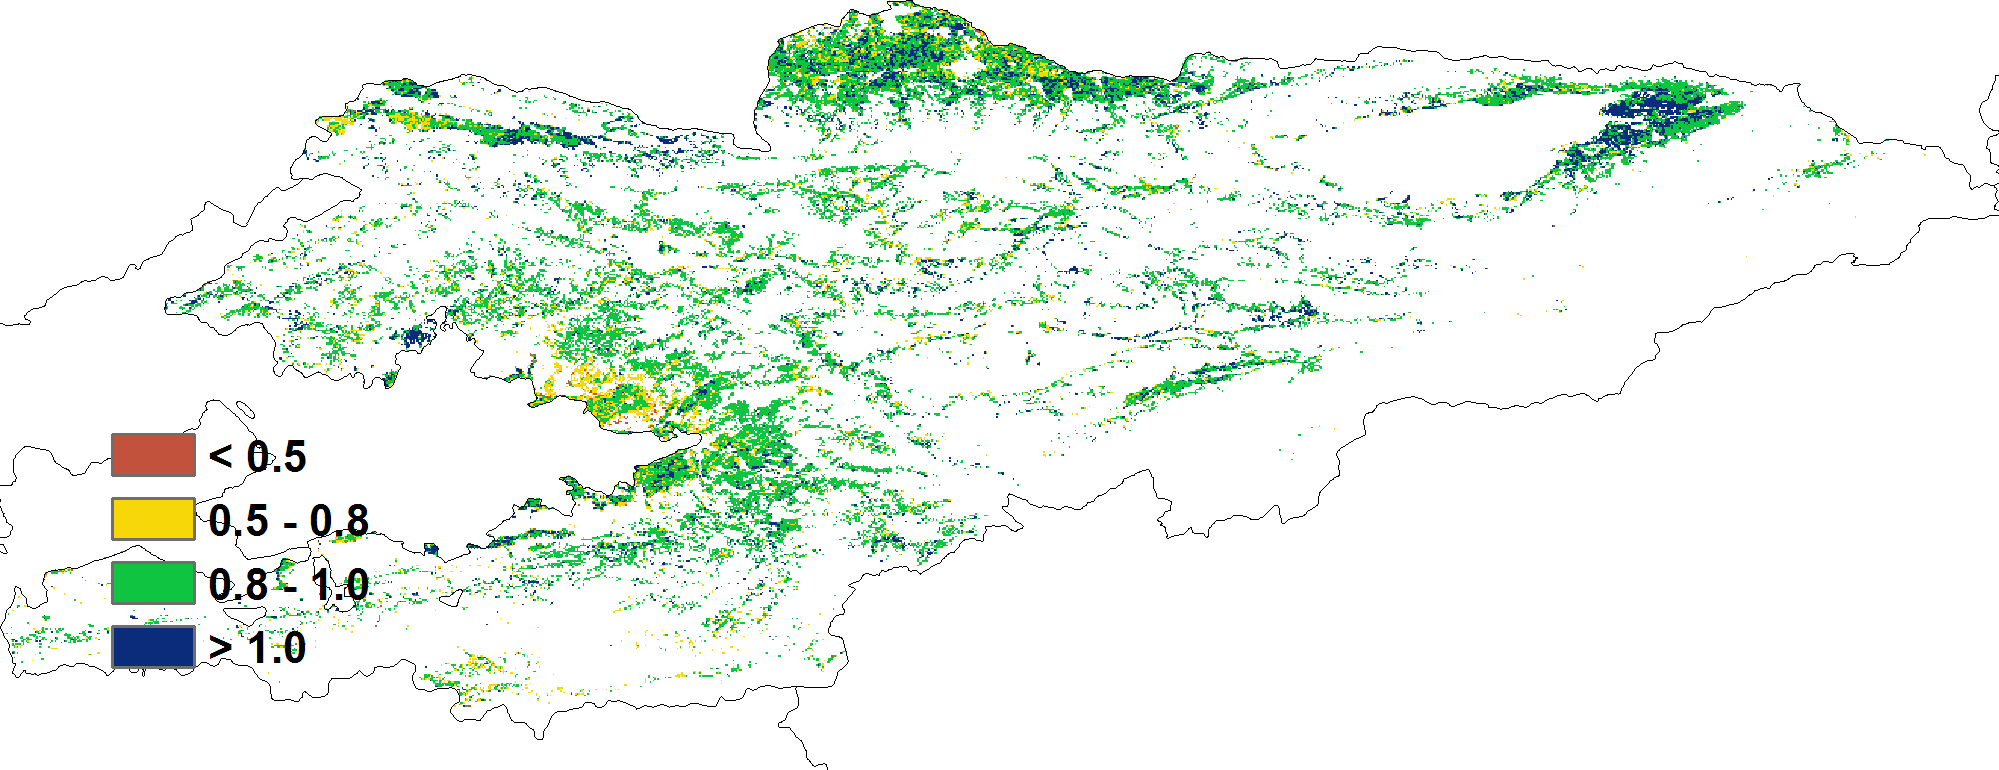
(c) Maximum VCI
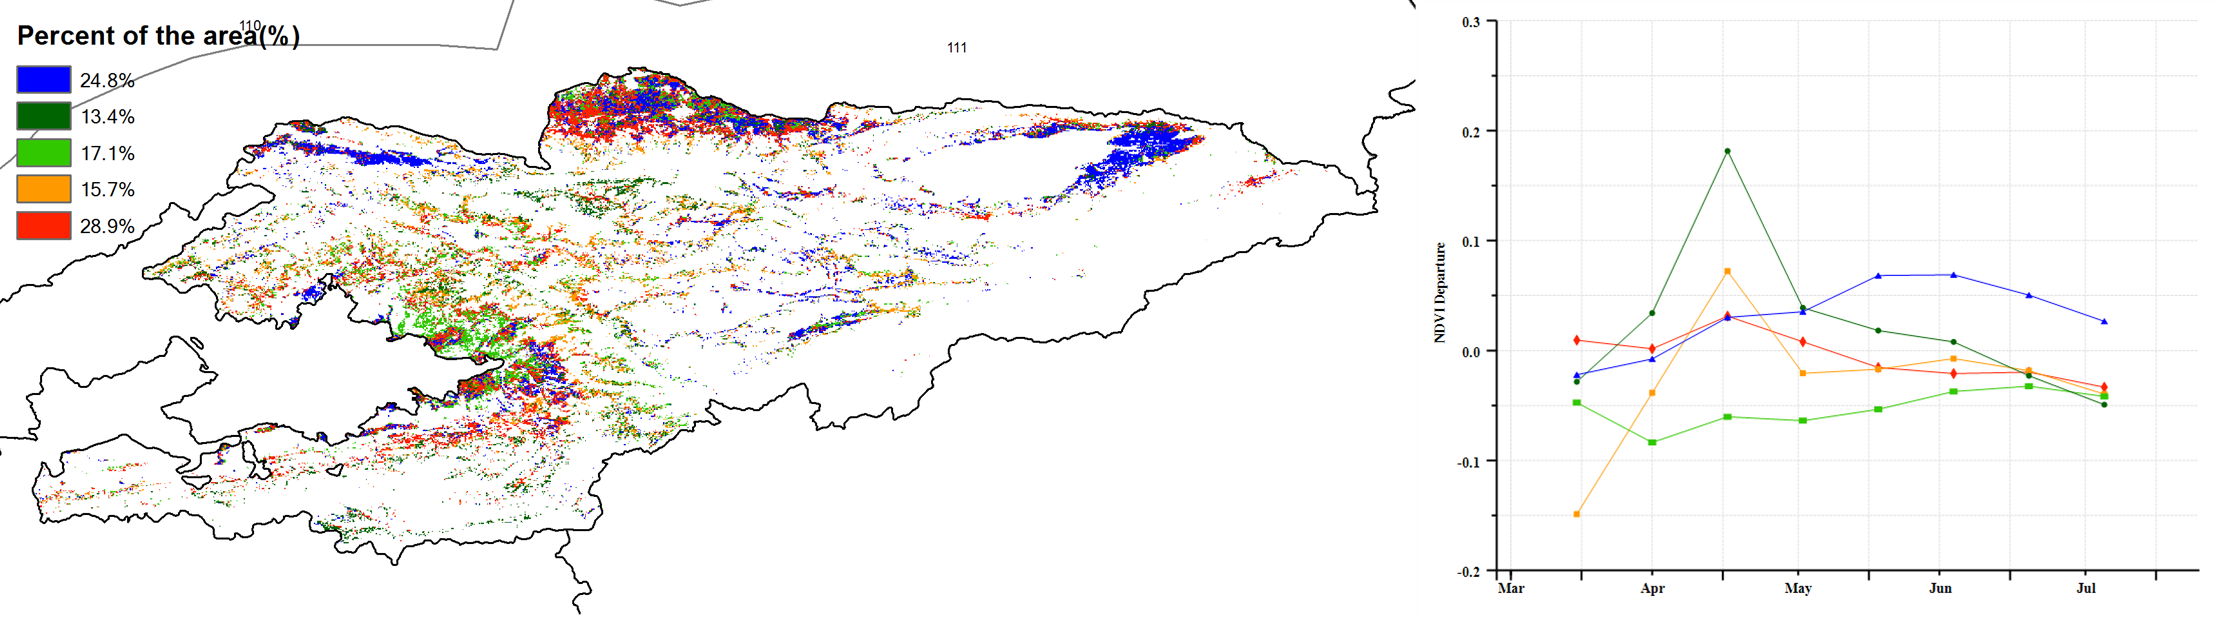
(d) Spatial NDVI patterns compared to 5YA (e) NDVI profiles
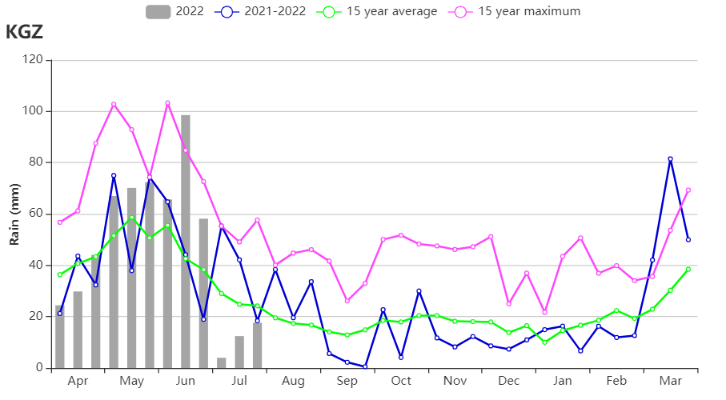
(f) Time series rainfall profile
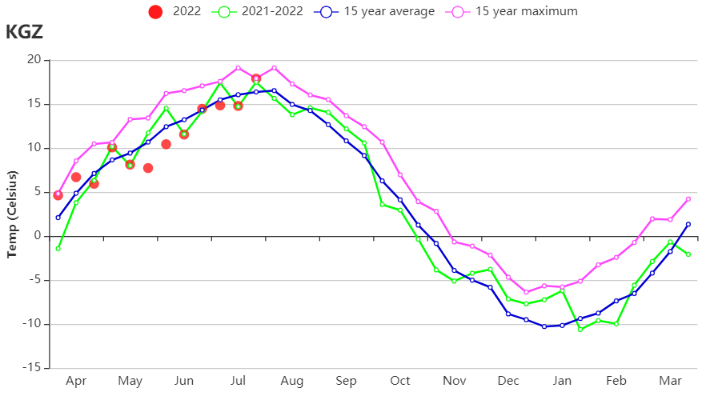
(g) Time series temperature profile
Table 3.41 Kyrgyzstan agro-climatic indicators, current season's values and departure from 15YA, April - July 2022
| Region | RAIN | TEMP | RADPAR | BIOMSS | ||||
| Current (mm) | Departure from 15YA (%) | Current (°C) | Departure from 15YA (°C) | Current (MJ/m2) | Departure from 15YA (%) | Current (gDM/m2) | Departure from 15YA (%) | |
| Kyrgyzstan | 564 | 14 | 10.6 | -0.3 | 1495 | 2 | 709 | 3 |
Table 3.42 Kyrgyzstan agronomic indicators, current season's values and departure from 5YA, April - July 2022
| Region | CALF | Maximum VCI | |
| Current(%) | Departure from 5YA (%) | Current | |
| Kyrgyzstan | 97 | 1 | 0.91 |