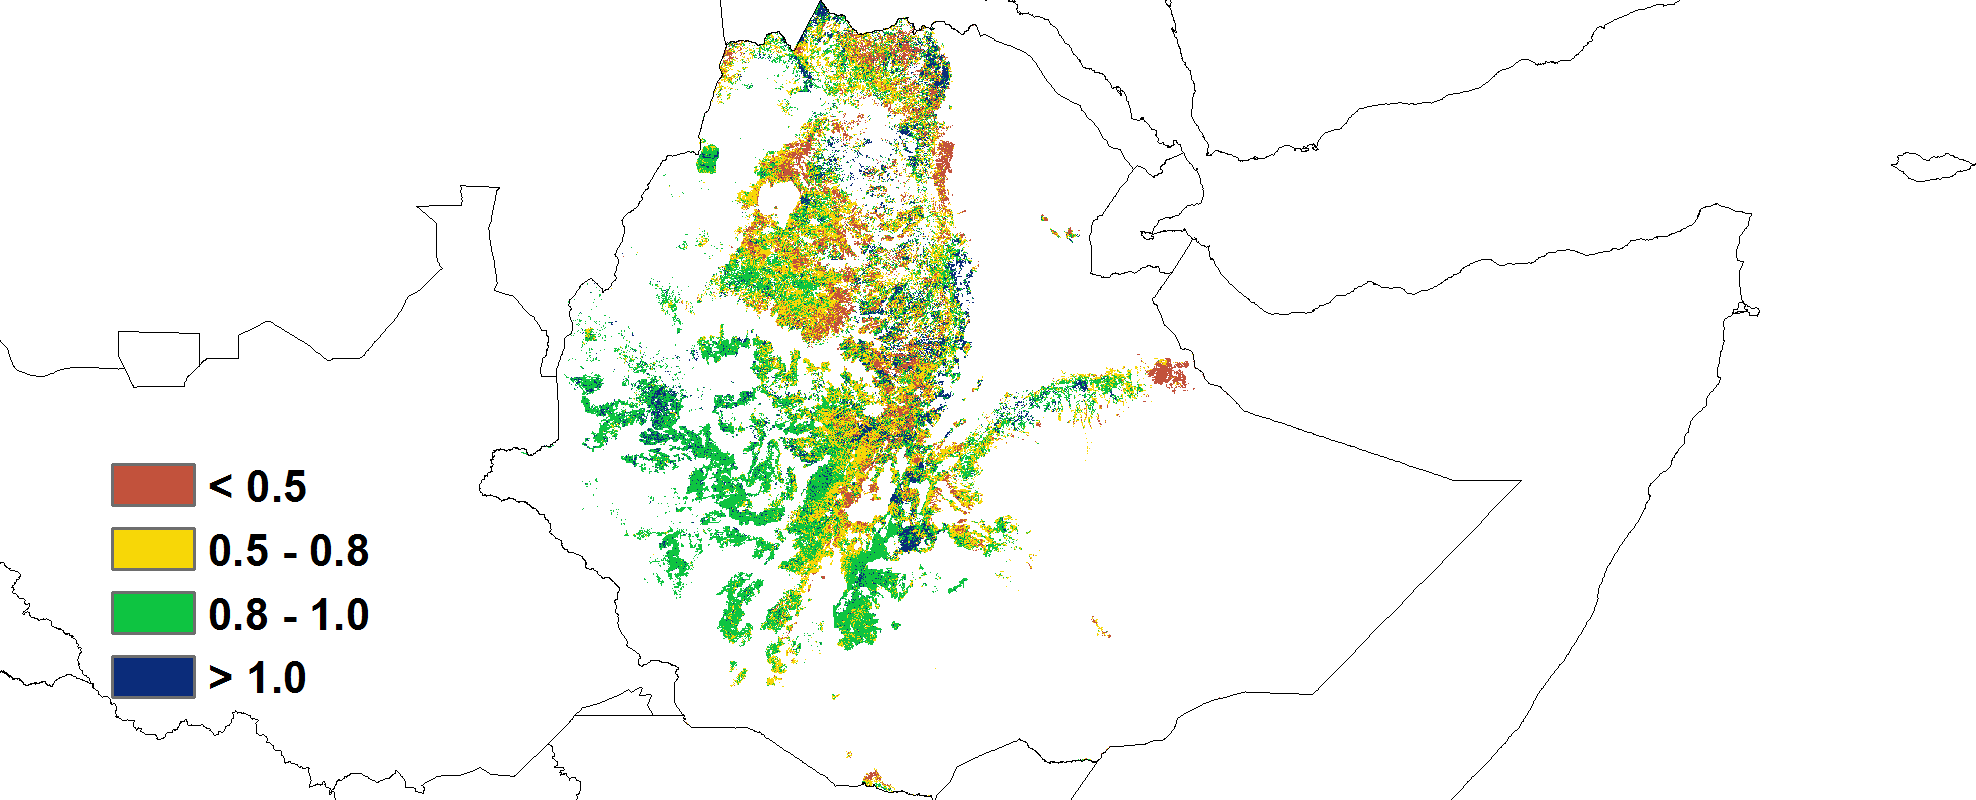
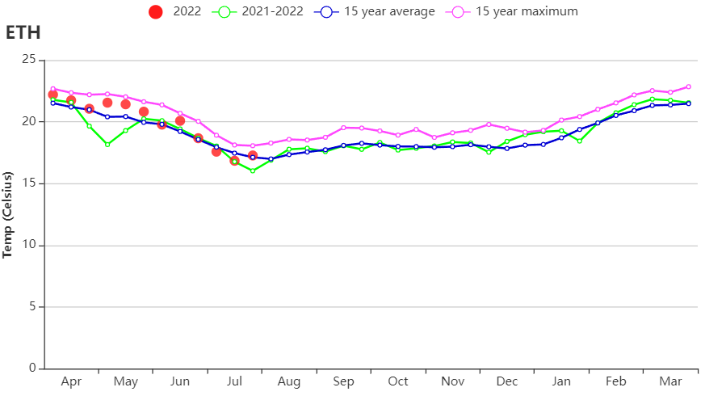
This monitoring period from April to July covers the Meher crops planting season. At the national level, the drought that had already been observed during the previous monitoring period, adversely affected the planting of maize, wheat, and barley. The cumulative precipitation had dropped by 34% from the 15YA, average temperature (+0.4°C) and photosynthetic effective radiation (+4%) were slightly higher than the 15YA. The largest precipitation deficit had been recorded for May, which is a critical month for planting. The drought resulted in a 16% reduction in biomass, compared to the 15YA. The crop condition development graph based on NDVI for Ethiopia presents below-average values after May, mainly due to delayed planting and poor crop development caused by dry weather in eastern Ethiopia. The NDVI departure clustering map shows a negative departure in the east. The average Maximum VCI for Ethiopia was 0.78. The Maximum VCI graph shows the same pattern as the NDVI departure clustering map. The cropped arable land fraction decreased by 8% compared to the 5YA. In Ethiopia, only 4.9% of the land is irrigated. In short, crop planting and development were negatively affected by below-average precipitation. The east and the north were the regions that were most adversely affected by the drought conditions.
Regional analysis
The agroclimatic conditions in semi-arid pastoral areas, southeastern mendebo highlands zone, and south-eastern mixed maize zone were similar: low precipitation, but average temperature and adequate photosynthetically active radiation. As a result, the estimated cumulative biomass was reduced by 13%, 28%, and 29% in the three regions compared to the 15YA. The NDVI was also below the average level after May, which means that the forage growth and maize sowing were affected by the drought. In addition, the cropped arable land fraction in the semi-arid pastoral areas dropped by 64% and the maximum VCI was 0.41, which implies a significant decrease in forage production in the area. It also negatively affected maize production.
The agroclimatic conditions in the western mixed maize zone were different. There was a slight decrease in rainfall (-20%), and the effect on cumulative biomass (-9%) was minimal. The cropped arable land fraction did not change (0%) either. The NDVI was near the 15YA and the maximum VCI at 0.93. Conditions for maize cultivation in this region can be assessed as close to normal.
The northern arid area is important for local crop production. Due to the war, the cropped arable land fraction was almost zero and the local food shortage, which had started a year ago, is continuing.
Figure 3.15 Ethiopia’s crop condition, April 2022-July 2022
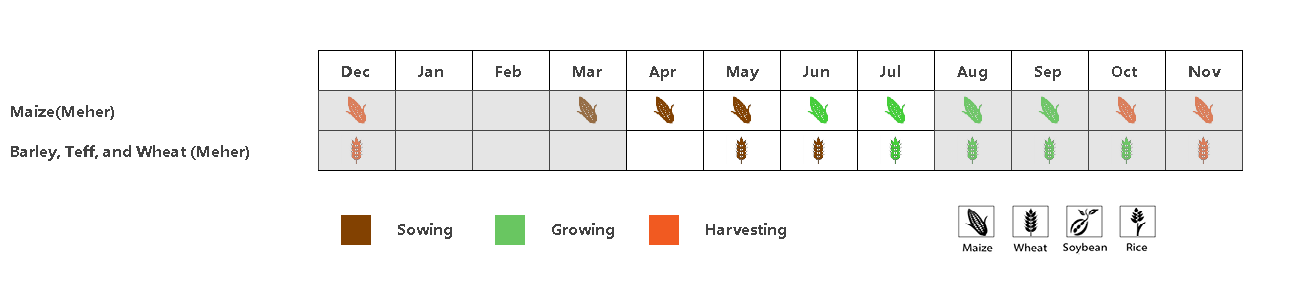
(a) Phenology of major crops
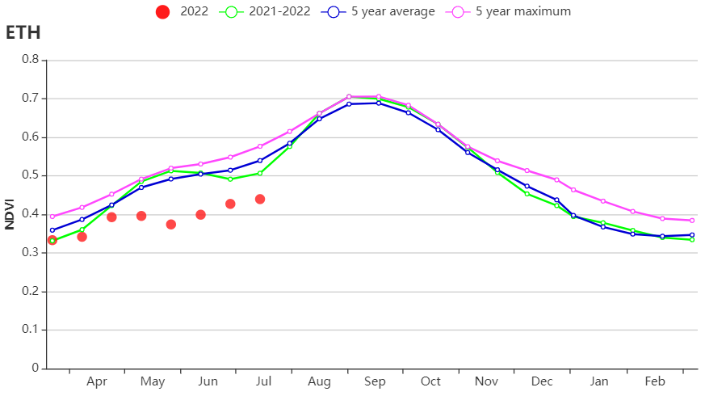
(b) Crop condition development graph based on NDVI (c) Maximum VCI

(d) Spatial NDVI patterns compared to 5YA (e) NDVI profiles
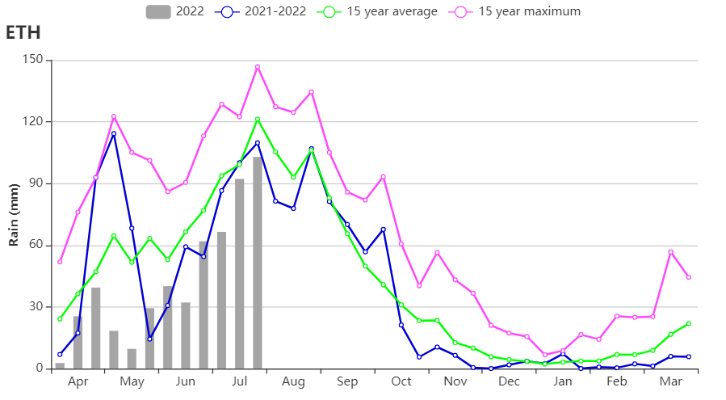
(f) Rainfall profiles (g) Temperature profiles
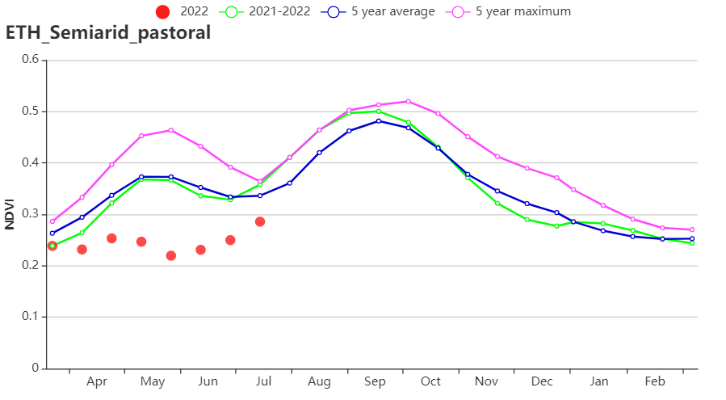
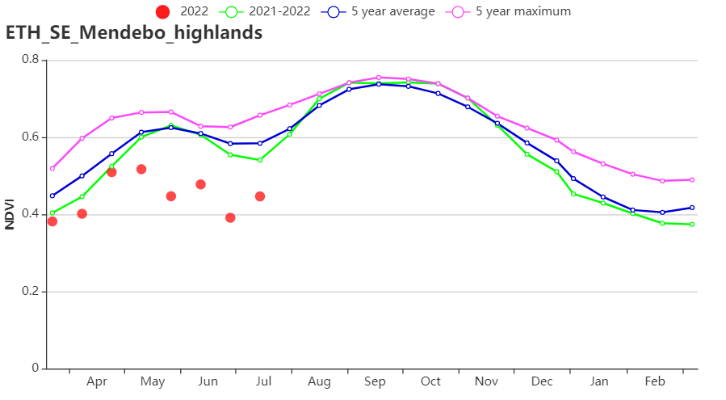
(h) Crop condition development graph based on NDVI (Semi‐arid pastoral (left) South‐eastern Mendebo highlands (right))
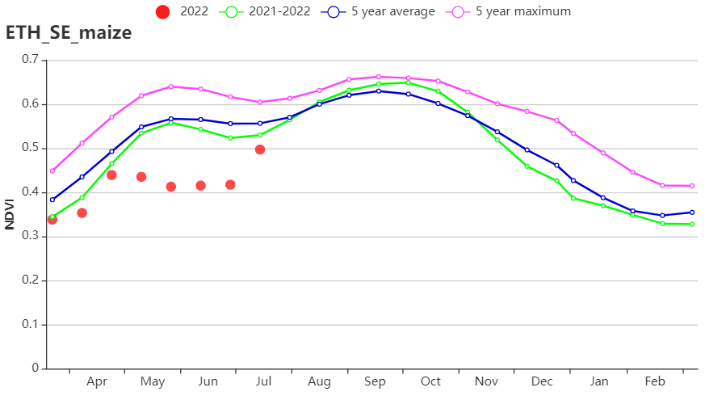
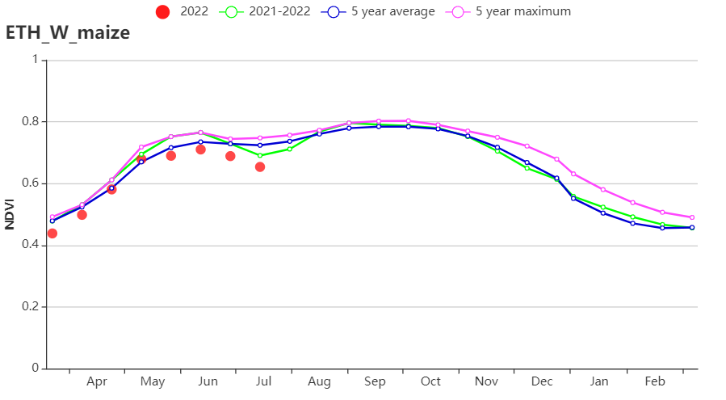
(i) Crop condition development graph based on NDVI (South‐eastern mixed maize zone (left) and South‐eastern mixed maize zone (right))
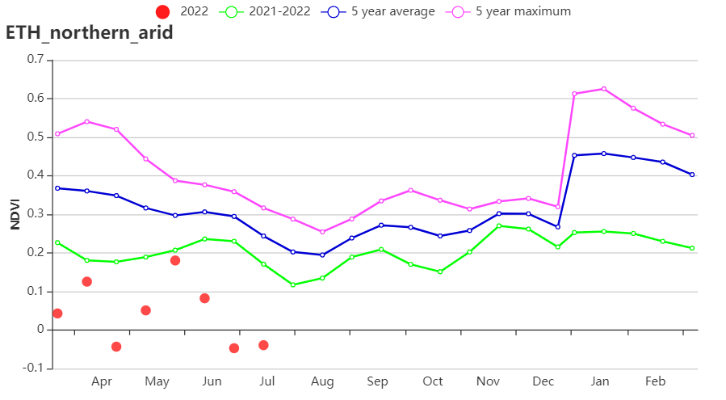
(j) Crop condition development graph based on NDVI (Northern arid area)
Table 3.21 Ethiopia’s agroclimatic indicators by sub‐national regions, current season's values, and departure from 15YA, April-July 2022
Region | RAIN | TEMP | RADPAR | BIOMSS | ||||
Current (mm) | Departure (%) | Current (°C) | Departure (°C) | Current (MJ/m2) | Departure (%) | Current (gDM/m2) | Departure (%) | |
Semi‐arid pastoral areas | 114 | -45 | 25.2 | 1.6 | 1394 | 0 | 645 | -13 |
South‐eastern Mendebo highlands | 236 | -58 | 15.8 | 0.2 | 1227 | 4 | 625 | -28 |
South‐eastern mixed maize zone | 183 | -63 | 19.3 | 0.6 | 1225 | 1 | 650 | -29 |
Western mixed maize zone | 984 | -20 | 21.5 | 0.1 | 1189 | 7 | 1160 | -9 |
Northern arid area | 156 | 75 | 30.0 | -0.5 | 1430 | 0 | 755 | 14 |
Table 3.22. Ethiopia’s agronomic indicators by sub‐national regions, current season's values, and departure from 5YA, April-July 2022
Region | Cropped arable land fraction | Maximum VCI | |
Current (%) | Departure (%) | Current | |
Semi‐arid pastoral areas | 15 | -64 | 0.41 |
South‐eastern Mendebo highlands | 97 | -2 | 0.83 |
South‐eastern mixed maize zone | 89 | -5 | 0.78 |
Western mixed maize zone | 100 | 0 | 0.93 |
Northern arid area | 0 | -100 | 0.31 |