During the monitoring period, winter wheat reached maturity in April and was harvested in May. Rice and maize planting started in April. Total rainfall was at 2 mm, which was 75 mm less than the 15YA. The average temperature was higher than the 15YA by 0.6 ℃. The temperature index graph shows that it fluctuated around the 15YA during the monitoring period. RADPAR and BIOMSS were below the 15YA by 0.7% and 21%. The reduction in BIOMSS can be attributed to the remarkable rainfall reduction. The CALF was higher than the 5-year average (5YA) by 2% and VCIx was at 0.80. The nationwide NDVI development graph indicates that the crop conditions followed the 5YA trend until mid-May and subsequently remained below average, but reached close to average levels by the end of July. The NDVI spatial pattern shows that only 11.1% of the cultivated area was above the 5YA, 59.9% fluctuated around the 5YA, and 29% were below the 5YA. Overall, the crop conditions for winter wheat were favorable. Conditions for summer crops reached average levels by the end of this monitoring period.
Regional analysis
Based on crop planting systems, climate zones, and topographical conditions, Egypt can be divided into three agro-ecological zones (AEZs), two of which are suitable for crop cultivation, namely the Nile Delta and the southern coast of the Mediterranean and the Nile Valley. Rainfall was below the 15YA by 71 mm and 80 mm, the temperature was above the 15YA only by 0.6 ℃ and 0.2 ℃, the RADPAR was below the 15YA only by 0.9%, and 1.5% for the Nile Delta and the southern coast of the Mediterranean and the Nile Valley respectively. The BIOMSS was at the 15YA in the first zone while it was below the 15YA by 64% in the second zone. The CALF was only 2% below the 5YA for the two zones, and the VCIx was 0.86, and 0.79 for the first and second zones, respectively. The NDVI-based crop condition development graphs show similar conditions for both zones following the national crop development NDVI graph, which was discussed above.
Figure 3.14 Egypt's crop condition, April-July 2022
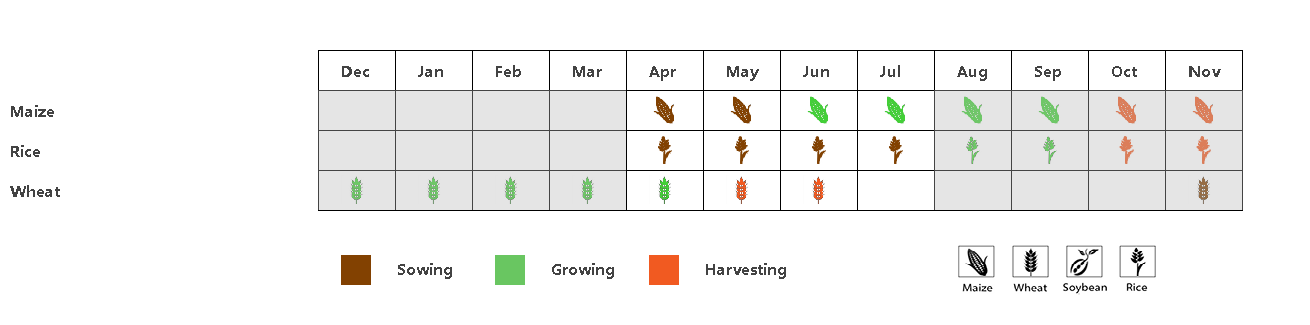
(a). Phenology of major crops
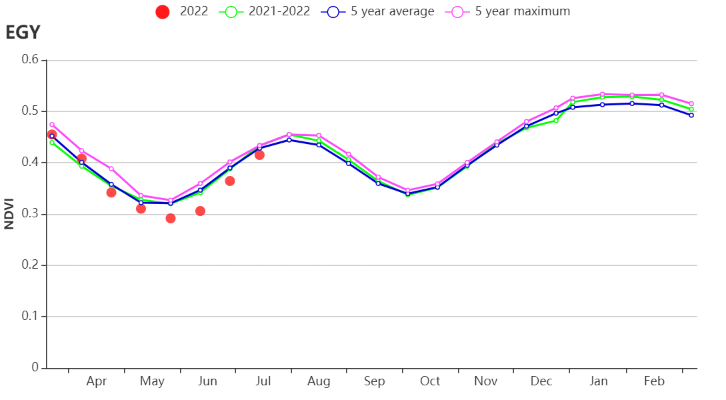
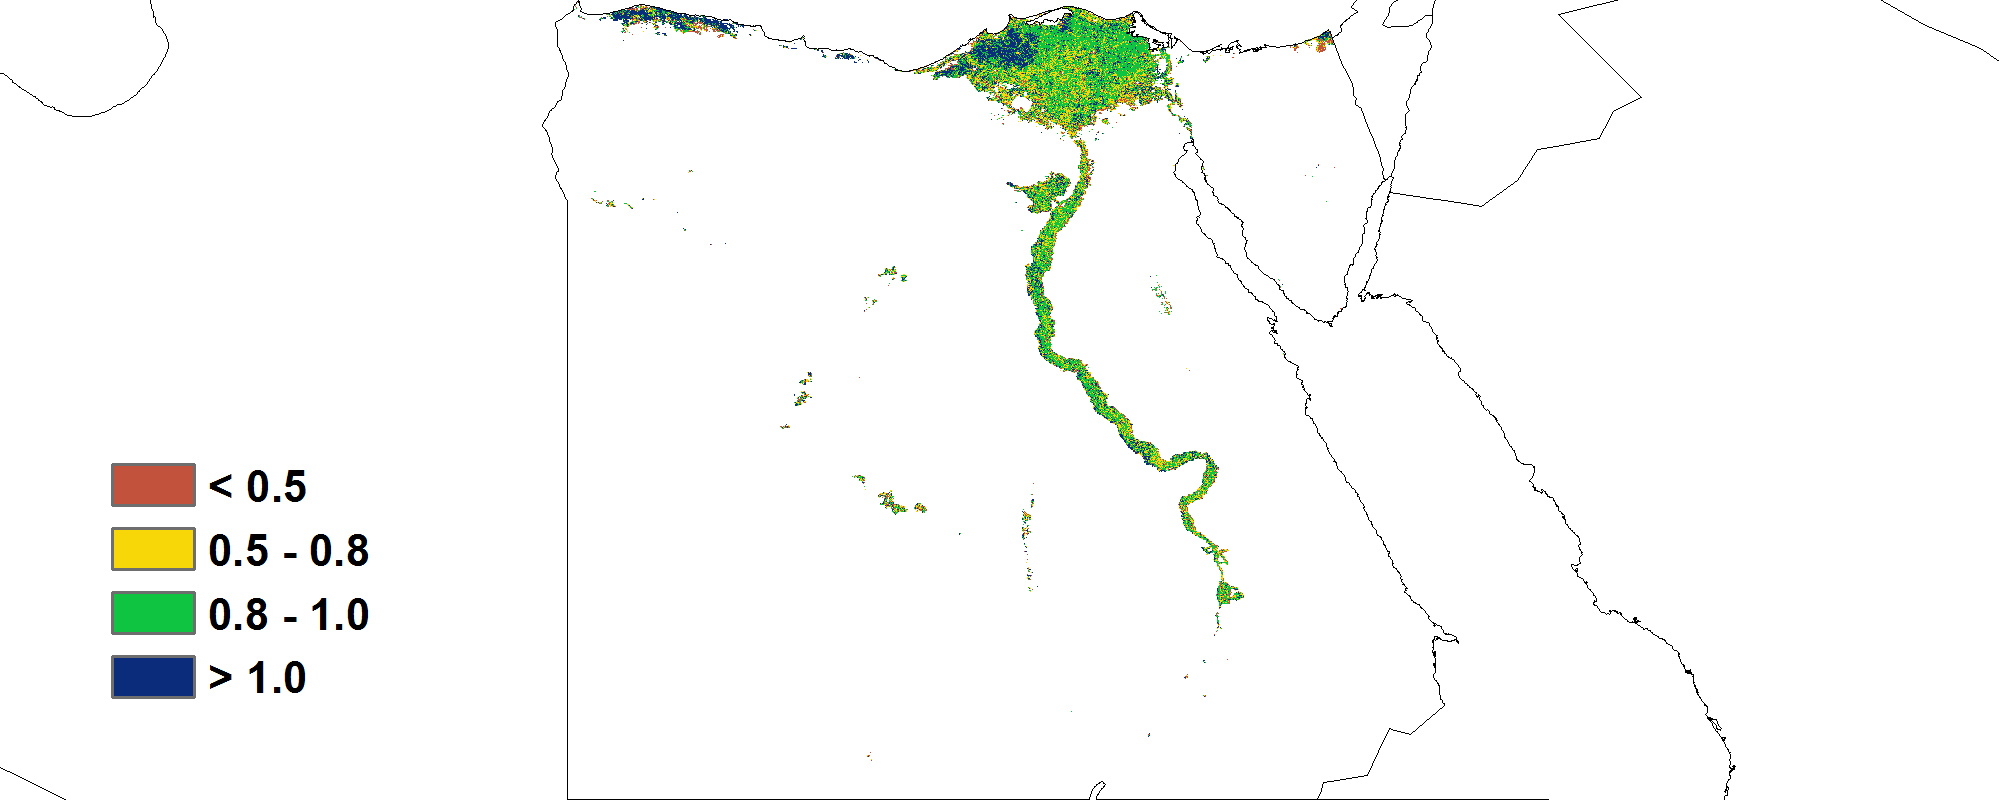
(d) Spatial NDVI patterns compared to 5YA (e) NDVI profiles
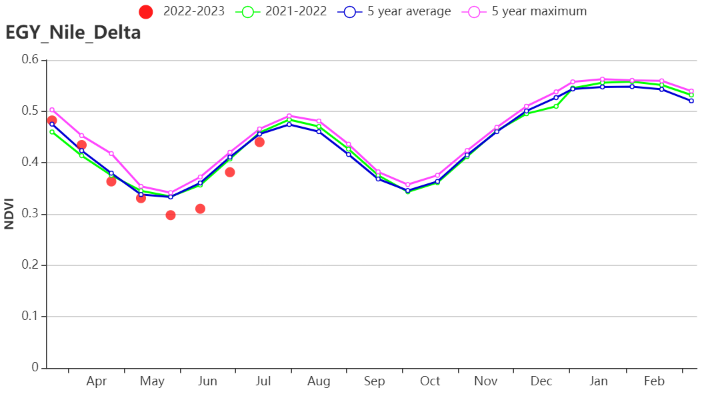
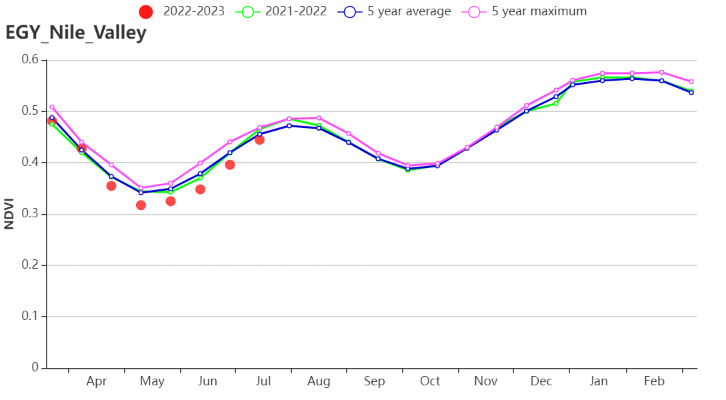
(f) Crop condition development graph based on NDVI (Nile Delta (left) and Nile Valley (right))
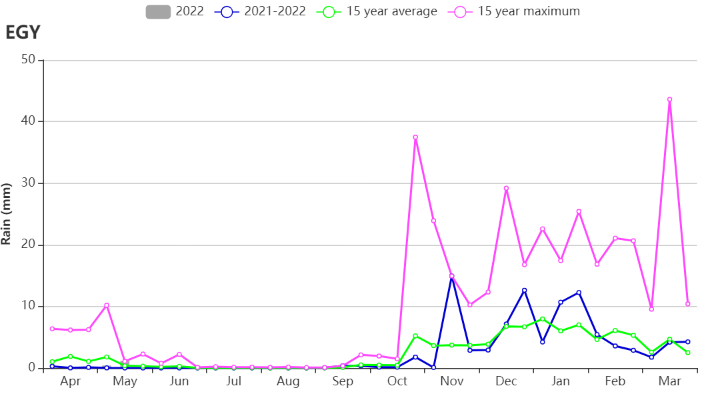
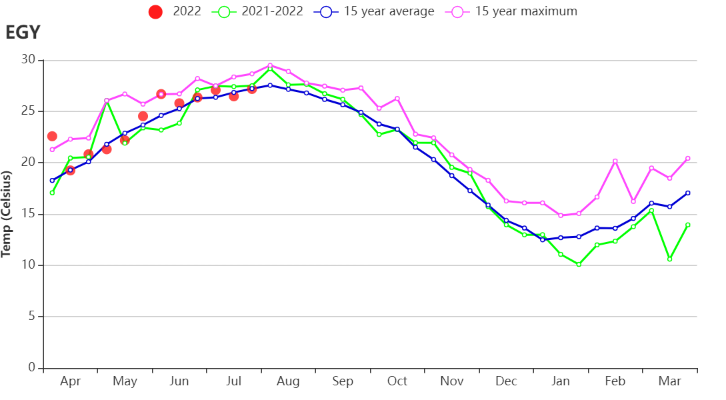
(g) Time series profile of rainfall (h) Time series profile of temperature
Table 3.20 Egypt's agroclimatic indicators by sub-national regions, current season's values, and departure from 15YA, April-July 2022
RAIN | TEMP | RADPAR | BIOMSS | |||||
Region | Current (mm) | Departure from 15YA (%) | Current (°C) | Departure from 15YA (°C) | Current (MJ/m2) | Departure from 15YA (%) | Current (gDM/m2) | Departure from 15YA (%) |
Nile Delta and Mediterranean coastal strip | 2 | -71 | 24.1 | 0.6 | 1576 | -0.9 | 523 | 0 |
Nile Valley | 0 | -80 | 26.8 | 0.2 | 1611 | -1.5 | 145 | -64 |
Table 3.19 Egypt's agronomic indicators by sub-national regions, current season's values, and departure from 5YA, April-July 2022
CALF | Maximum VCI | ||
Region | Current (%) | Departure from 5YA (%) | Current |
Nile Delta and Mediterranean coastal strip | 66 | 2 | 0.86 |
Nile Valley | 70 | 2 | 0.79 |