During this reporting period, winter wheat harvest was completed in July and sown in October. Based on the agroclimatic and agronomic indicators, the crop conditions in Italy were slightly below the 5-year average during this reporting period.
在本次监测期间,冬小麦在 7 月完成收割,2021-22 年作物在 10 月进行播种。根据农业气候指标,意大利的作物状况在本期略低于5年平均水平。
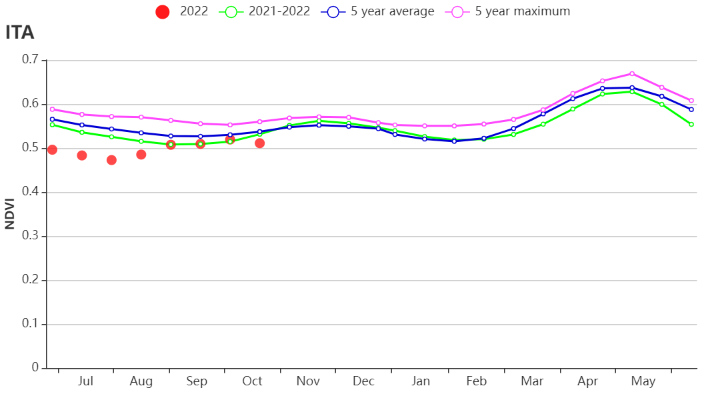
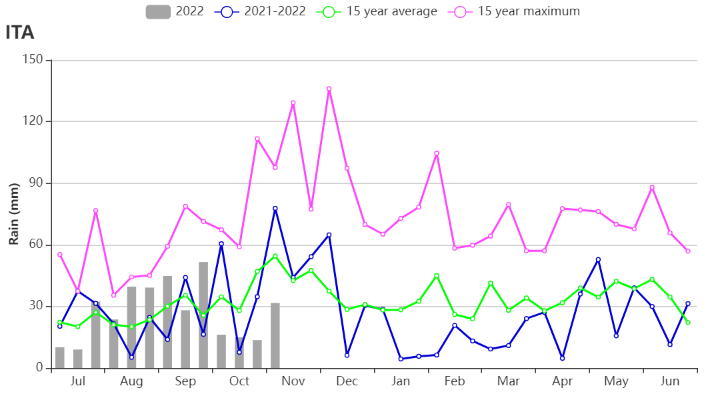
At the national level, rainfall was below the 15YA (-4%). The radiation and temperature were unchanged. Potential biomass production was 1% above average. CALF was 85%. The national VCIx was 0.75. The crop condition development graph indicates that NDVI was below average in July and August, and near the 5YA in September and October. In summary, the overall crop conditions were far below average in July and August.
在全国范围内,累计降水量(-4%)低于15年平均水平。光合有效辐射和平均气温接近平均水平。降水量在8至9月降高于平均水平,这有利于小麦生长。潜在累积生物量低于平均水平1%。CropWatch 农情指标监测结果表明,耕地种植比例为 85%,最佳植被状况指数为0.75,大部分耕地的最佳植被状况指数均在0.80以上。作物状况生长过程线显示NDVI在七月和八月低于平均水平,九月和十月接近五年平均水平。总的看来,本监测期内的整体作物状况低于平均水平。
About 18.6% of the crops (areas in red color), mainly located in the north Italy (Piemonte and Lombardia), showed a positive departure from the 5YA from September to October. 11.0% of arable land experienced below-average crop conditions (areas in light green color), scattered in Umbria, Molise and Marche. About 21.4% (areas in green color) of arable land, mainly in Lombardia, Lazio and Sardegna, experienced below-average crop conditions between July and August, above-average conditions between September and October. On about 20.0% (areas in yellow color) of arable land, NDVI was near average. For the remaining 19.1% (areas in blue color) of arable land, NDVI remained above average. The crop production index was 0.91.
约18.6%耕地的作物状况在9-10月高于近5年平均水平,主要位于意大利北部地区(皮埃蒙特和伦巴蒂大区)。约11.0%耕地(浅绿色区域)的作物状况在监测期内低于平均水平,零星分布于翁布里亚、莫利塞和马尔凯地区。约21.4%耕地(深绿色区域)的作物状况在7-8月低于平均水平,在9-10月高于平均水平。约20.0%耕地(黄色区域)的NDVI接近平均水平。其余19.1%的耕地(蓝色区域),NDVI 高于平均水平。作物生产形式指数为0.91。
Regional analysis
Based on cropping systems, climatic zones and topographic conditions, four sub-national regions can be distinguished for Italy. These four regions are East coast (108), Po Valley (105), Islands (107) and Western Italy (106).
根据种植系统,气候带和地形条件,将意大利划分为四个区域:意大利东部地区(108)、波河平原(105)、岛屿(107)和意大利西部地区(106)。
East coast (mainly in Puglia, Marche and Abruzzi) experienced below-average rainfall (RAIN -20%), above-average temperature (TEMP +1%) and solar radiation (RADPAR +1%). The precipitation was above average in early August and September, but below average in July and October. The potential biomass production showed a decrease (BIOMSS -3%). VCIx was 0.73. The Cropping Intensity was 104%, cropped arable land fraction was 58%, and crop production index was 0.87. The crop condition development graph indicates that NDVI was below average in July and August and conditions were generally below average.
意大利东部地区(主要位于普利亚,马尔凯和阿布鲁齐)与过去15年同期平均水平相比,降水量偏低20%,气温偏高1%,光合有效辐射偏高1%。累计降水在八月和九月高于平均值,在七月和十月低于平均值。潜在累积生物量低于平均水平3%。最佳植被状况指数为0.73。复种植被指数为104%。耕地种植比例为58%,作物生产指数为0.87。根据NDVI作物生长过程线显示NDVI值在七月和八月低于5年平均水平,并且作物生长状况低于平均水平。
Crop production in the Po Valley (mainly in Piemonte, Lombardia and Veneto) was affected by slightly higher rainfall (RAIN +8%) and temperature (TEMP +2%). The solar radiation was unchanged. BIOMSS was above the 15YA by 10% and VCIx was 0.70. The Cropping Intensity was 101%, Cropped arable land fraction was 97%, crop production index was 0.84. The crop condition development graph indicates that the crop condition was far below average in July and August. According to the agro-climatic indicators, a below-average output can be expected, especially due to the poor conditions in July and August and conditions were generally below average.
意大利北部(主要在皮埃蒙特,伦巴第大区和威尼托州)的作物农气条件显示,与过去15年同期平均水平相比,累计降水量偏高8%,平均气温偏高2%,光合有效辐射没有变化。潜在累积生物量比是5年平均偏高10%。最佳植被状况指数达到0.70。复种植被指数为101%,耕地种植比例为97%,作物生产指数为0.84。NDVI作物生长过程线显示,NDVI在七月和八月低于平均水平。根据农业气候指标,由于7月和8月较差的条件,作物生长状况普遍低于平均水平,可以预计产量低于平均水平。
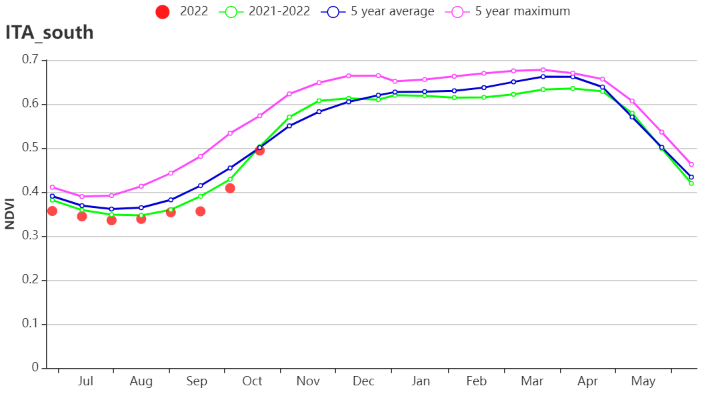
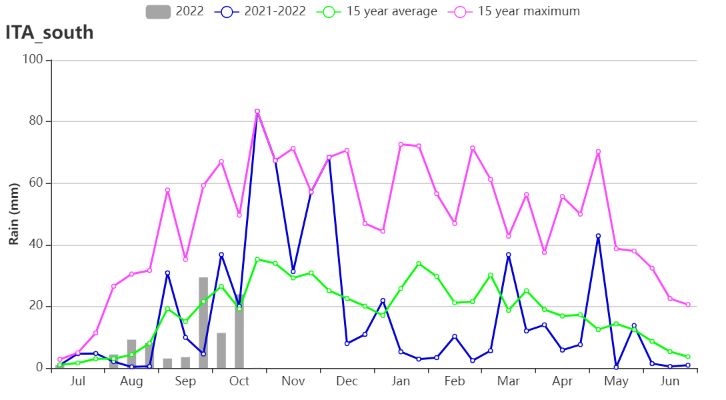
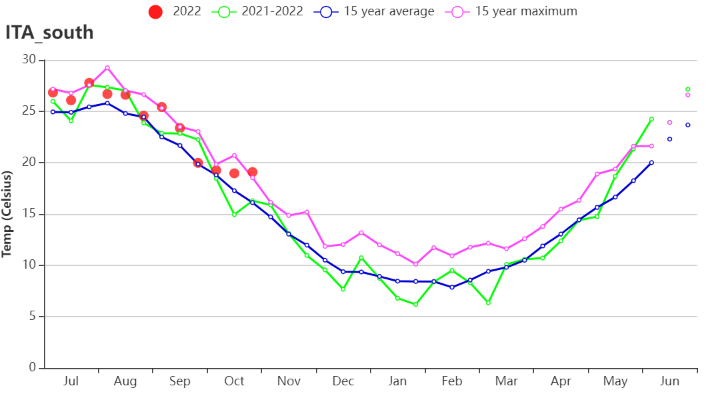
The Islands recorded below-average precipitation (RAIN -40%) and slightly above-average temperature (TEMP +2°C). RADPAR was slightly below average (-1%). BIOMSS decreased by 11% compared with the 15YA. The maximum VCI was only 0.68, which is the lowest among the four AEZs in Italy. And the Cropping Intensity is the lowest in the four regions. Crop production index reached 1.14, the highest in the AEZs. NDVI was very close to average throughout the monitoring period. The crop production in this region is expected to be slightly below average.
意大利南部的降水量与过去15年同期平均水平相比偏低40%,平均气温偏高2°C,光合有效辐射略低1%,潜在累积生物量偏低11%。最佳植被状况指数在意大利四个主要区域中为最低(0.68)。复种植被指数为四个区域中最低的。作物生产指数是四个区域中最高的,为作物生产指数为1.14。在整个监测期间,NDVI接近平均水平。该地区的农作物产量预计将略低于平均水平。
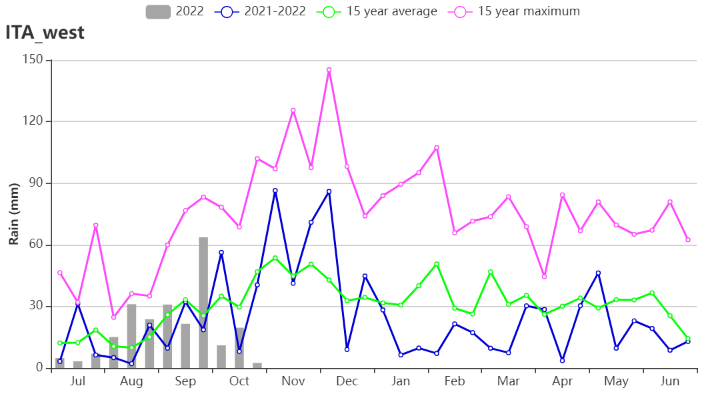
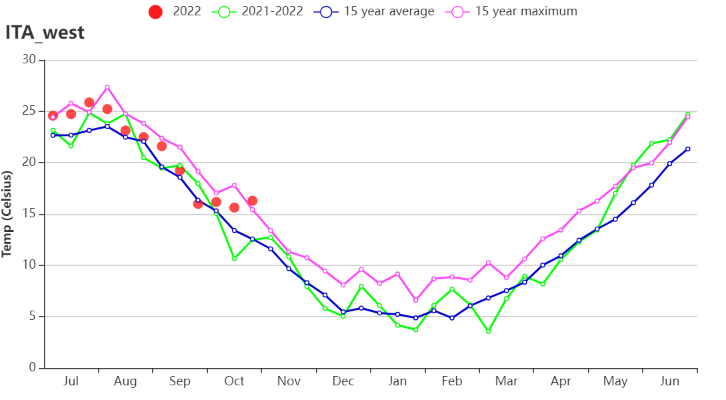
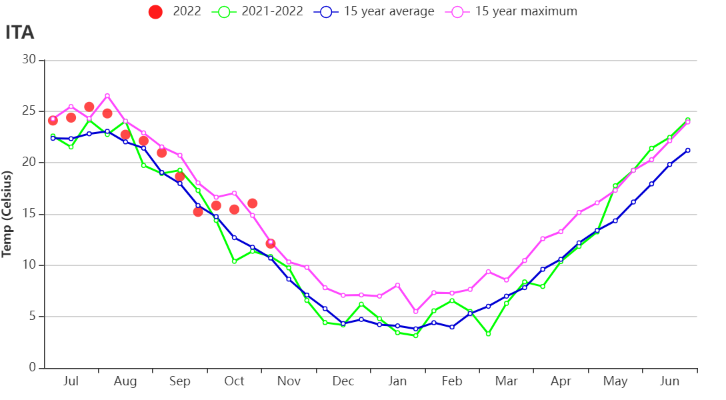
In Western Italy, RAIN was below average (-15%) and TEMP was above average (+2%). The RADPAR was unchanged. The precipitation was below average in July and August, and the biomass production potential decreased in this region by 4%. The Cropping Intensity was 125%, which is the highest in the four AEZs. The NDVI was slightly below average in July and August. VCIx was 0.69. CropWatch expects a significant below-average production.
在意大利西部地区,降水量与过去15年同期平均水平相比偏低15%,平均气温偏高2%,光合有效辐射保持不变。由于累计降水在七月和八月低于平均水平,潜在累积生物量在该地区偏低4%。复种植被指数为四个区域中最高的(125%)。NDVI值在七月和八月低于平均水平。最佳植被状况指数为0.69。预计该地区产量将大大低于平均水平。

(a). 主要作物物候历
(b) 基于NDVI、降水量和气温的作物生长过程线
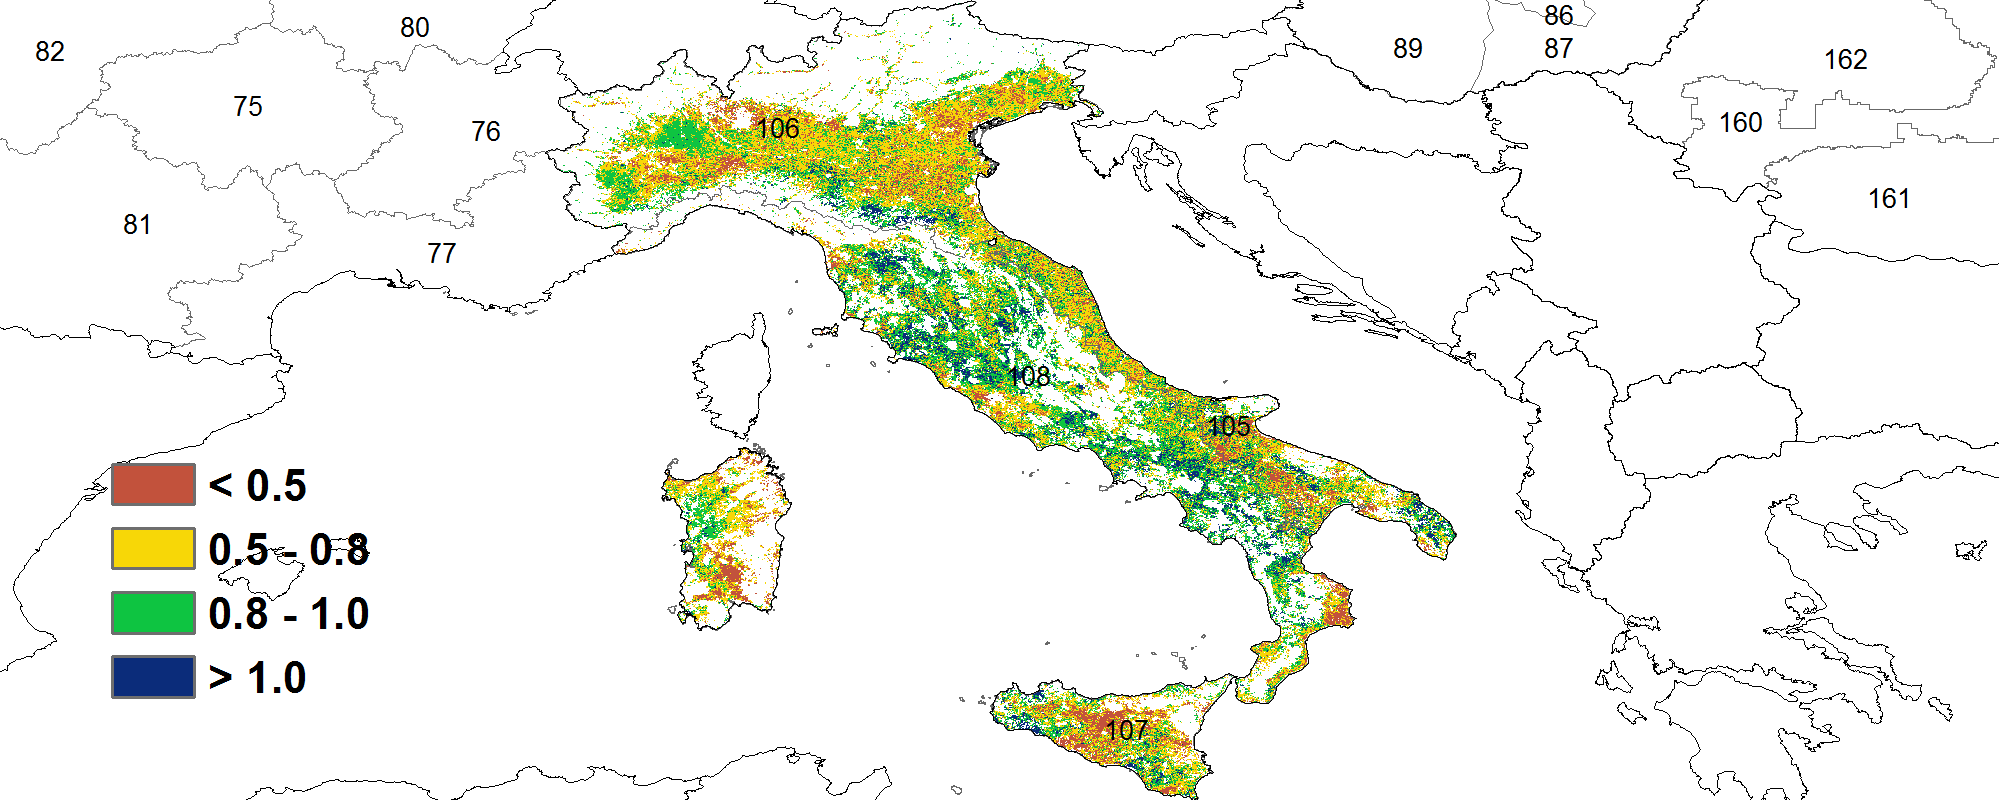
(c)最佳植被状况指数(意大利)
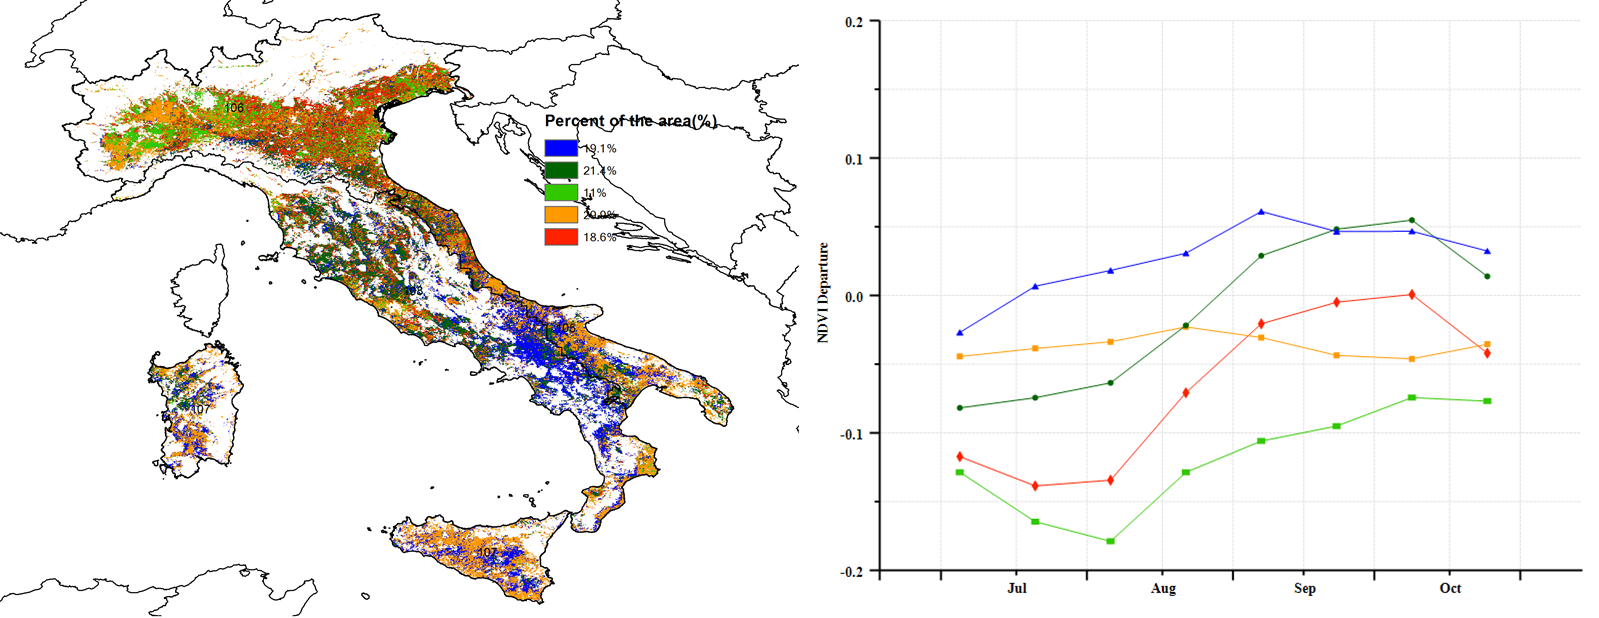
(d)NDVI距平空间聚类图(左)及相应的类别过程曲线(右)(意大利)
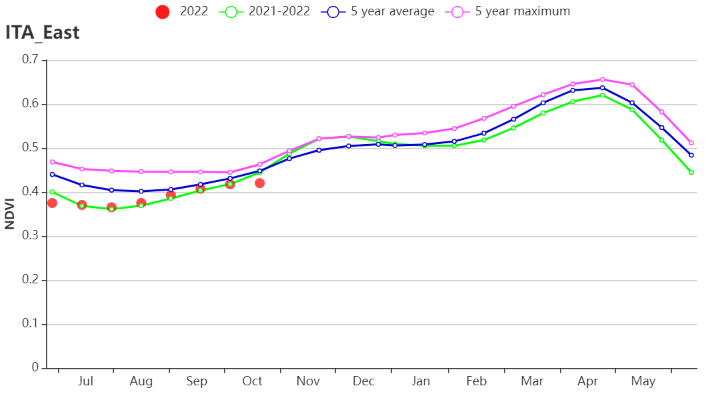

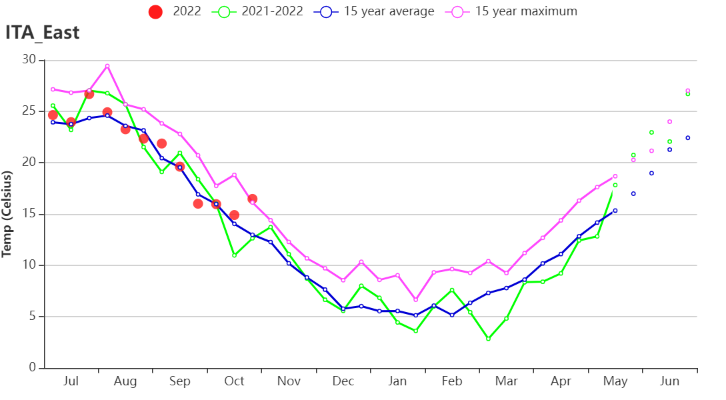
(e) 基于NDVI、降水量和气温的作物生长过程线(意大利东部)
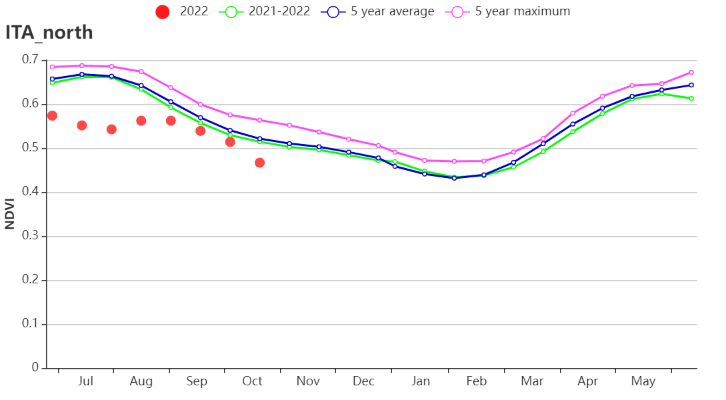

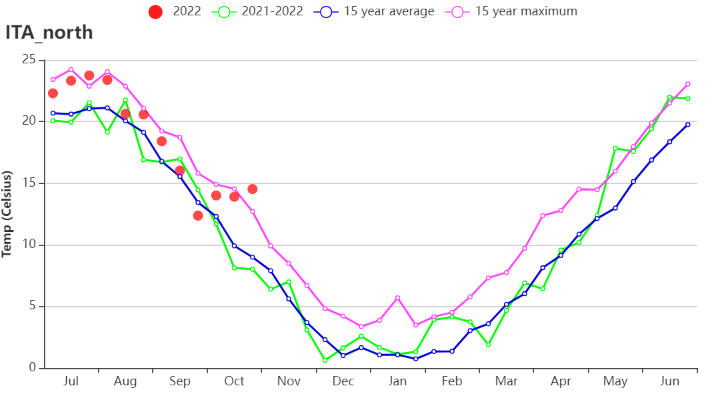
(f) 基于NDVI、降水量和气温的作物生长过程线(意大利北部)
(g) 基于NDVI、降水量和气温的作物生长过程线(意大利南部)
(h) 基于NDVI、降水量和气温的作物生长过程线(意大利西部)
表3.45意大利农业生态分区2022年7- 10月与过去15年(15YA)同期农业气象指标
区域 | 累计降水 | 平均气温 | 光合有效辐射 | 潜在生物量 | ||||
当前值(mm) | 距平(%) | 当前值(℃) | 距平(℃) | 当前值(MJ/m2) | 距平(%) | 当前值(gDM/m2) | 距平(%) | |
意大利东部 | 186 | -20 | 21 | 1 | 1177 | 1 | 714 | -3 |
意大利北部 | 517 | 8 | 19 | 2 | 1084 | 0 | 945 | 10 |
意大利南部 | 94 | -40 | 24 | 2 | 1269 | -1 | 599 | -11 |
意大利西部 | 234 | -15 | 21 | 2 | 1171 | 0 | 737 | -4 |
表3.46意大利农业生态分区2022年7- 10月与近5年(5YA)同期农情指标
区域 | 耕地种植比例 | 最佳植被状况指数 | 复种植被指数 | ||
当前值(%) | 距平(%) | 距平(%) | 当前值(%) | 距平(%) | |
意大利东部 | 58 | -6 | 0.73 | 104 | -3 |
意大利北部 | 97 | -3 | 0.70 | 101 | -3 |
意大利南部 | 64 | 3 | 0.68 | 90 | -12 |
意大利西部 | 91 | -4 | 0.69 | 125 | 4 |

