This monitoring period covers the harvest of winter wheat in July and August, closely followed by the harvest of spring wheat. Maize harvest started in September. The sowing of winter wheat started in October and will be completed in November. CropWatch agro-climatic indicators showed above-average temperatures over the period (TEMP +2.4°C). Temperatures surpassed the 15-year maximum during several periods except in late September. RAIN was significantly lower than the average (RAIN -19%), especially in July and early August, which continued the trend of below-average precipitation observed during of the previous monitoring period. Sunshine was higher than the average (RADPAR +9%). Due to unfavorable rainfall and the relatively warm temperature conditions, the biomass production potential (BIOMSS) is estimated to have decreased by 4% nationwide compared to the 15-year average. Cropping intensity was slightly below average by 1%. The national-scale NDVI development graph shows that the NDVI values were also significantly below the trend of the 5-year average, but reached close to average values in early October. The spatial distribution of maximum VCI (VCIx) across the country reached 0.80. CALF decreased by 1%. Overall, persistent drought and warmer-than-usual temperatures during the summer season caused unfavorable growth conditions for all of France's agricultural regions.
本期监测期涵盖了法国玉米及春小麦的生长末期和收获期,以及冬小麦的收获期。同时冬小麦在10月开始播种并将于11月完成。CropWatch农气监测结果表明,与过去15年平均水平相比,本监测期内法国全国平均气温偏高2.4°C,除9月外数次超过15年平均最高气温。降水量延续了上个监测期的低降水量,明显低于平均水平19%,特别在7月与8月上旬尤为显著。光合有效辐射较平均水平略高9%。由于不利的降水条件以及温暖的气温,本监测期内法国潜在累积生物量比过去15年平均水平偏低4%。复种指数较多年平均水平略偏低1%。基于NDVI作物生长过程线显示,法国全国NDVI值明显低于多年平均水平,仅于10月上旬接近过去15年平均水平。法国整体的最佳植被状况指数为0.80。耕地种植比例略偏低1%。总体看来,夏季持续的干旱以及温暖的气候不利于法国农业区的作物生长。
Regional analysis
Considering cropping systems, climatic zones and topographic conditions, additional sub-national details are provided for eight agro-ecological zones. They are identified on the maps by the following numbers: (78) Northern barley region, (82) Mixed maize/barley and rapeseed zone from the Center to the Atlantic Ocean, (79) Maize-barley and livestock zone along the English Channel, (80) Rapeseed zone of eastern France, (75) Massif Central dry zone, (81) Southwestern maize zone, (76) Eastern Alpes region and (77) the Mediterranean zone.
区域分析
基于种植系统、气候分区以及地形条件,可将法国细分为8个农业生态区,分别是(78)北部大麦区;(82)西部玉米、大麦和油菜混种区;(79)西北玉米和大麦混种区;(80)油菜种植区;(75)中部干旱区;(81)西南玉米区;(76)东部高原区,以及(77)地中海气候区。
In the Northern barley region, warmer (TEMP +2.2°C) and sunnier (RADPAR +14%) weather was observed while RAIN was far below average (RAIN -31%) over the monitoring period. The BIOMSS also decreased by 11% when compared to the 15-year average. The CALF was at the average level, and VCIx was relatively low at 0.73. Cropping intensity increased by 4%. Crop condition development based on NDVI for this region was below the 5-year average, only close to the average level in early October.
与过去15年平均水平相比,北部大麦区降水量偏低31%,气温与光合有效辐射分别偏高2.2°C和14%;该区域潜在累积生物量偏低11%。耕地种植比例接近平均水平, 而最佳植被状况指数相对较低为0.73。复种指数偏高4%。基于NDVI作物生长过程线显示,该区域作物长势低于平均水平,仅于10月上旬接近平均水平。
In the Mixed maize/barley and rapeseed zone from the Center to the Atlantic Ocean, warmer (TEMP +2.6°C), sunnier (RADPAR +10%) but drier (RAIN -18%) conditions were observed during the monitoring period. BIOMSS was at the average level, but the NDVI profile showed the regional crop conditions were lower than average levels except in early October, when it was above the average. Cropping intensity was higher than the average level by 4%. The CALF decreased by 1%, and VCIx was 0.80.
在西部玉米、大麦和油菜混种区,监测期内平均气温较多年平均偏高2.6°C,光合有效辐射偏高10%,同时降水量严重偏低18%。该地区潜在累积生物量处于平均水平,NDVI作物生长过程线显示,区域作物状况低于平均水平,仅于10月上旬高于多年平均。复种指数较平均水平偏高4%。耕地种植比例比平均值偏低1%,最佳植被状况指数为0.80。
In the Maize-barley and livestock zone along the English Channel, TEMP and RADPAR were above average by 2.3°C and 12%. RAIN was lower than the average (-15%). BIOMSS decreased by 4%. Cropping intensity increased by 8%. CALF was average and VCIx was 0.80. The regional NDVI profile also presented an overall lower-than-average trend, but was close to average levels in early October.
在西北玉米和大麦混种区,监测期内的气温和光合有效辐射均高于多年平均水平,气温偏高2.3°C,光合有效辐射偏高12%,而降水量偏低15%。该地区作物的潜在累积生物量较平均水平偏低4%。复种指数偏高8%。耕地种植比例处于平均水平,同时最佳植被状况指数为0.80。各个指标综合显示该地区作物生长状况低于多年平均水平,仅于10月上旬接近多年平均。
In the Rapeseed zone of eastern France, the NDVI profile showed great fluctuation during the monitoring period. It was below average in July and August and then above average in September and October. Overall, RAIN in this period was 27% lower than the 15-year average, while TEMP increased by 2.2°C and RADPAR by 13%. BIOMSS was about 9% lower than average, while CALF was at the average level, and VCIx was 0.87. Cropping intensity was lower than the average level by 1%.
在油菜种植区,基于NDVI作物生长过程线显示,监测期作物长势有较大的波动,作物长势于7月、8月低于多年平均水平,于9月、10 月逐渐接近并高于平均水平。监测期内降水量较过去15年平均值偏低27%,而气温偏高2.2°C,光合有效辐射偏高13%。潜在累积生物量较平均值偏低约9%,同时耕地种植比例处于平均水平,该地区最佳植被状况指数为0.87;复种指数略偏低1%。
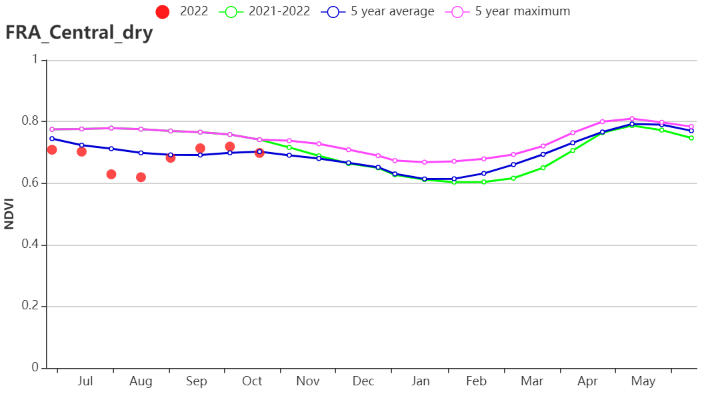
In the Massif Central dry zone, TEMP and RADPAR were 2.3°C and 10% higher than the average, respectively, while RAIN decreased by 19%. CALF was at the average level. Cropping intensity decreased by 3%. The VCIx was relatively high at 0.88 and BIOMSS decreased by 4%. Crop conditions of this region based on the NDVI profile were close to the average trend in July and dropped to below-average levels in August, but improved to average levels in September and October.
在中部干旱区,监测期内气温和光合有效辐射较多年平均水平分别偏高2.3°C和10%,而降水量则偏低19%。耕地种植比例处于平均水平,复种指数较平均水平偏低3%。监测期内该地区最佳植被指数为0.88,而潜在累积生物量偏低4%。同时NDVI作物生长过程线显示,作物生长状况于7月接近平均水平,但于8月降至平均水平以下,9月、10月高于平均水平。
The Southwestern maize zone is one of the major irrigated regions in France. The regional NDVI profile presented a below-average trend during the whole monitoring period. The VCIx was low (0.75). BIOMSS was 8% lower than average. CALF had decreased by 2%. Cropping intensity was below the average by 10%. RAIN in the period was below average (RAIN -24%), while TEMP was 2.4°C higher than average, and RADPAR increased by 6%.
西南玉米区是法国主要的灌溉地区之一。该区域的NDVI作物生长过程线显示,监测期内作物生长状况低于多年平均水平,同时最佳植被指数处于较低水平(0.75),而潜在累积生物量较平均水平偏低8%。耕地种植比例较平均水平偏低2%,复种指数偏低10%。在监测期内,该地区的降雨量较平均水平偏低24%,而温度偏高2.4°C,光合有效辐射偏高约6%。
In the Eastern Alpes region, the NDVI profile presented a below-average and then above- average trend. RAIN in the region was 10% lower than average, while TEMP was higher than average (+2.1°C) and RADPAR was 7% higher than the 15YA. BIOMSS was at the 15-year average. Cropping intensity was 5% lower than average. VCIx for the region was recorded at 0.83 and CALF was at the average level.
在东部高原区,作物长势同样也表现出波动的情况,监测期前期低于多年平均而后期高于多年平均水平。监测期内,该地区的降水量较多年平均偏低10%,而气温则偏高2.1°C, 光合有效辐射偏高7%。潜在累积生物量与过去15年平均水平持平,复种指数较平均水平偏低5%。该地区最佳植被指数为0.83,而耕地种植比例处于平均水平。
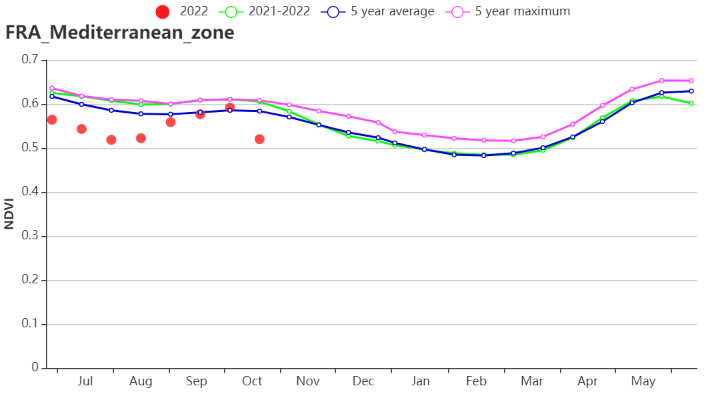
The Mediterranean zone also indicated an overall below-average NDVI profile, but it improved to average levels in late September and early October. The region recorded a relatively low VCIx (0.75). RADPAR (+ 2%) and TEMP (+3°C) were above average, while RAIN was lower than average (-11%). Cropping intensity decreased by 6%. BIOMSS increased by 5% and CALF slightly decreased by 1%.
地中海气候区的NDVI作物生长过程线表明,该区域作物长势总体低于多年平均水平,但在9月和10月初作物长势接近平均水平。该地区最佳植被状况指数相对较低,为0.75。降水量较多年平均水平偏低11%,同时光合有效辐射和气温分别偏高2%和3°C。复种指数与多年平均水平相比偏低6%,潜在累积生物量偏高5%,耕地种植比例偏低1%。
图3.5 2022年7月-10月法国作物长势

(a). 主要作物物候历
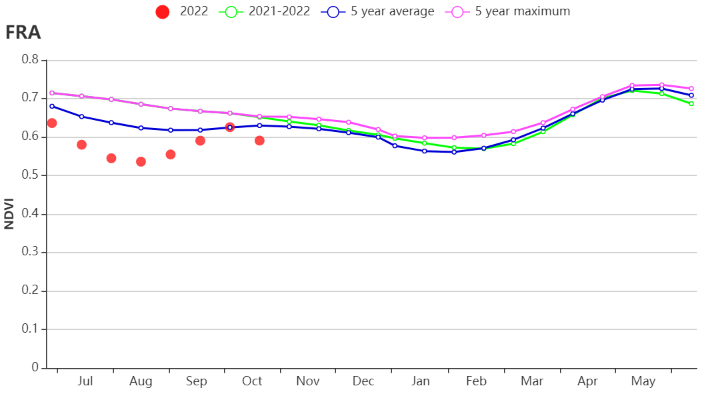
(b) 基于NDVI的作物生长过程线
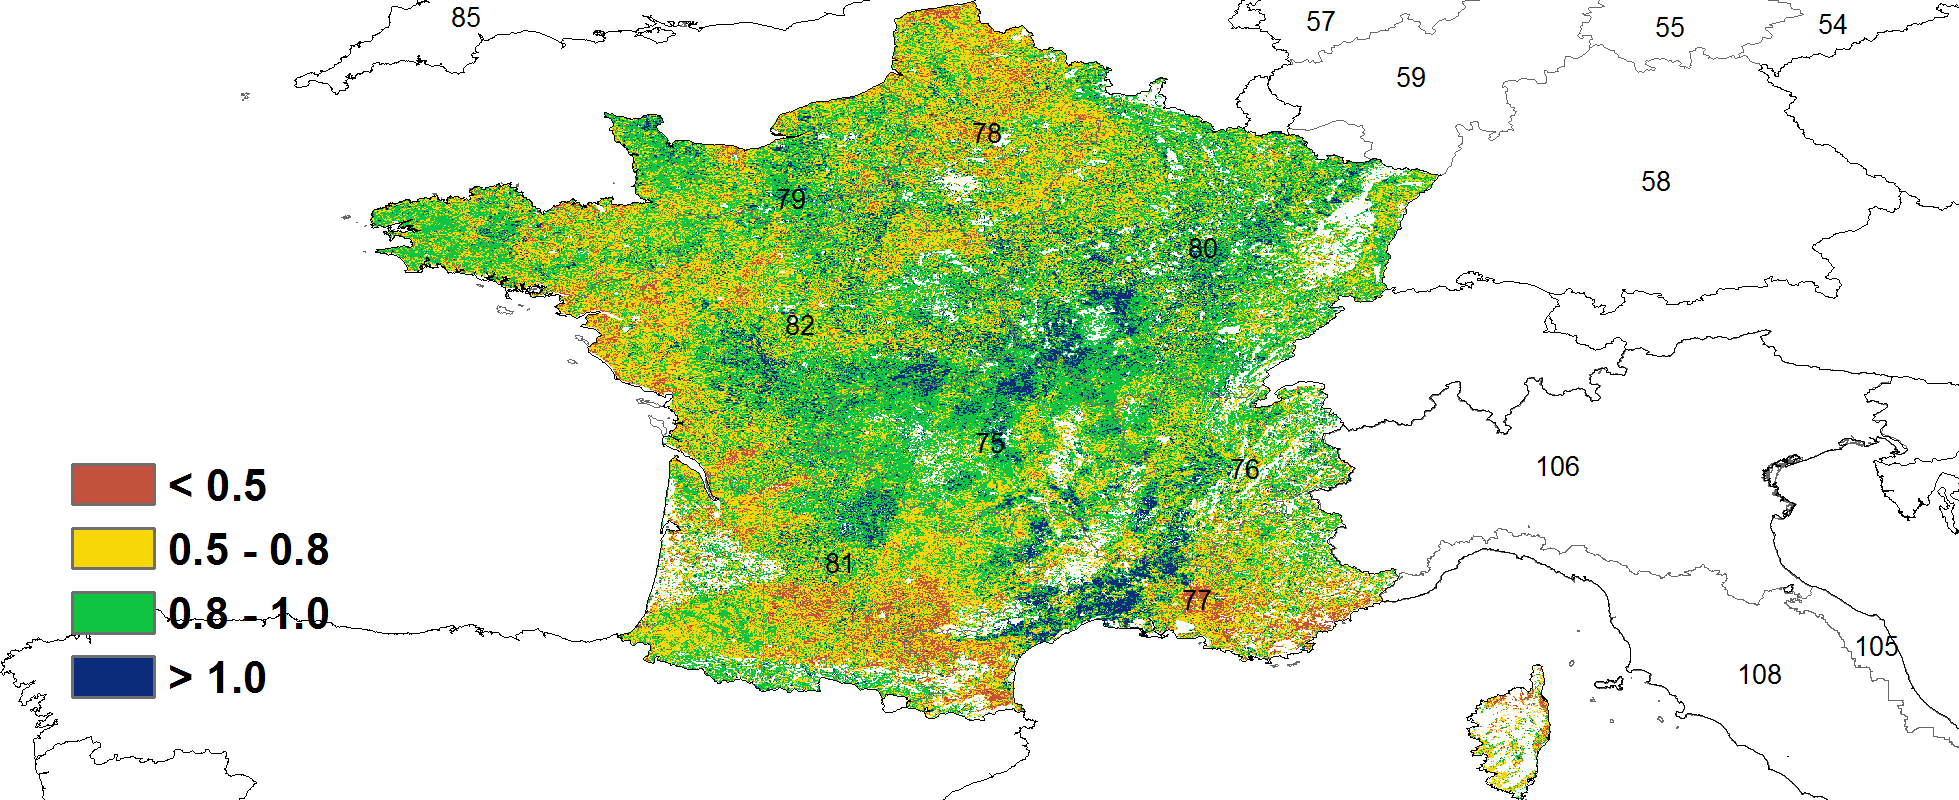
(c) 最佳植被状况指数
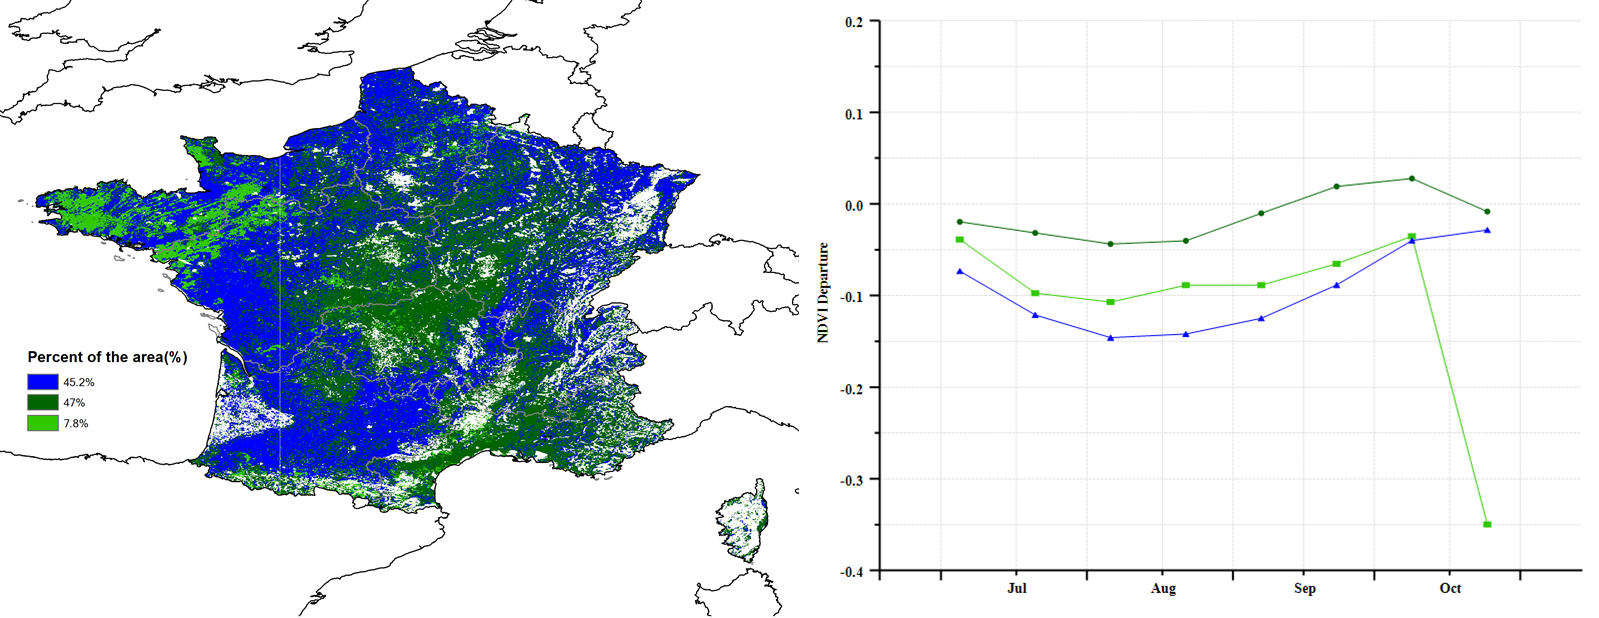
(d)NDVI距平空间聚类图(与5年平均相比) (e) NDVI距平聚类过程线
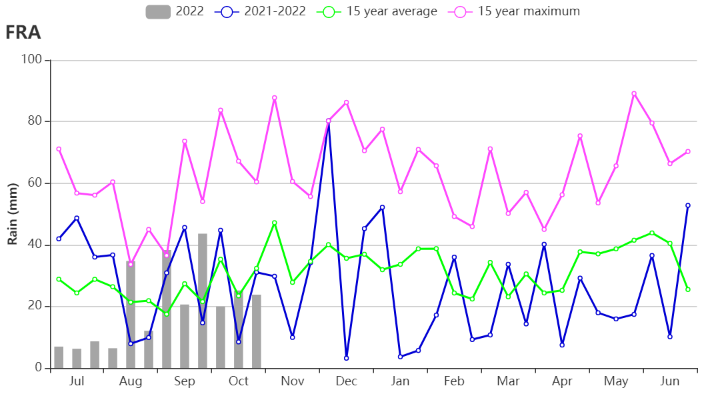
(f) 降水时间序列过程线
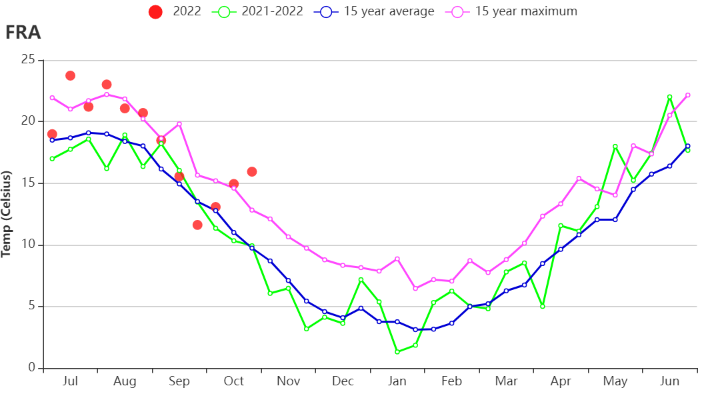
(g)温度时间序列过程线
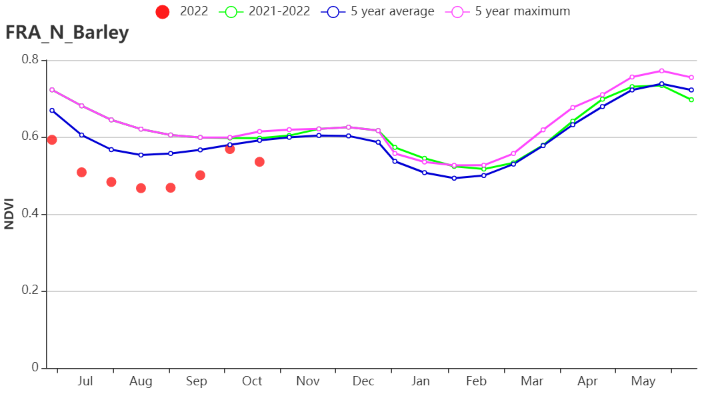

(h)基于 NDVI 的作物生长过程线(北部大麦区(左)和西部玉米区、大麦和油菜籽区(右))
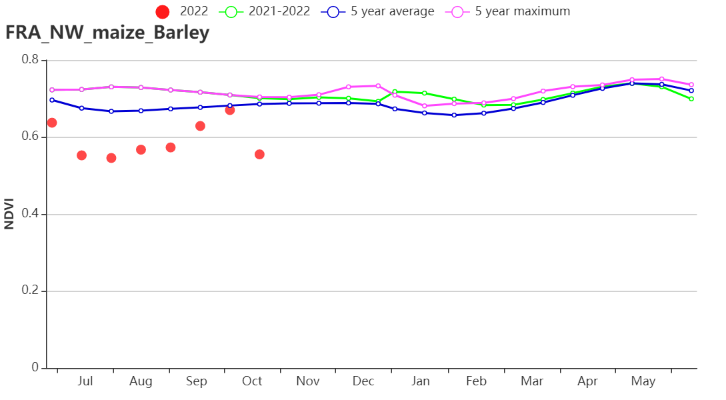
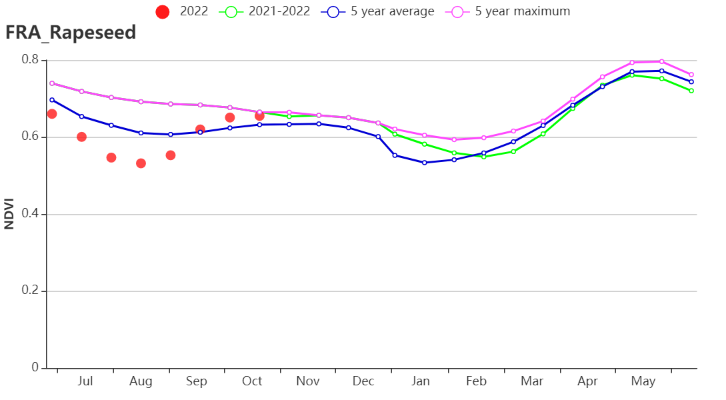
(i)基于 NDVI 的作物生长过程线(西北玉米和大麦区(左)和油菜种植区(右))
![]()
![]()
![]()
![]()

(j) 基于 NDVI 的作物生长过程线(中部干旱区(左)和西南玉米区(右))

(k) 基于 NDVI 的作物生长过程线(东部高原区(左)和地中海气候区(右))
表3.1法国农业生态分区2022年7月-10月与过去15年(15YA)同期农业气象指标
区域 | 累计降水 | 平均气温 | 光合有效辐射 | 潜在生物量 | ||||
当前值(mm) | 距平(%) | 当前值(℃) | 距平(℃) | 当前值(MJ/m2) | 距平(%) | 当前值(gDM/m2) | 距平(%) | |
北部大麦区 | 199 | -31 | 17.7 | 2.2 | 976 | 14 | 663 | -11 |
西部玉米、大麦和油菜混种区 | 206 | -18 | 19.2 | 2.6 | 1044 | 10 | 706 | 0 |
西北玉米和大麦混种区 | 229 | -15 | 17.7 | 2.3 | 971 | 12 | 685 | -4 |
油菜种植区 | 262 | -27 | 17.3 | 2.2 | 1059 | 13 | 731 | -9 |
中部干旱区 | 255 | -19 | 17.3 | 2.3 | 1127 | 10 | 763 | -4 |
西南玉米区 | 227 | -24 | 19.1 | 2.4 | 1133 | 6 | 724 | -8 |
东部高原区 | 391 | -10 | 16.5 | 2.1 | 1148 | 7 | 851 | 0 |
地中海气候区 | 258 | -11 | 19.6 | 3 | 1182 | 2 | 762 | 5 |
表3.2法国农业生态分区2022年7月-10月与近5年(5YA)同期农情指标
区域 | 耕地种植比例 | 复种指数 | 最佳植被状况指数 | ||
当前值(%) | 距平(%) | 当前值(%) | 距平(%) | 当前值 | |
北部大麦区 | 99 | 0 | 117 | 4 | 0.73 |
西部玉米、大麦和油菜混种区 | 98 | -1 | 109 | 4 | 0.80 |
西北玉米和大麦混种区 | 100 | 0 | 125 | 8 | 0.80 |
油菜种植区 | 100 | 0 | 105 | -1 | 0.87 |
中部干旱区 | 100 | 0 | 101 | -3 | 0.88 |
西南玉米区 | 98 | -2 | 95 | -10 | 0.75 |
东部高原区 | 98 | 0 | 100 | -5 | 0.83 |
地中海气候区 | 93 | -1 | 106 | -6 | 0.75 |
