Maize is the most important crop grown in Mexico. In the rainfed production regions of the country, maize reached maturity in September and October. The sowing of irrigated maize started in September. Its main production region is in Sinaloa, in the northwest. Winter wheat sowing begins in November. Both soybean and rice reached maturity by the end of this reporting period.
玉米是墨西哥最重要的作物。在该国的雨养生产区,玉米在9月和10月达到成熟期。9月份开始播种灌溉玉米。其主要生产区域位于西北部的锡那罗亚。冬小麦播种在十一月开始。大豆和水稻在本次通报监测期结束时已成熟。
The CropWatch agroclimatic indicators show that TEMP and RAIN were close to average and RADPAR was above average (+3%). Accordingly, BIOMSS increased by 1% as compared to the 15YA. CALF was close to average and reached 91% and cropping intensity decreased by 3%. Favorable weather conditions and relatively high CALF made the VCI reach 0.92.
农气指标显示,相比于15年平均水平,温度和降水量接近平均值,光合有效辐射高于平均值,偏高3%。因此,与15年平均水平相比,潜在生物量增加了1%。耕地种植比例接近平均水平,达到91%,复种指数偏低3%。良好的天气条件和相对较高的耕地种植比例使最佳植被状况指数达到0.92。
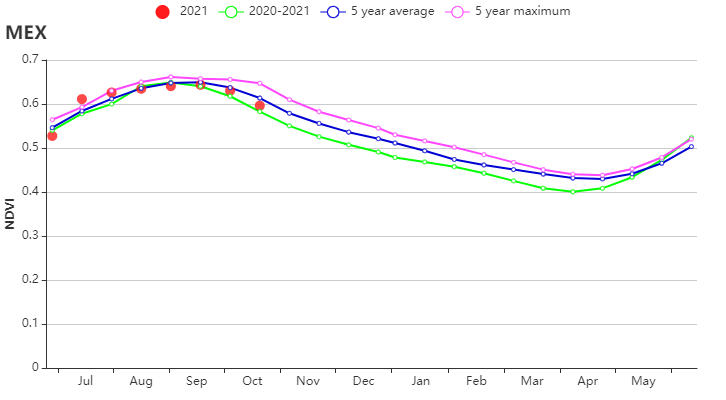
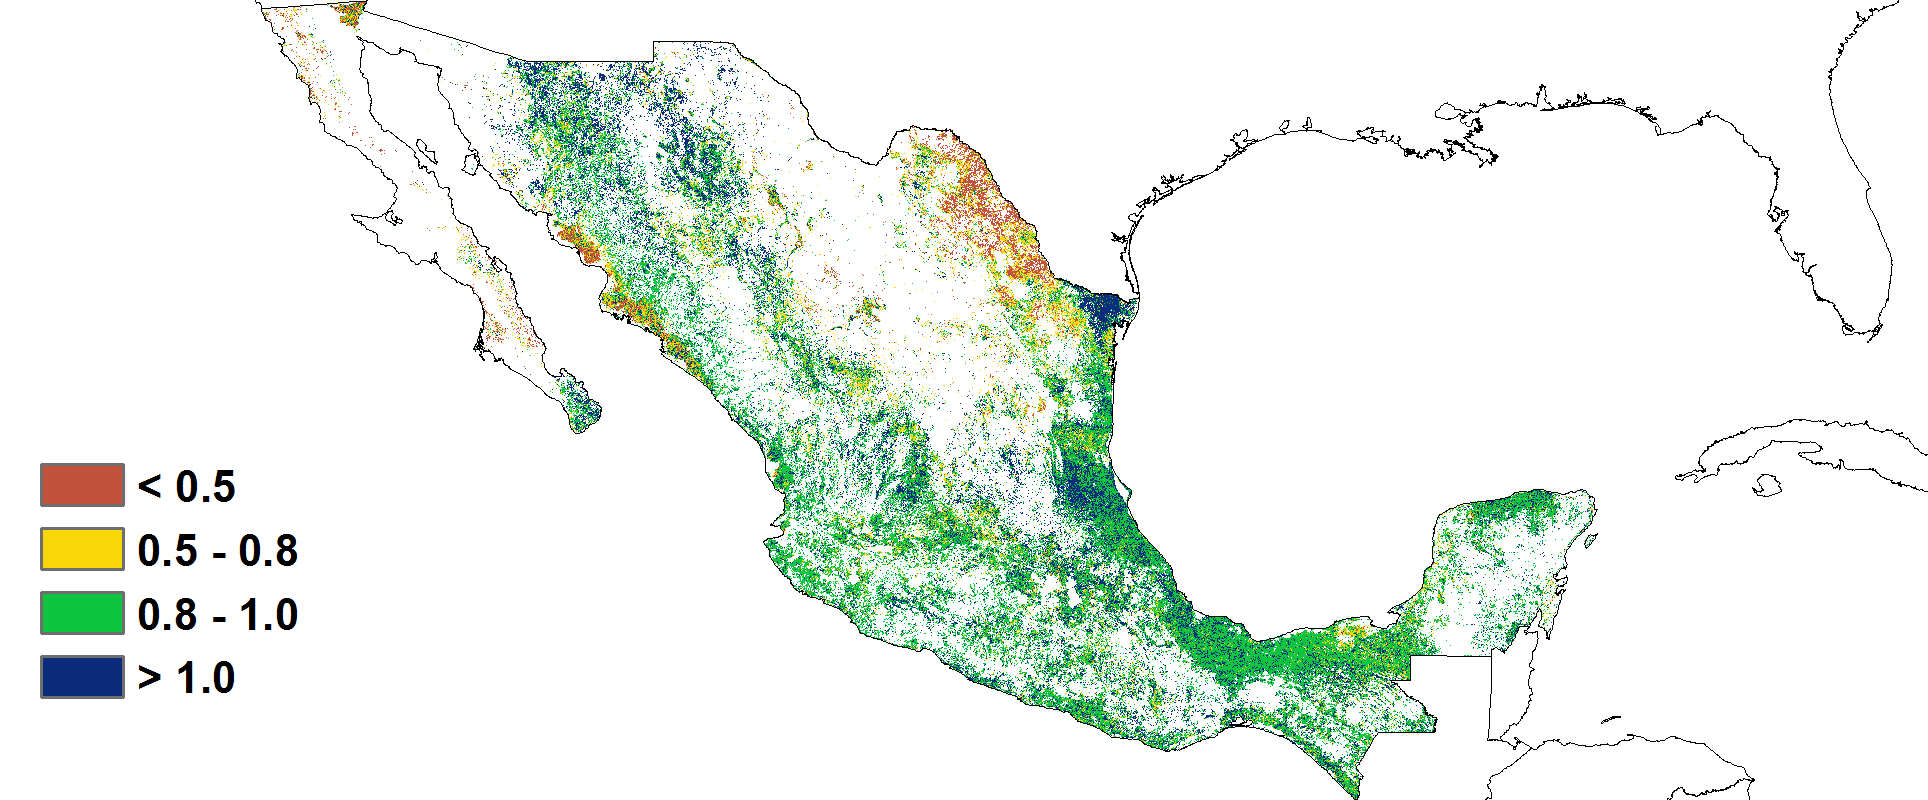
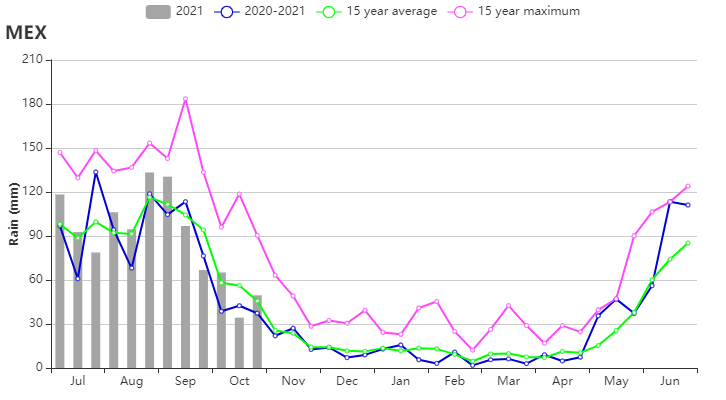
In terms of Agro-climatic conditions, the national precipitation and temperature was at the average level during the monitoring period of this bulletin. According to figure b, crop growth was also at an average level. According to VCI spatial patterns, very high values (greater than 1.0) occurred mainly in eastern coastal areas, including Tamaulipas. Extremely low values (less than 0.5) occurred in the northeast border area, mainly in the Nuevo León, Coahuila de Zaragoza and western coastal areas.
在本次通报监测期间,全国降水量和温度处于平均水平。图b显示作物长势也处于平均水平。极高值(大于1.0)主要发生在东部沿海地区,包括塔毛利帕斯。东北边境地区出现极低值(小于0.5),主要分布在新莱昂、科阿韦拉-德萨拉戈萨和西部沿海地区。
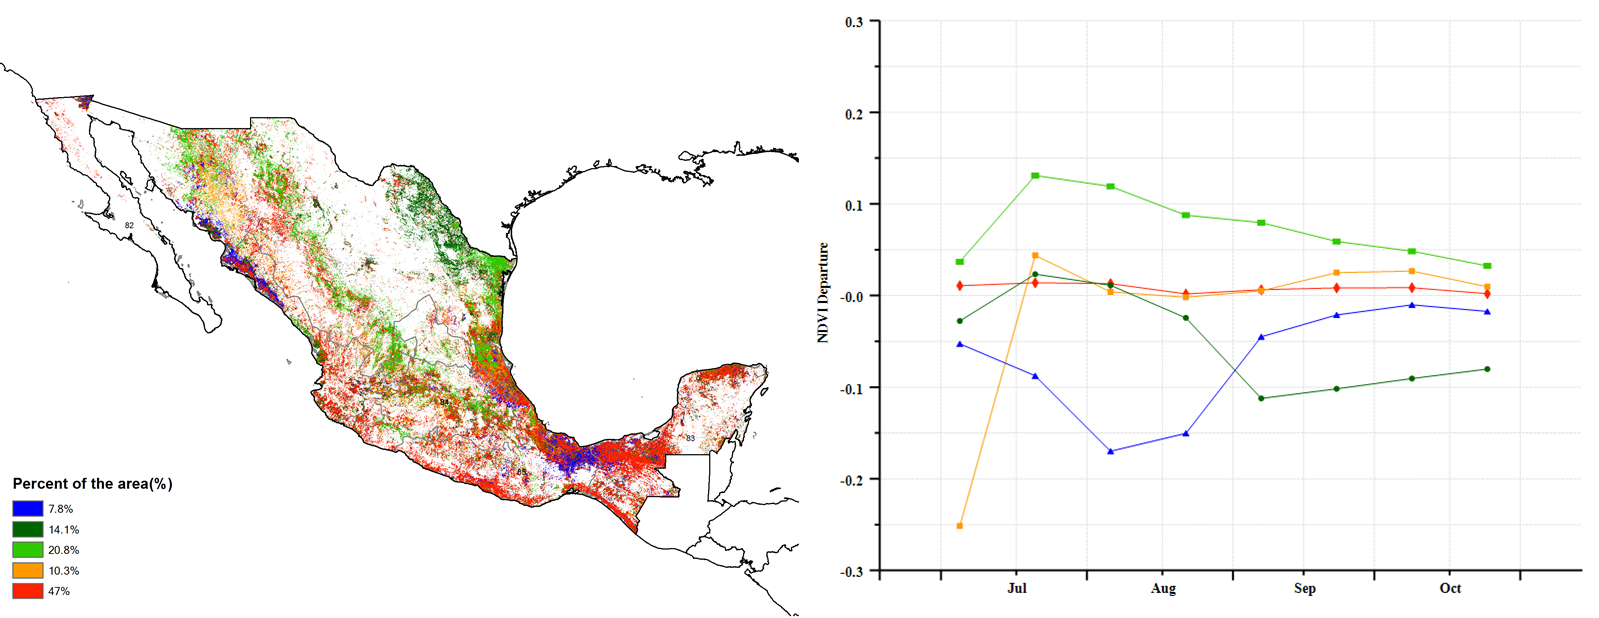
As shown in the spatial NDVI profiles and distribution map, 20.8% of the total cropped areas were above average during the entire monitoring period, mainly distributed in the northeast coastal and border areas. 50.7% of the total cropped areas were at an average level. Only 7.8% of the total cropped areas were below average, mainly in Sinaloa. In addition, 14.1% of the total cropped areas were at an average level in July and August and below average in September and October. This phenomenon may be caused by the harvest stage of maize and rice and other summer crops.
从NDVI距平空间聚类图可以看出,在整个监测期间,20.8%的区域的作物长势高于平均水平,主要分布在东北沿海和边境地区。此外50.7%的区域的作物长势处于平均水平。只有7.8%的区域的作物长势低于平均水平,主要分布在锡那罗亚。此外,总种植面积的14.1%在7月和8月处于平均水平,9月和10月低于平均水平。这种现象可能是由于玉米、水稻和其他夏季作物的收获造成的。
Overall, the crop conditions were at an average level. Although the crop land was affected by severe drought in winter, the agro-climatic conditions gradually returned to the normal level by April, so the impact of drought on crop growth was limited and a favorable production of the summer crops is estimated.
总体而言,作物长势处于平均水平。虽然耕地在冬季受到了严重干旱的影响,但到4月,农气条件逐渐恢复到正常水平,因此干旱对作物生长的影响有限,预计夏季作物将有良好的产量。
Regional analysis
Based on cropping systems, climatic zones and topographic conditions, Mexico is divided into four agro-ecological regions. They include the Arid and semi-arid region (128), Humid tropics with summer rainfall (129), Sub-humid temperate region with summer rains (130) and Sub-humid hot tropics with summer rains (131). Regional analyses of crop conditions provide more details for the production situation in Mexico.
根据种植制度、气候区及地形条件,将墨西哥划分为4个农业生态区,这些区域包括:干旱半干旱区(128)、夏雨湿润热带区(129)、夏雨次湿润温带区(130)和夏雨湿次润热带区(131)。分析这些农业生态区的作物长势状况可为墨西哥的粮食生产形势提供更细致的信息。
The Arid and semi-arid region, located in northern and central Mexico, accounts for about half of planted areas in the country. According to the NDVI development graph, crop condition in this region was close to average before September. CALF increased by 3% compared with the 5YA. The agro-climatic condition showed that RAIN increased by 3% and TEMP decreased by 0.1°C and RADPAR increased by 4%. The Arid and semi-arid region was the most drought affected region and the VCIx was 0.88.
干旱半干旱区位于墨西哥北部和中部,约占该国种植面积的一半。如基于NDVI的作物生长过程线所示,9月前该地区的作物长势接近平均水平。与5年平均水平相比,耕地种植比例偏高3%。农气条件表明,降水量偏高3%,温度偏低0.1℃,光合有效辐射偏高4%。干旱半干旱区是受干旱影响最严重的地区,最佳植被状况指数为0.88。
The region of Humid tropics with summer rainfall is located in southeastern Mexico. Conditions were favorable. RAIN was slightly below average (-2%), TEMP was 0.2℃ warmer and RADPAR increased by 5% and BIOMSS increased by 3%. As shown in the NDVI development graph, crop conditions were close to average from July to October. The VCIx (0.93) confirmed favorable crop conditions in this region.
夏雨湿润热带区位于墨西哥东南部,本次通报监测期间农气条件良好,降水量偏低2%,温度偏高0.2℃,光合有效辐射偏高5%,潜在生物量偏高3%。如基于NDVI的作物生长过程线所示,7月至10月的作物状况接近平均水平。最佳植被状况指数为0.93,证实了该地区良好的作物条件。
The Sub-humid temperate region with summer rains is situated in central Mexico. According to the NDVI development graph, crop conditions were close to average in July and below average in August, but then recovered to average levels. The agro-climatic conditions were close to the average level. RAIN increased by 4%, TEMP increased by 0.1°C , and RADPAR increased by 1% compared to the 15YA. BIOMSS was also near average and CALF was 99%. Favorable meteorological conditions and high CALF made VCIx reach 0.96.
夏雨次湿润温带区位于墨西哥中部地区,如基于NDVI的作物生长过程线所示,7月作物状况接近平均水平,8月低于平均水平,但随后恢复到平均水平。农业气候条件接近平均水平。与15年平均水平相比,降水量偏高4%,温度偏高0.1℃,光合有效辐射偏高1%。潜在生物量也接近平均水平,耕地种植比例为99%。良好的气象条件和较高的温度使最佳植被状况指数达到0.96。
The region called Sub-humid hot tropics with summer rains is located in southern Mexico. During the monitoring period, crop conditions were below average in August and closed to average in other months as shown by the NDVI time profiles. Agro-climatic conditions were closed to average levels, including RAIN (+1%), TEMP (+0.2℃) and RADPAR (+3%). The VCIx for the region was 0.95 and BIOMSS was near average.
夏雨湿次润热带区主要位于墨西哥南部,在监测期间,如基于NDVI的作物生长过程线所示,8月份的作物状况低于平均水平,其他月份接近平均水平。农气条件接近平均水平,包括降水量偏高1%、温度偏高0.2℃和光合有效辐射偏高3%。该区域的最佳植被状况指数为0.95,潜在生物量接近平均值。
图3.28 2021年7月-10月墨西哥作物长势

(a). 主要作物物候历
(b) 基于NDVI的作物生长过程线 (c) 最佳植被状况指数
(d)NDVI距平空间聚类图(与5年平均相比) (e) NDVI距平聚类过程线

(f)降水时间过程线 (g)温度时间过程线
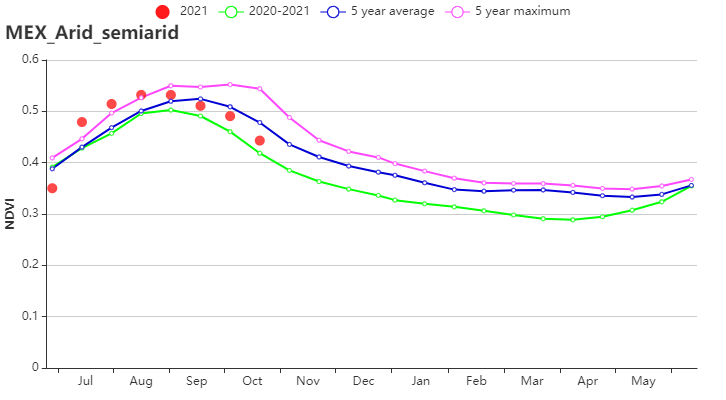
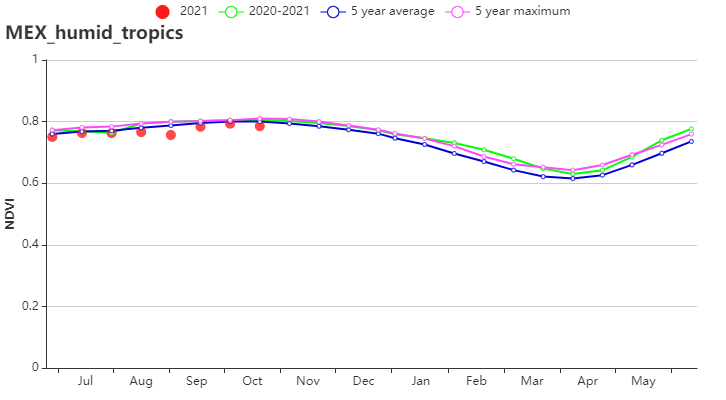
(h)基于NDVI的作物生长过程线 (干旱半干旱区(左)与夏雨湿润热带区(右))
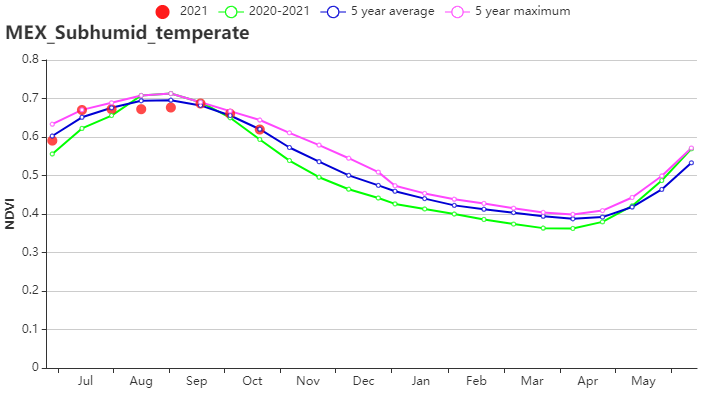
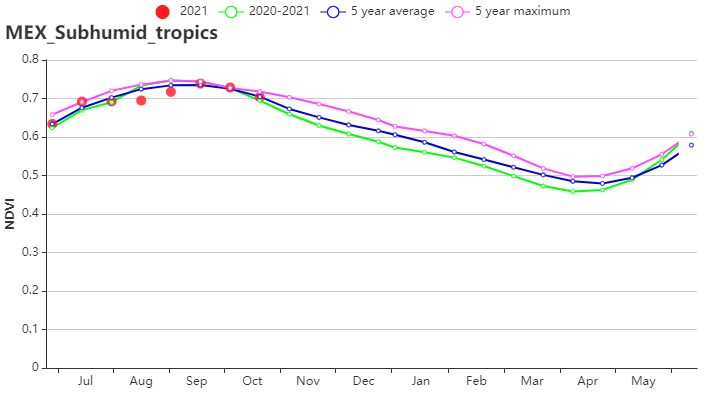
(i)基于 NDVI 的作物生长过程线(夏雨次湿润温带区(左)与夏雨次湿润热带区(右))
表3.1墨西哥农业生态分区2021年7月-10月与过去15年(15YA)同期农业气象指标
区域 | 累计降水 | 平均气温 | 光合有效辐射 | 潜在生物量 | ||||
当前值(mm) | 距平(%) | 当前值(℃) | 距平(℃) | 当前值(MJ/m2) | 距平(%) | 当前值(gDM/m2) | 距平(%) | |
干旱半干旱区 | 747 | 3 | 22.6 | -0.1 | 1339 | 4 | 1056 | 2 |
夏雨湿润热带区 | 1252 | -2 | 25.1 | 0.2 | 1324 | 5 | 1495 | 3 |
夏雨次湿润温带区 | 1258 | 4 | 18.8 | 0.1 | 1230 | 1 | 1165 | 0 |
夏雨次湿润热带区 | 1241 | 1 | 22.5 | 0.2 | 1265 | 3 | 1293 | 0 |
表3.2墨西哥农业生态分区2021年7月-10月与近5年(5YA)同期农情指标
区域 | 耕地种植比例 | 复种指数 | 最佳植被状况指数 | ||
当前值(%) | 距平(%) | 当前值(%) | 距平(%) | 当前值 | |
干旱半干旱区 | 82 | 3 | 98 | -7 | 0.88 |
夏雨湿润热带区 | 100 | 0 | 112 | 1 | 0.93 |
夏雨次湿润温带区 | 99 | 1 | 104 | -3 | 0.95 |
夏雨次湿润热带区 | 96 | 1 | 110 | -1 | 0.95 |
