This report mainly covers the second season (Yala) of Sri Lanka, including the growing and harvesting of rice and maize from July to September, as well as the main season (Maha) early sowing of the crops in October. According to the CropWatch monitoring results, crop conditions were assessed as slightly below average for the monitoring period.
本次监测期主要覆盖斯里兰卡的第二个作物季(Yala)。在此期间,水稻和玉米在7月至9月经历种植和收获,而主要季节(Maha)的作物则在10开始播种。CropWatch监测结果显示,在监测期内,作物长势略低于平均水平。
During this period, the country experienced the Southwest-Monsoon from July to September and the Second Inter-monsoon in October, during which the whole island experienced wide spread rain with strong winds. At the national level, precipitation was significantly above the 15YA (RAIN +33%), temperature was near average (TEMP -0.1°C) while radiation experienced a minor increase (RADPAR +4%). The remarkable increase of rainfall in early July ensured sufficient water supply for the crops and further contributed to the good crop condition. The fraction of cropped arable land (CALF) was comparable to the 5YA. BIOMSS was up by 12% compared to the 15YA. As shown in NDVI development graph, NDVI was generally close to, yet below average during the period. The maximum VCI for the whole country was 0.93.
在监测期内,该国在7月至9月主要受西南季风影响,而10月则盛行第二次间歇季风,受此影响,全岛经历了大范围的降水和强风。在全国范围内,累计降水明显高于过去15年平均水平(偏高33%),平均气温接近平均水平(偏低0.1°C),而光合有效辐射也略有增加(偏高4%)。7月初降雨量明显增加,确保了作物的充足供水,进一步促进了作物的良好生长。耕地种植比例与平均水平相当,而潜在生物量则偏高12%。NDVI作物生长过程线显示,监测期内的NDVI值总体上略低于平均水平,但两者较为接近。整个国家的最佳植被状况指数最大值为0.93。
As shown by the NDVI clusters map and profiles, nearly half of country's cropland showed above-average crop condition while the rest showed unfavorable situation with negative NDVI departures. These croplands were mainly distributed along the west coast of the country, including Provinces of North Western, Western, Southern and Sabaragamuwa, as well as scattered areas over Provinces of Northern Central and Eastern. The maximum VCI showed high values around the country excepted for some areas along the east coast.
NDVI距平聚类分布图及其过程线显示,该国近一半农田的作物长势高于平均水平,而其余农田区域的NDVI距平值为负值,表明作物长势不容乐观。这些农田主要分布在该国西海岸,包括西北省、西部省、南部省和萨伯勒格穆沃省,以及中北省和东部省的零星地区。除东海岸的一些地区外,全国各地的最佳植被状况的值都很高。
Regional analysis
Based on the cropping system, climatic zones and topographic conditions, three sub-national agroecological regions can be distinguished for Sri Lanka. They are the Dry zone, the Wet zone, and the Intermediate zone.
区域分析
根据种植系统、气候分区以及地理条件,可将斯里兰卡划分为三个农业生态区域,分别是干旱区、湿润区和中部地区。
In the Dry zone, the recorded RAIN (735 mm) was 23% above average. TEMP was 0.1°C below average and RADPAR was up by 4%, while BIOMSS increased by 16% as compared to the 15YA. CALF was near the 5YA level with 98% of cropland utilized. NDVI slightly fluctuated around the average. The VCIx for the zone was 0.91. Overall, crop conditions were near average for this zone.
在干旱区,监测期内的累计降水(735毫米)比平均水平偏高23%,平均气温比平均水平偏低0.1℃,光合有效辐射偏高4%,潜在生物量与较平均水平偏高16%。耕地种植比例为98%,与近5年平均水平接近。监测期内,NDVI值在平均水平附近略微波动。该分区的最佳植被状况指数最大值为0.91。总体而言,该分区的作物长势接近平均水平。
For the Wet zone, RAIN (2958 mm) was 39% above average as compared to the 15YA. TEMP was average and RADPAR increased by 3%. BIOMSS was 3% above the 15YA and cropland was fully utilized. NDVI values showed significant deviation from average for the whole period. The VCIx value for the zone was 0.98. Crop conditions were below average for this zone.
在湿润区,累计降水(2958毫米)比过去15年平均水平偏高39%。平均气温处于平均水平,光合有效辐射偏高3%。潜在生物量较平均水平偏高3%,所有耕地均有所种植。监测期内,NDVI值与平均水平存在显著的偏离。该分区的最佳植被状况指数最大值为0.98。结果表明,该分区的作物长势低于平均水平。
The Intermediate zone also experienced sufficient rain (1563 mm) with a 39% increase from the 15YA. TEMP dropped by 0.2°C and RADPAR was 11% above average compared to the 15YA. With full use of cropland, BIOMSS was 2% above average. The NDVI values were similar to the whole country and the VCIx value for this zone was 0.96. Conditions of crops were close to average.
中部区域的累计降水也较为充足(1563毫米),较过去15年平均水平偏高39%,平均气温偏低0.2℃,光合有效辐射偏高11%。在耕地得到充分利用的基础上,潜在生物量较平均水平偏高2%。NDVI的分布与全国的状况较为相似,最佳植被状况指数最大值为0.96。该分区的作物长势接近于平均水平。
图 3.26 2021年7月-10月斯里兰卡作物长势

(a) 主要作物物候历
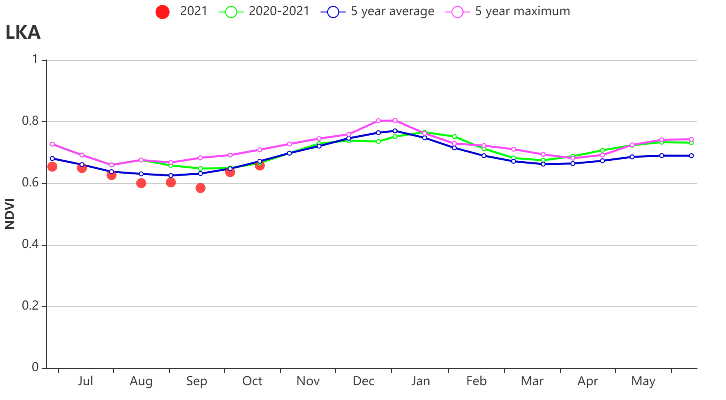
(b)基于NDVI的作物生长过程线
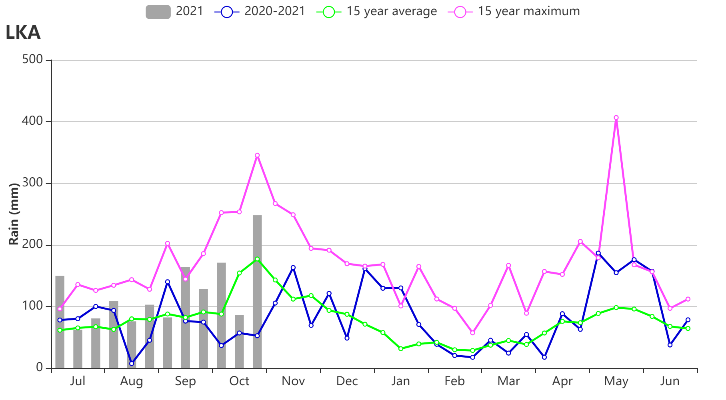
(c) 降水时间过程线

(d) 温度时间过程线
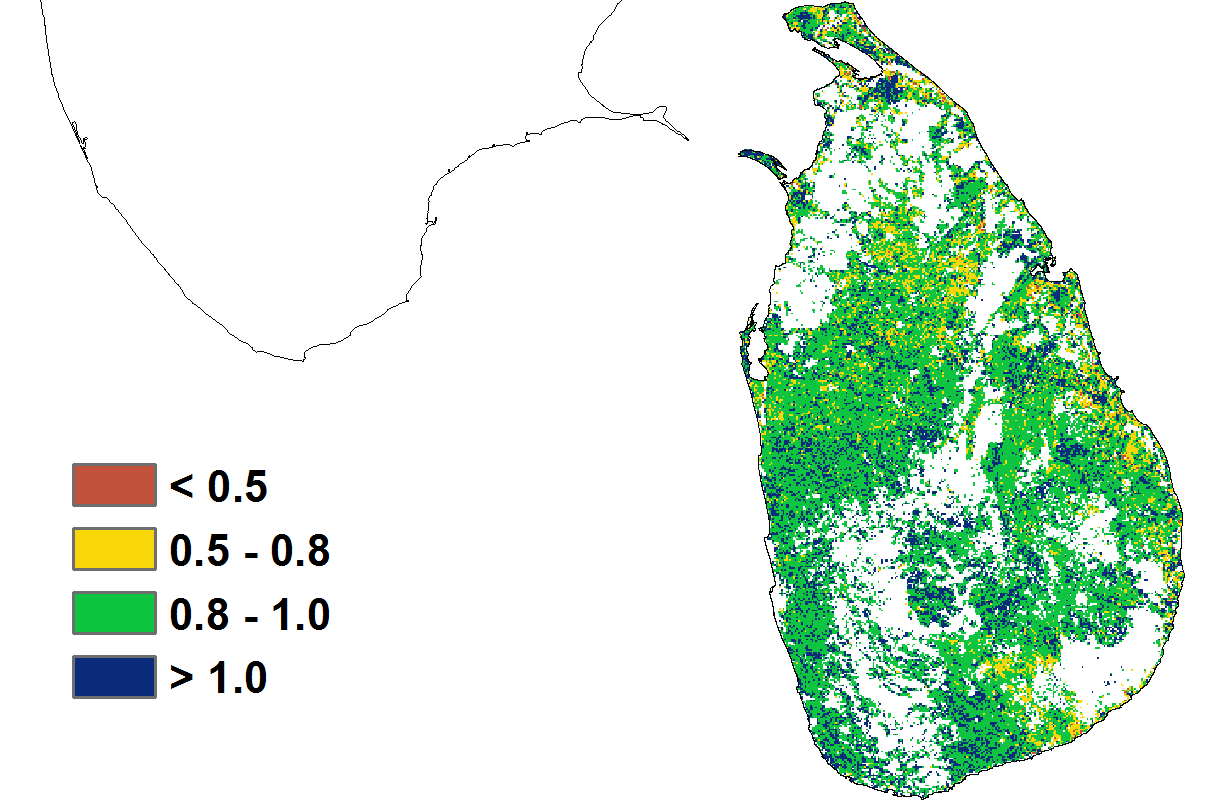
(e) 最佳植被状况指数
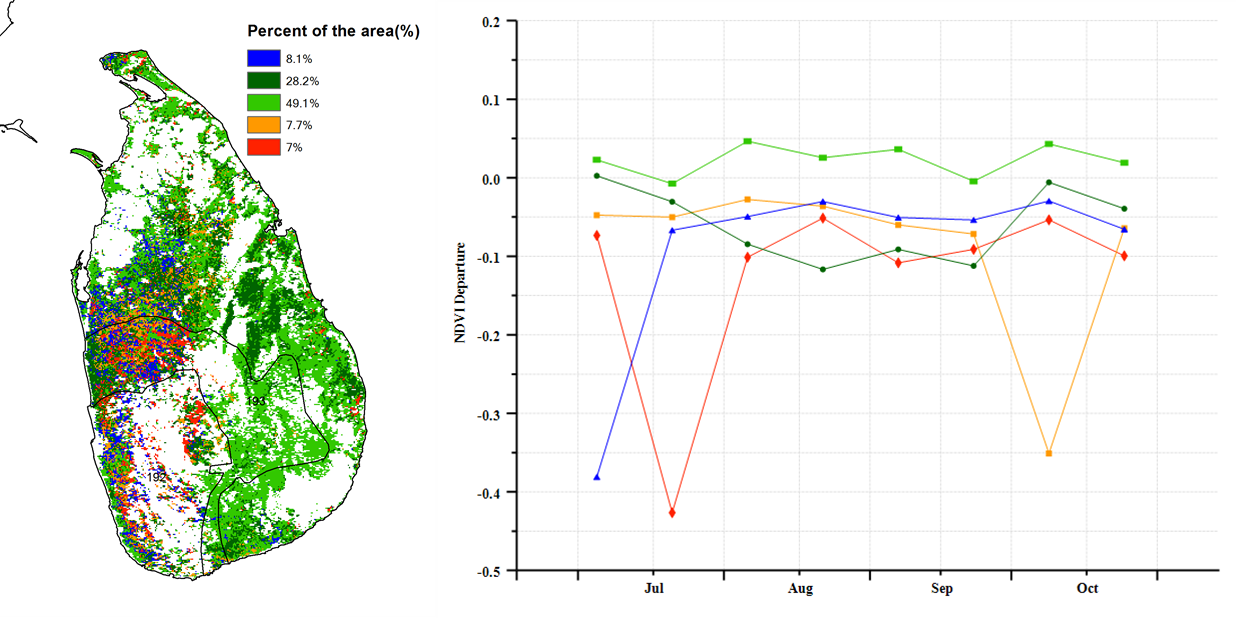
(f) NDVI距平空间聚类图(与5年平均相比) (g) NDVI距平聚类过程线
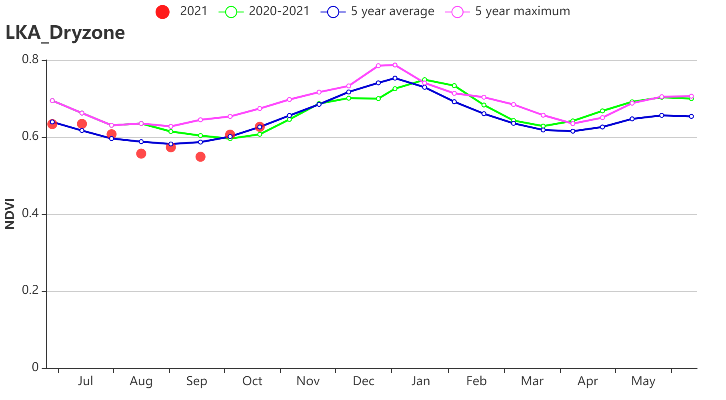
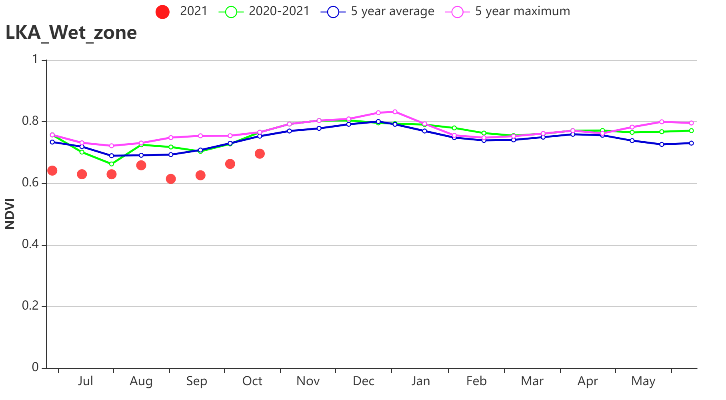
(h) 基于NDVI的作物生长过程线(干旱区(左)与湿润区(右))
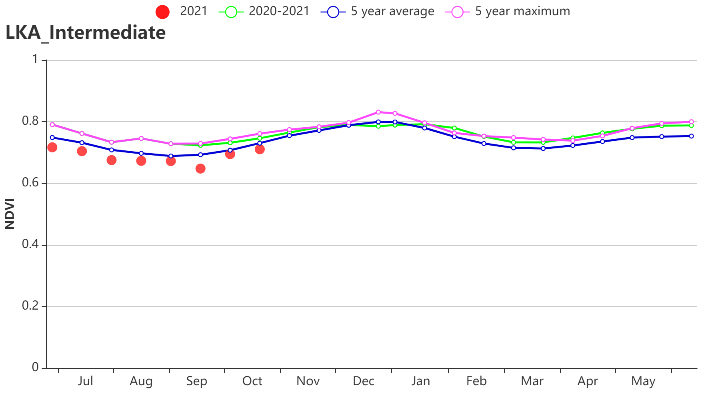
(i) 基于NDVI的作物生长过程线(中部区域)
表3.45 斯里兰卡农业生态分区2021年7月-2021年10月与过去15年(15YA)同期农业气象指标
区域 | 累计降水 | 平均气温 | 光合有效辐射 | 潜在生物量 | ||||
当前值(mm) | 距平(%) | 当前值(℃) | 距平(℃) | 当前值(MJ/m2) | 距平(%) | 当前值(gDM/m2) | 距平(%) | |
干旱区 | 735 | 23 | 27.1 | -0.1 | 1303 | 4 | 1268 | 16 |
湿润区 | 2958 | 39 | 24.1 | 0.0 | 1195 | 3 | 1602 | 3 |
中部区域 | 1563 | 39 | 24.5 | -0.2 | 1177 | 2 | 1373 | 11 |
表3.46 斯里兰卡农业生态分区2021年7月-2021年10月与近5年(5YA)同期农情指标
区域 | 耕地种植比例 | 复种指数 | 最佳植被状况指数 | ||
当前值(%) | 距平(%) | 当前值(%) | 距平(%) | 当前值 | |
干旱区 | 98 | 1 | 147 | 3 | 0.91 |
湿润区 | 100 | 0 | 106 | -8 | 0.98 |
中部区域 | 100 | 0 | 140 | -2 | 0.96 |
