Kenya experiences two rainy seasons: The long rains last from March to May and the short rains from October to December. Maize can be grown during the long and short rains, whereas wheat is grown during the long rains only. This report for the monitoring period from October 2021 to January 2022 covers the short rain season and the harvest of wheat and long rain maize. Short rain maize was sown in October and November.
肯尼亚经历两个雨季:长雨季从3月持续至5月,短雨季从10月至12月。玉米在长雨季和短雨季都可以种植,而小麦只在长雨季种植。在本报告监测期间,长雨季玉米和小麦已收获,短雨季玉米在前两个月播种,并在后两个月进入生长高峰期。
At the national scale, precipitation was 277 mm, 34% below average. The weather was slightly hot and PADPAR was close to the 15YA (TEMP +0.4°C, RADPAR +2%). BIOMSS is 14% lower than average due to insufficient rainfall. According to the national rainfall profiles, the 10-day accumulations of rainfall presented conditions that were close to the 15YA in the December and January but significant below average in the October and November.
在全国范围内,降水量为277mm,比平均水平低34%。天气略偏热,光合有效辐射接近15年平均值(温度+0.4℃,光合有效辐射+2%)。由于降雨量不足,潜在生物量比平均水平低14%。全国降雨过程线显示,12月至1月的旬降雨量总体接近平均水平,但在10月和11月明显低于平均水平。
The NDVI development graph at the national level shows that the NDVI values from October to December were below average. It can be noticed that the sowing of maize in the short rainy season was delayed and in some areas there may be no harvest. This is mainly due to the significant decrease in rainfall. Based on the NDVI clusters and the corresponding NDVI departure profiles, the western part of Kenya (blue area), which accounts for 43.6% of the country's cultivated land, has near-average NDVI values, while other areas show significant deviations in the October to December crop growth. This is consistent with the maximum VCI map, which shows a relatively low VCI of between 0.5 and 0.8 in the central and southeastern regions.
基于NDVI的作物生长过程线显示,10-12月全国平均NDVI一直低于近5年平均水平,表明显著偏低的降水对作物生长产生了实质性影响,持续的少雨天气导致短雨季玉米播种推迟,部分地区甚至绝产。NDVI距平聚类分析结果显示,占全国耕地43.6%的肯尼亚西部地区(蓝色区域)的NDVI值接近平均水平,而其他地区在10月至12月的作物长势明显偏差,这与最佳植被状况指数图反映的低值区相一致,该图显示中部和东南部地区的VCIx 值相对较低(0.5-0.8)。总的来说,除肯尼亚西北部外,该国家作物均受到干旱影响,长势较差。
区域分析
The Eastern coastal region had the largest negative deviation in rainfall (-27%), 0.5°C above average temperature and 4% above average RADPAR. Lack of rainfall resulted in a 12% decrease in BIOMSS and a significant decrease in NDVI from October to December compared to the 5YA. This indicates that the conditions for sowing of short rainy season maize was impacted. Drought conditions also led to a decrease in crops planted area. CALF decreased by 11% as compared to the 5YA. The maximum VCIx was only 0.67, the lowest among the four AEZs in Kenya. Overall, the situation in the coastal areas is very unfavorable with poor prospects for livestock and crop production.
东部沿海地区的降雨量偏低幅度最大(-27%),气温比平均水平高0.5℃,光合有效辐射比平均水平高4%。降雨短缺导致生物量较平均水平下降12%,相应的10-12月的NDVI较平均水平相比显著下降,表明短雨季玉米的播种条件受到了显著影响,作物生长起始期明显滞后;干旱状况也导致作物种植面积的减少,与5年平均值相比,监测期内耕地种植比例偏低约11%;VCIx值只有0.67,是肯尼亚4个农业生态区中的最低值。总体上,不利的气象条件导致沿海地区的畜牧业和农作物生产前景不佳。
The Highland agriculture zone recorded 297 mm of rain, which was below the 15YA (-29%). Temperature was close to the 15YA (+0.4°C), whereas RADPAR was slightly above average (+2%). BIOMSS was below average (-12%). The NDVI was slightly below the 5YA from October to December. As with the eastern coastal region, the sowing of maize in the short rainy season was also affected by the lack of rainfall. The maximum VCIx value (0.89) is the highest in four AEZs in Kenya. The CALF was unchanged compared with the 5YA. Overall, crop growth has been severely affected by drought conditions from October to January.
高原农业区降水量为297mm,比过去15年平均水平偏低29%。温度基本正常(+0.4℃),而光合有效辐射略高于平均水平(+2%),降水偏低导致生物量低于平均水平(-12%)。10-12月,NDVI持续低于近5年平均状况。与东部沿海地区一样,短雨季的玉米播种也受到降雨短缺的影响,但影响程度弱于东部沿海区。VCIx为0.89,是肯尼亚四个农业生态区中最高值;耕地种植比例与近5年平均状况持平。总体而言,作物受到前期干旱影响,生产前景不佳。
In the Northern region, precipitation was below average at 265 mm (-30%). The temperature was close to the 15YA (+0.5°C), while RADPAR was above average (+3%). BIOMSS was below average (-11%). The maximum VCIx was normal at 0.72. The below-average trend of its crop condition development graph indicates that the area was affected by drought between October and December. The sowing of maize in the short rainy season was delayed. In addition, CALF decreased (-8%) to 75%. In general, the region has seen a decrease in rainfall, biomass, and CALF. This indicates that the region is severely affected by drought from October to January.
在北部植被稀疏区,降水同样低于平均水平(-30%),温度和光合有效辐射略偏高,但由于降水短缺,生物量仍低于平均水平(-11%),全区VCIx平均值为0.72。基于NDVI的作物生长过程线反映出严重滞后的作物生长起始期,主要是前期旱情影响。此外,耕地种植比例下降至75%,偏低8%。总的来说,该地区作物受旱严重,长势较差。
The Southwest region includes the areas of Narok, Kajiado, Kisumu, Nakuru and Embu. Precipitation was 145 mm, which is 68% below the average. The following values of indicators were observed: TEMP 20.6°C (+0.4°C), RADPAR (-4%) and BIOMSS (-34%). The significant decrease in precipitation led to a significant decrease in biomass. However, NDVI values were close to the 5YA. Despite the large variation in precipitation, its CALF and RADPAR were close to average and the VCIx value remained at 0.85. NDVI profile also presented close to average crop condition. The possible reason is the irrigation in the region narrowed the impact of drought on crops. All in all, the parameters indicate slightly below average conditions for this area.
肯尼亚西南部包括纳罗克、卡加多、基苏木、纳库鲁和恩布地区。降水量为145毫米,比平均水平低68%。观察到的指标值如下:气温20.6℃(+0.4℃),光合有效辐射略偏低(-4%),综合作用使得潜在生物量低于平均水平(-34%)。降水的大幅减少导致生物量的大幅下降。即便如此,NDVI值、耕地种植比例、光合有效辐射接近于平均水平,VCIx值保持在0.85;全区NDVI过程线同样显示出接近平均水平的作物长势,主要原因是该地区的灌溉在一定程度上削弱了干旱对作物生长状况的影响。总而言之,作物生长状况略低于平均水平,预计长雨季小麦和玉米的产量接近平均水平。
图3.24 2021年10月- 2022年1月肯尼亚作物长势

(a) 主要作物物候历
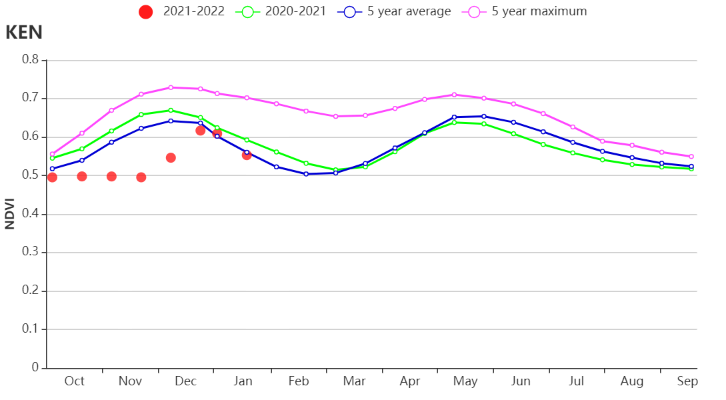

(b) 基于 NDVI 的作物生长过程线 (c) 最佳植被状况指数
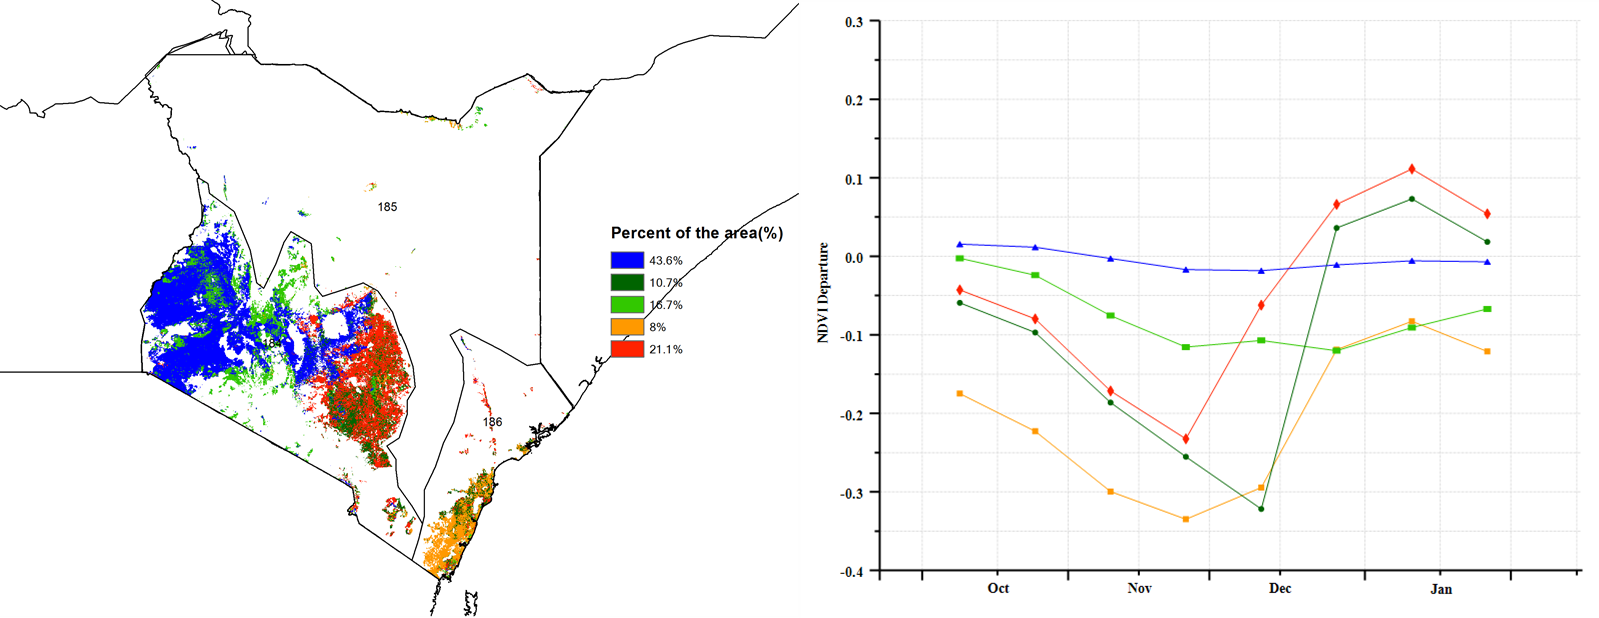
(d) NDVI 距平空间聚类图 (e) NDVI 距平聚类过程线
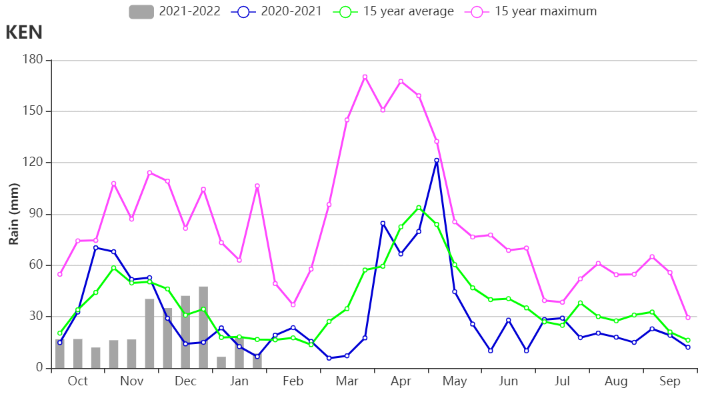
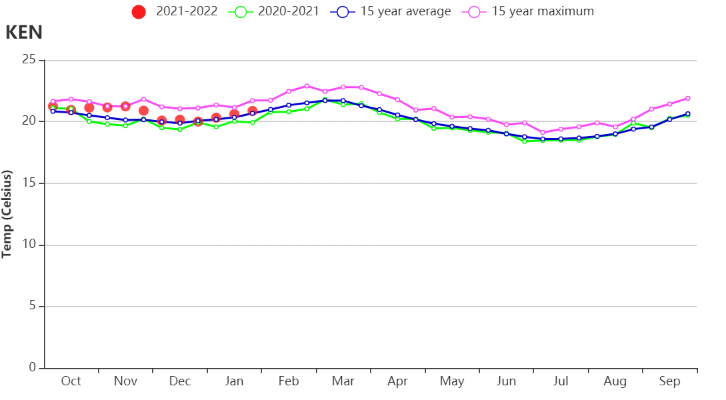
(f) 降水时间过程线 (g) 温度时间过程线
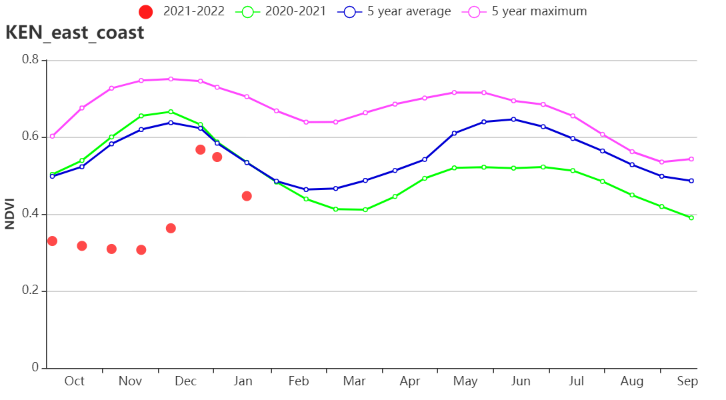
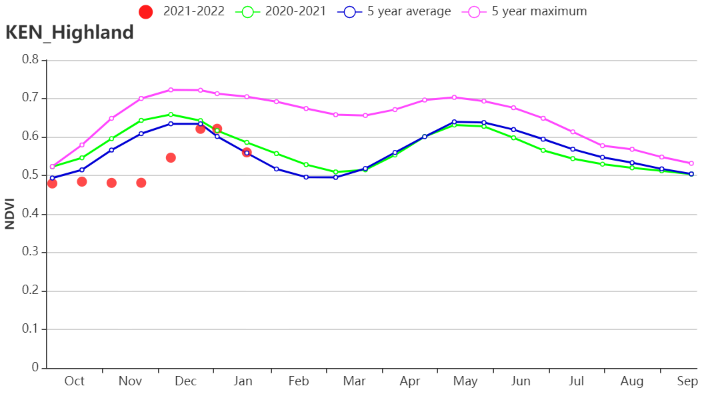
(h) 基于 NDVI 的作物生长过程线(东部沿海区(左),高原农业区(右))
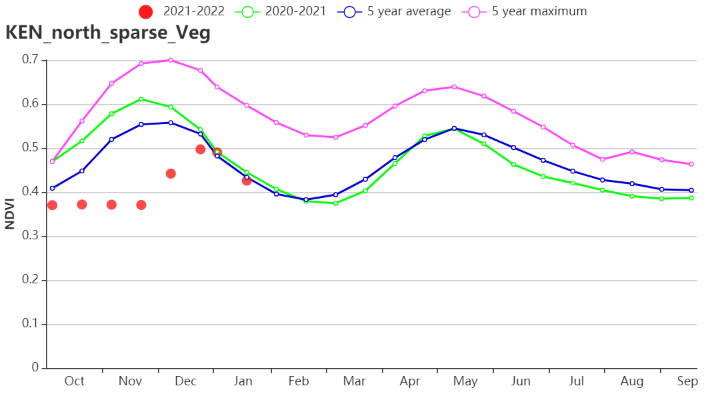
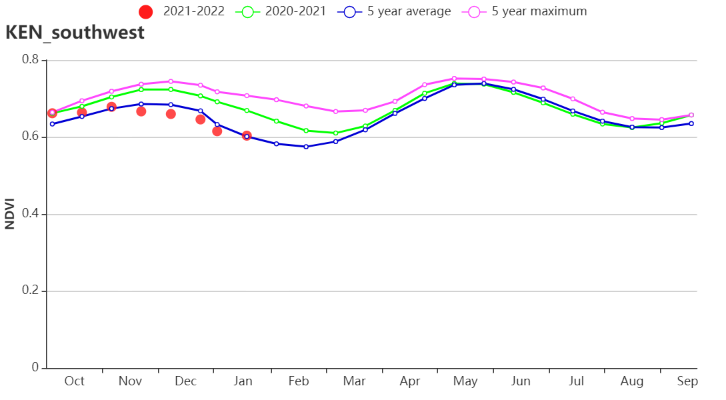
(i) 基于 NDVI 的作物生长过程线(北部牧场区(左),肯尼亚西南部(右))
表3.40 肯尼亚农业生态分区2021年10月- 2022年1月与过去15年(15YA)同期农业气象指标
区域 | 累计降水 | 平均气温 | 光合有效辐射 | 潜在生物量 | ||||
当前值 (mm) | 距平(%) | 当前值 (℃) | 距平(℃) | 当前值 (MJ/m2) | 距平(%) | 当前值 (gDM/m2) | 距平(%) | |
沿海区 | 384 | -27 | 26.3 | 0.5 | 1465 | 4 | 1121 | -12 |
高原农业区 | 297 | -29 | 19.3 | 0.4 | 1282 | 2 | 730 | -12 |
北部植被稀疏区 | 265 | -30 | 23.6 | 0.5 | 1378 | 3 | 825 | -11 |
肯尼亚西南部 | 145 | -68 | 20.6 | 0.4 | 1226 | -4 | 621 | -34 |
表3.41 肯尼亚农业生态分区2021年10月- 2022年1月与近5年(5YA)同期农情指标
区域 | 耕地种植比例 | 最佳植被状况指数 | |
当前值(%) | 距平(%) | 当前值 | |
沿海区 | 83 | -11 | 0.67 |
高原农业区 | 96 | 0 | 0.89 |
北部植被稀疏区 | 75 | -8 | 0.72 |
肯尼亚西南部 | 100 | 1 | 0.85 |
