The monitoring period includes the whole period of summer-rice in the Central from April to July. Summer-Autumn rice in the Mekong Delta or the south and the winter-spring rice in the North harvested in May. While the winter rice in the Central and rainy season rice in the north started to be planted in July.
本监测期涵盖了越南中部地区夏季水稻从播种到收获的整个过程。湄公河三角洲和南部地区的夏秋季水稻及北部地区的冬春水稻在5月份收割。而中部地区的冬季水稻和北部地区的雨季水稻则在7月份开始种植。
CropWatch agro-climatic indicators show average precipitation (1137 mm, +1%) and TEMP(25.1°C, +0.2°C), but with higher RADPAR (+7%), the BIOMSS (+8%) showed a marked increase compared to the 15YA. The VCIx (0.94) and CALF (96%) were both high.
在本次监测期间,农气指数显示,降水量(1137 mm, +1%),平均气温(25.1°C, +0.2°C)接近于往年平均水平,但受到较高的光合有效辐射(+7%)影响,潜在生物量(+8%)较15年平均水平显著偏高。最佳植被状况指数(0.94)及耕地种植比例(96%)均偏高于往年平均水平。
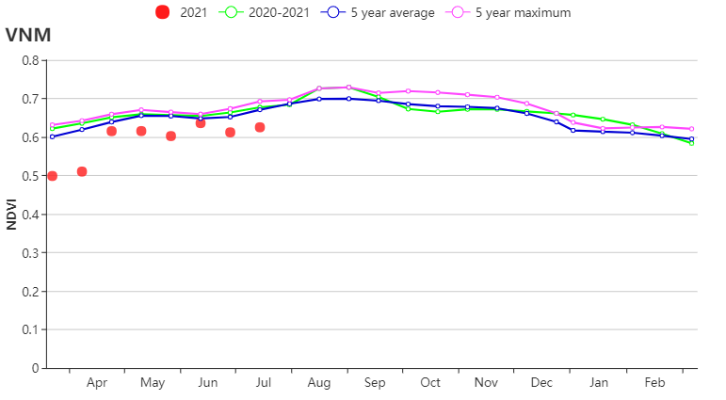
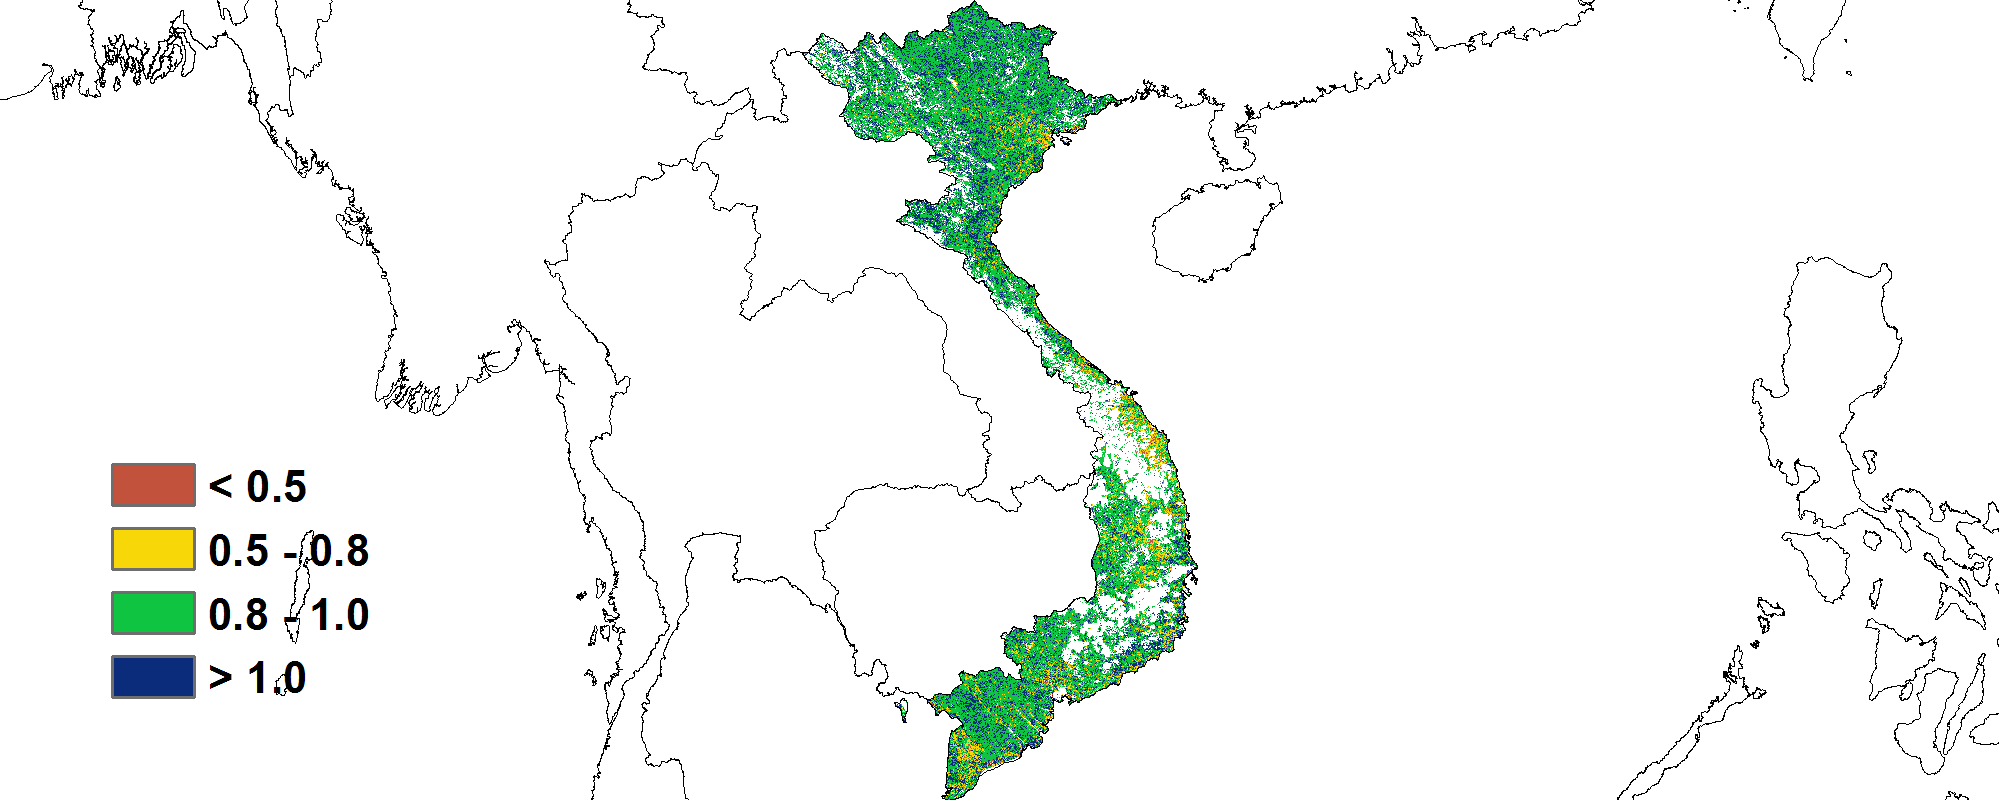
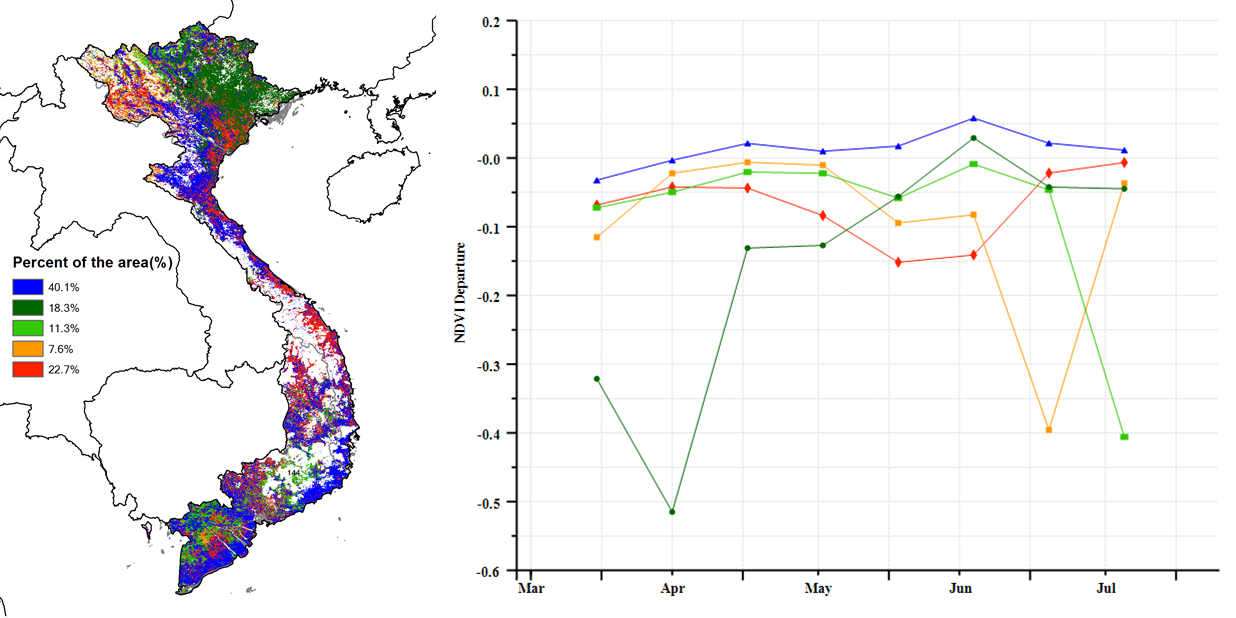
Based on the NDVI development graph, the crop conditions were below the 5YA and the average of the same period in last year, especially at the beginning of this monitoring period. The precipitation during this monitoring period showed an average level compared with the 15YA, while the temperature fluctuated around the 15YA. According to distribution of the VCIx, crop conditions in the North were significantly well, while the South Central Coast showed a obvious area with low values. As to the spatial distribution of NDVI profiles, crop conditions in about 40.1% were above average mainly in the central of Nghe An Province, Ninh Thuan Province and the South Central Coast region. And about 18.3% were below the average at the beginning of this monitoring period, which mainly distributed in the Northeast of the country. Overall, crop conditions were favorable.
基于NDVI的作物生长曲线显示,监测初期作物生长状况低于近5年平均水平及去年同期。本监测期内降水量接近过去15年平均水平,平均气温在平均水平附近波动。从最佳植被状况指数的分布来看,北部地区的作物状况较好,而中南部沿海地区交差。根据NDVI的空间分布,约40.1%的作物状况高于往年平均水平,主要分布在义安省中部、宁顺省及中南部沿海地区。约18.3%的作物状况在监测初期低于平均水平,主要分布在东北部地区。总体而言,本监测期间,越南作物长势良好。
Regional analysis
区域分析
Based on cropping systems, climatic zones, and topographic conditions, several agro-ecological zones (AEZ) can be distinguished for Vietnam: Central Highlands, Mekong River Delta, North Central Coast, North East, North West, Red River Delta, South Central Coast, South East.
根据种植制度、气候带和地形条件,越南可以划分为几个农业生态区(AEZ):中部高原区、湄公河三角洲、中北部沿海地区、东北部、西北部、红河三角洲、中南部沿海地区、东南部。
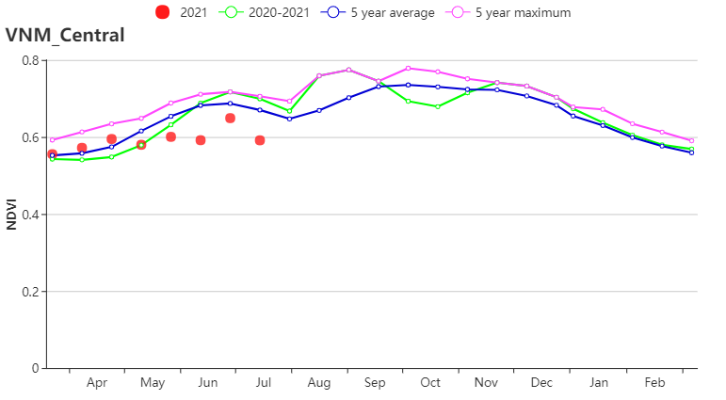
In the Central Highlands, RAIN was below average (1080 mm, -9%) and TEMP was about average (23.8°C). While RADPAR (1234 MJ/m2, +8%) increased significantly, BIOMSS was also increased by 9%. CALF was 99% and VCIx was 0.91. The crop condition development graph based on NDVI indicated that favorable conditions have fallen below 5YA and last year's situation. Crop production was expected to be average at the most.
在越南中部高原区,降水量偏低9%,平均气温接近往年平均水平(23.8°C)。光合有效辐射显著偏高8%,潜在生物量也偏高9%。耕地种植比例为99%,最佳植被状况指数为0.91。基于NDVI的作物过程线图显示,作物长势初始高于平均水平,然后开始下降至近5年平均水平甚至去年同期水平以下。预计农作物产量最多只能达到往年平均水平。
In the Mekong River Delta, RAIN(1059 mm, 0%) and TEMP (27.9°C, -0.1°C) were close to the 15YA. The favorable radiation (RADPAR +6%) caused the increase of BIOMSS by 7%. CALF was increased (86%, +3%) and VCIx was 0.93. According to the NDVI-based development graph, crop conditions were about the 5YA, except for early April and late July. Crop production was expected to be favorable.
在湄公河三角洲,降水量 (1059 mm, 0%)及平均气温(27.9°C, -0.1°C)接近过去15年平均水平。光合有效辐射偏高6%,使得潜在生物量偏高7%。耕地种植比例偏高(86%, +3%),并且最佳植被状况指数为0.93。根据NDVI的过程线,除4月初及7月底外,作物状况均接近于为5年平均水平。作物产量预期良好。
In the North Central Coast, with average TEMP (25.1°C, +0.3°C) , significantly increased RAIN (1080 mm, +19%) and RADPAR (1300 MJ/m2, +9%) , BIOMSS increased substantially (+11%). VCIx was 0.95 and CALF was 98%. According to the NDVI‐based development graph, crop conditions were low in April but close to average from May to June, and finally surpassed the 5-year-maximum in July. Crop production in this area was expected to be above the average.
在越南中北部沿海地区,由于平均气温(25.1°C, +0.3°C)接近于往年平均水平,显著偏高的降水量(1080 mm, +19%)以及光合有效辐射(1300 MJ/m2, +9%),潜在生物量显著偏高(+11%)。最佳植被状况指数为0.95,耕地种植比例为98%。根据NDVI的过程线,作物状况在4月份偏低,但在5月至6月接近于往年平均水平,最终在7月超过了5年来的最高值。预计该地区的作物产量将偏高于往年平均水平。
In the North East, TEMP (24.3°C, +0.5°C) and RAIN(1421 mm, 0%) were about average of the 15YA. RADPAR (1211 MJ/m2, +5%) was above the 15YA, which resulted in the increased BIOMASS (799, +7%). CALF was 100% and VCIx was 0.97. Overall, the crop outputs was expected to be favorable.
在越南东北部,平均气温(24.3°C, +0.5°C)和降水量(1421 mm, 0%)接近于过去15年平均水平。光合有效辐射(1211 MJ/m2, +5%)偏高,导致潜在生物量偏高7%。耕地种植比例为100%,最佳植被状况指数为0.97。总体而言,作物产量预计良好。
In the North West, with significantly increased RAIN (1322 mm, 18%) and RADPAR (1255 MJ/m2, +6%) , average TEMP (23.1°C, 0.2°C), BIOMASS increased by 8%. CALF was 100% and VCIx was 0.96. According to the NDVI‐based development graph, crop conditions increased and exceeded 5-year-maximum before May and then decreased below 5YA. Crop conditions in this region were close to or above the average.
在越南西北部,由于降水量(1322 mm, 18%)和光合有效辐射(1255 MJ/m2, +6%)显著偏高,平均气温(23.1°C, 0.2°C)接近于往年平均水平,潜在生物量偏高8%。耕地种植比例为100%,最佳植被状况指数为0.96。根据NDVI的发展曲线,5月前作物生长状况偏高,并超过了近5年同期最大值,之后下降至低于近5年平均水平。西北部地区的作物状况接近或高于往年平均水平。
The situations of agro-climatic indicators in the Red River Delta were the same as that in the North West. Increased RAIN (1186 mm, 12%) and RADPAR (1262 MJ/m2, +6%) , average TEMP (27.2°C, 0.4°C) resulted in the increased BIOMASS (864 gDM/m2, 8%). CALF was 96% and VCIx was 0.92. According to the crop condition development graph, the NDVI was below the 5YA during the whole monitoring period. Crop outputs were estimated to be below average.
红河三角洲农气指数与越南西北部基本一致。降水量(1186 mm, 12%)及光合有效辐射(1262 MJ/m2, +6%)偏高,平均气温(27.2°C, 0.4°C)接近于往年平均水平,导致潜在生物量偏高(864 gDM/m2, 8%)。耕地种植比例为96%,最佳植被状况指数为0.92。从作物生长过程线图可以看出,整个监测期间NDVI均偏低于近5年同期平均水平。作物产量预计低于往年平均水平。
In the South Central Coast, although RAIN greatly decreased (606 mm, -36%), average TEMP (24.6°C, +0.3°C) and increased RADPAR (1318 MJ/m2, +10%) resulted in the increased BIOMASS (807 gDM/m2,+6%). CALF was 96% and VCIx was 0.86. According to the crop condition development graph, the NDVI was below the 5YA during the whole monitoring period. Crop conditions were unfavorable.
在越南中南部沿海地区,虽然降水量显著偏低(606 mm, -36%),但平均气温(24.6°C, +0.3°C)和光合有效辐射偏高(1318 MJ/m2, +10%),导致潜在生物量偏高(807 gDM/m2,+6%)。耕地种植比例为96%,最佳植被状况指数为0.86。从作物生长过程线图可以看出,整个监测期间NDVI均偏低于近5年平均水平。作物生长不容乐观。
The situations of agro-climatic indicators in the South East were the same as that in the South Central Coast. Average TEMP (26.5°C, 0%), slightly decreased RAIN (1113 mm, -5%), increased RADPAR (1301 MJ/m2, +7%) resulted in the increased BIOMASS (870 gDM/m2, +7%). CALF was 95% and VCIx was 0.92. According to the crop condition development graph, the NDVI was closed to 5YA in April but decreased below the 5YA after May. Crop conditions in this region were unfavorable.
越南东南部农气指数的情况与越南中南部沿海地区相同。平均气温(26.5°C, 0%)与往年平均水平持平,降水量(1113 mm, -5%)略微偏低,光合有效辐射偏高(1301 MJ/m2, +7%),导致潜在生物量(870 gDM/m2, +7%)偏高。耕地种植比例为95%,最佳植被状况指数为0.92。从作物生长过程线图可以看出,4月NDVI接近于5年平均水平, 但在5月以后下降至低于5年平均水平。东南部地区的作物不容乐观。
图3.44 2021年4月 - 7月越南作物长势

(a). 主要作物物候历
(b) 基于NDVI的作物生长过程线
(c) 最佳植被状况指数
(d) NDVI距平空间聚类图(与5年平均相比) (e) NDVI 距平聚类过程线
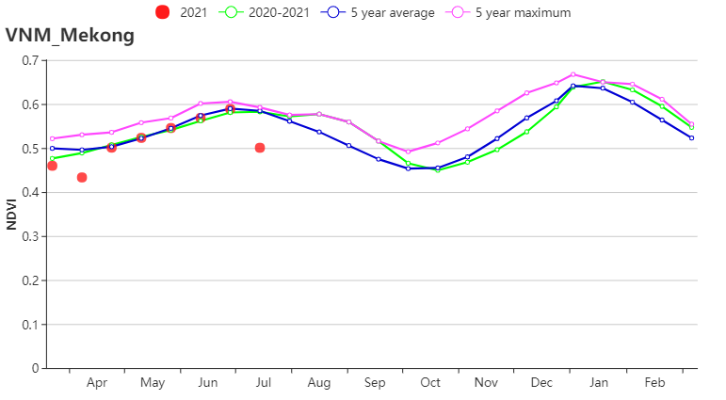
(f) 基于NDVI的作物生长过程线(越南中部高原区(左)和湄公河三角洲(右))
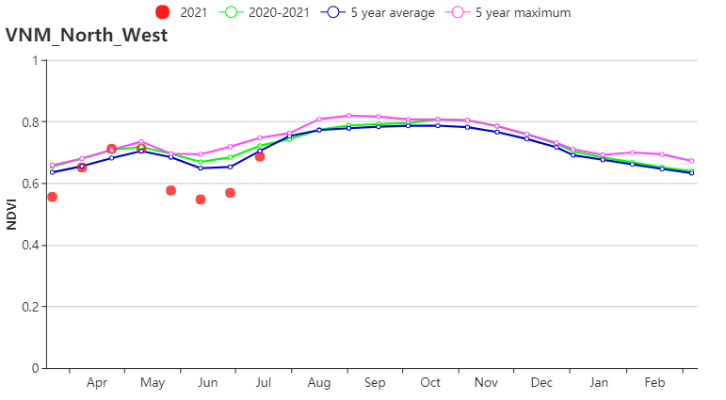
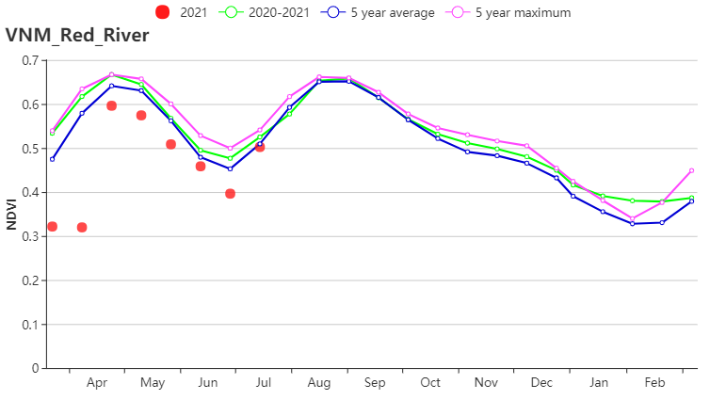
(g) 基于NDVI的作物生长过程线(越南西北部(左)和红河三角洲(右))
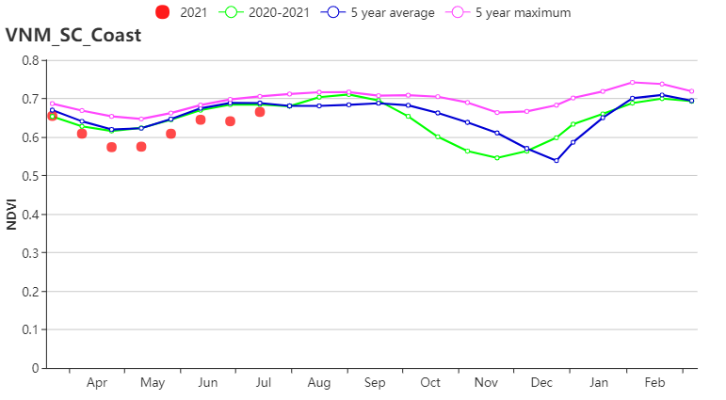
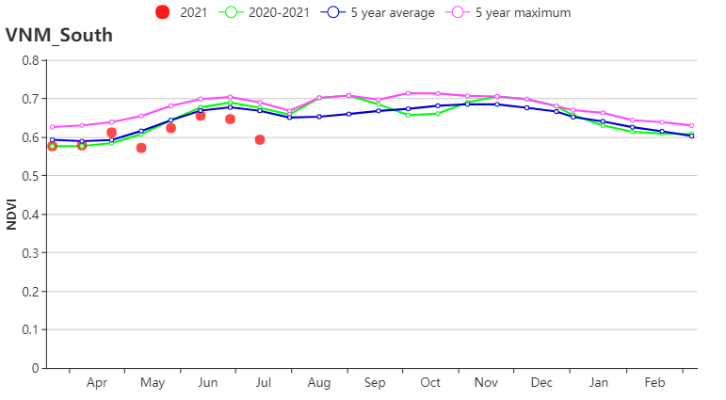
(h) 基于NDVI的作物生长过程线(越南中南部沿海地区(左)和越南东南部(右))
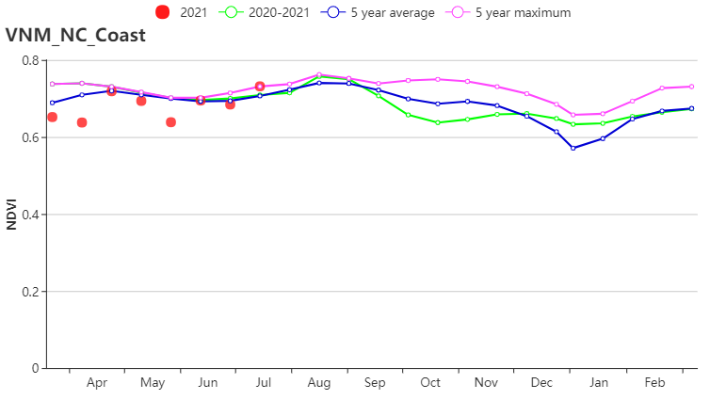
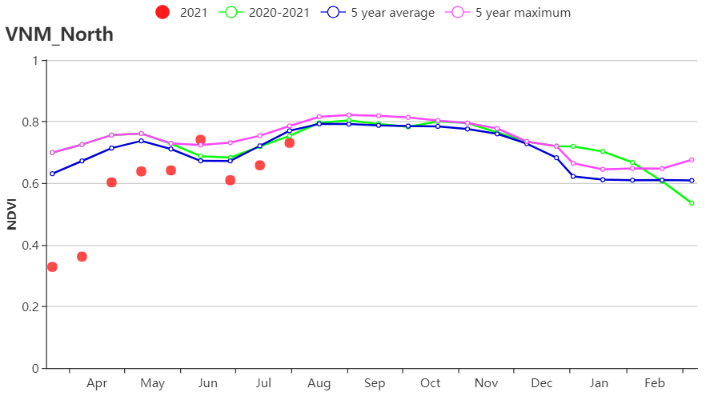
(i) 基于NDVI的作物生长过程线(越南中北部沿海地区(左)和越南东北部(右))
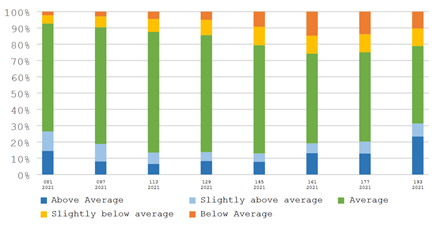
(j) 不同长势占耕地总面积比例动态变化
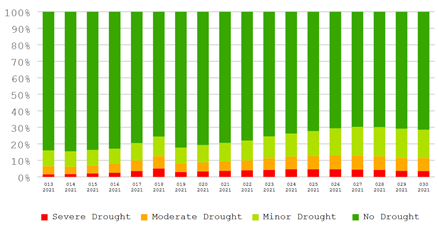
(k) 不同旱情等级发生面积占比动态变化
表3.79 越南农业生态分区2021年4月-7月与过去15年(15YA)同期农业气象指标
区域
| 累计降水 | 平均气温 | 光合有效辐射 | 潜在生物量 | ||||
当前值(mm) | 距平(%) | 当前值(℃) | 距平(℃) | 当前值(MJ/m2) | 距平(%) | 当前值(gDM/m2) | 距平(%) | |
越南中部高原区 | 1080 | -9 | 23.8 | 0.0 | 1234 | 8 | 780 | 9 |
湄公河三角洲 | 1059 | 0 | 27.9 | -0.1 | 1333 | 6 | 917 | 7 |
越南中北部沿海地区 | 1080 | 19 | 25.1 | 0.3 | 1300 | 9 | 856 | 11 |
越南东北部 | 1421 | 0 | 24.3 | 0.5 | 1211 | 5 | 779 | 7 |
越南西北部 | 1322 | 18 | 23.1 | 0.2 | 1255 | 6 | 779 | 8 |
红河三角洲 | 1186 | 12 | 27.2 | 0.4 | 1262 | 6 | 864 | 8 |
越南中南部沿海地区 | 606 | -36 | 24.6 | 0.3 | 1318 | 10 | 807 | 6 |
越南东南部 | 1113 | -5 | 26.5 | 0.0 | 1301 | 7 | 870 | 7 |
表3.78 越南农业生态分区2021年4月-7月与近5年(5YA)同期农情指标
区域
| 耕地种植比例 | 最佳植被状况指数 | |
当前值(%) | 距平(%) | 当前值 | |
越南中部高原区 | 99 | 0 | 0.91 |
湄公河三角洲 | 86 | 3 | 0.93 |
越南中北部沿海地区 | 98 | 0 | 0.95 |
越南东北部 | 100 | 0 | 0.97 |
越南西北部 | 100 | 0 | 0.96 |
红河三角洲 | 96 | -1 | 0.92 |
越南中南部沿海地区 | 96 | 0 | 0.86 |
越南东南部 | 95 | 1 | 0.92 |
